Purpose
To compare rates of topographic change in ocular hypertensive eyes that develop primary open-angle glaucoma (POAG) compared to eyes that do not, and to identify factors that influence the rate of change.
Design
Longitudinal, randomized clinical trial.
Methods
Four hundred forty-one participants (832 eyes) in the Confocal Scanning Laser Ophthalmoscopy Ancillary Study to the Ocular Hypertension Treatment Study were included. POAG was defined as repeatable visual field, photography-based optic disc changes, or both. The rate of topographic change in the 52 participants (66 eyes) who developed POAG was compared with that of participants who did not develop POAG using multivariable mixed effects models.
Results
In both univariate and multivariate analyses, the rate of rim area loss was significantly faster in eyes in which POAG developed than in eyes in which it did not (univariate mean, −0.0131 mm 2 /year and −0.0026 mm 2 /year, respectively). The significantly faster rate of rim area loss in black persons found in the univariate analysis did not remain significant when baseline disc area was included in the model. In multivariate analyses, the rate of rim area loss and other topographic parameters also was significantly faster in eyes with worse baseline visual field pattern standard deviation and higher intraocular pressure during follow-up. Moreover, a significant rate of rim area loss was detected in eyes in which POAG did not develop ( P < .0001). The rate of rim area loss in eyes with an optic disc POAG endpoint was significantly faster than in those with a visual field POAG endpoint.
Conclusions
The rate of rim area loss is approximately 5 times faster in eyes in which POAG developed compared with eyes in which it did not. These results suggest that measuring the rate of structural change can provide important information for the clinical management of ocular hypertensive patients. Additional follow-up is needed to determine whether the statistically significant change in the eyes in which POAG did not develop represents normal aging or glaucomatous change not detected by conventional methods.
Detection of glaucomatous change is one of the most challenging aspects of the clinical assessment of ocular hypertensive and glaucoma patients. The ability to differentiate between eyes that are progressing rapidly and eyes that are progressing slowly is important for the appropriate management of patients with glaucoma. Patients with rapidly progressing glaucoma may require adjustments to the treatment regimen to prevent the development of significant visual impairment, depending on their age and life expectancy. Alternatively, patients with slowly progressing disease may require less aggressive treatment when significant visual dysfunction is not expected in their lifetimes.
New image analysis techniques have improved our ability to identify structural change and, most importantly, to measure the rate of optic disc and retinal nerve fiber layer changes. Although imaging instruments have been available for almost 20 years, there is a paucity of information on the rate of structural change in patients with ocular hypertension. Because glaucoma is a slowly progressing disease that occurs in a relatively small proportion of ocular hypertensive patients, studies investigating structural change over time in ocular hypertensive patients require extensive follow-up and a large population. The Confocal Scanning Laser Ophthalmoscopy (CSLO) Ancillary Study to the Ocular Hypertensive Treatment Study (OHTS) was initiated in 1995 with annual CSLO imaging through 2009 to provide the long-term follow-up necessary to characterize structural change over time in ocular hypertensive patients. The purpose of the present study was to compare rates of change in topographic optic disc parameters in eyes in which primary open-angle glaucoma (POAG) developed with those eyes in which POAG did not develop and to evaluate factors that influence the rate of structural change.
Methods
Participants included in this report met the OHTS inclusion and exclusion criteria and participated in the CSLO Ancillary Study to the OHTS with at least 1 good-quality Heidelberg Retina Tomograph image during follow-up. Seven OHTS clinics participated in the CSLO Ancillary Study to the OHTS: Hamilton Glaucoma Center, University of California, San Diego, California; New York Eye and Ear Infirmary, New York, New York; Devers Eye Institute, Portland, Oregon; Henry Ford Medical Center, Troy, Michigan; Jules Stein Eye Institute, University of California, Los Angeles, Los Angeles, California; University of California, Davis, Davis, California; and Scheie Eye Institute, University of Pennsylvania, Philadelphia, Pennsylvania. The OHTS clinical trial registration number ( ClinicalTrials.gov ) is NCT00000125 . The CSLO ancillary study to the OHTS was conducted in compliance with the institutional review board requirements at each study center and the Health Insurance Portability and Accountability Act. Written informed consent for participation in this ancillary study was obtained from all participants before enrollment.
OHTS eligibility criteria required participants to have an intraocular pressure (IOP) ranging from 24 to 32 mm Hg in at least 1 eye and from 21 to 32 mm Hg in the fellow eye, as well as 2 normal, reliable automated achromatic 30-2 full threshold visual fields (Carl-Zeiss-Meditec, Dublin, California, USA) together with normal-appearing optic discs based on clinical examination and review of stereoscopic optic disc photographs. The optic disc reading center graders assessed photographs and estimated horizontal and vertical cup-to-disc ratios by contour.
The development of POAG, the primary endpoint for OHTS, was defined as a confirmed visual field abnormality or a confirmed clinically significant stereophotograph-based optic disc deterioration attributed to POAG by a masked endpoint committee. Specifically, the endpoint committee reviewed all confirmed visual field abnormalities and confirmed disc progression to determine whether the change was most probably the result of POAG, most probably not the result of POAG, or, in the case of disc progression, whether the progression was not clinically significant or an artifact. Endpoint committee members, masked as to treatment history, reviewed baseline and follow-up case report forms, visual fields, and stereoscopic disc photographs of both eyes. The first date of 3 consecutive abnormal visual fields or the first date of 2 consecutive sets of stereophotographs that classified the eye as reaching a POAG endpoint was used as the date for a POAG endpoint in all analyses.
As described previously, 3 10-degree images were obtained from both eyes and 3 15-degree Heidelberg Retina Tomograph (HRT; Heidelberg Engineering GmbH, Heidelberg, Germany) images were obtained from the right eye at the annual OHTS dilated fundus examination. If both 10-degree and 15-degree good-quality images were available, the 10-degree images were used in this analysis. The scans were obtained using the HRT 1 classic instrument throughout the study and were analyzed using software version 3.0. Corneal curvature measurements were used to correct images for magnification error. Corrective lenses were used during image acquisition when astigmatism was more than 1 diopter. The mean of 3 images was used for statistical analyses. As described previously, the CSLO Reading Center at the University of California, San Diego, conducted all quality assessment and image processing and certified all operators at every site according to standard protocols. In brief, CSLO Reading Center staff reviewed each image series (images at 32 consecutive focal planes) for clarity, appropriate focus and depth adjustment, and minimal eye movement. In addition, each mean topography image was monitored for adequate reproducibility (standard deviation of the mean image, <50 μm). Of a total of 7556 right and left eye testing sessions, data for 461 (6.1%) sessions were excluded from the analysis because of poor-quality images.
Because the CSLO Ancillary Study to the OHTS was funded after the initiation of enrollment in OHTS, 77% of participants completed their first CSLO examination visit after their OHTS baseline randomization visit. For this reason, 7 participants with documented optic disc deterioration or visual field abnormality that subsequently was confirmed and attributed to POAG at or before their first CSLO imaging session were excluded from the analysis. The current report includes all good-quality images from the first CSLO visit to the closure date for the OHTS (March 2009) or to the first suspicious date of POAG, whichever was first.
The rate of topographic change was measured using the following CSLO stereometric parameters: rim area and volume, cup area and volume, rim-to-disc area ratio, mean cup depth, retinal nerve fiber layer (RNFL) thickness and cross-sectional area, and cup shape. Contour lines outlining the disc margin of the baseline image, necessary for calculating stereometric parameters, were drawn by certified operators at the University of California, San Diego, CSLO Reading Center while viewing a copy of stereoscopic optic disc photographs from the OHTS Optic Disc Reading Center. HRT software automatically places the contour line on all follow-up images. Reference plane-based stereometric parameters were measured relative to the standard reference plane calculated 50 μm posterior to the mean height contour along a small temporal section of the contour line. The standard deviation of the mean image was used as a measure of image quality and was included as a covariate with repeated measures in multivariate models. Measurements of rim area also were evaluated in 6 sectors. The 6 sectors defined using standard HRT software are not of equal size; the temporal inferior, temporal superior, nasal superior, and nasal inferior sectors are each 45 degrees, whereas the temporal and nasal sectors are each 90 degrees.
In addition, the rate of change of the glaucoma probability score was calculated. This measure does not require a reference plane and is operator independent because it does not depend on an operator-drawn contour line to outline the disc margin. As described previously, the glaucoma probability score is based on a geometric model of 5 parameters (cup size, cup depth, rim steepness, horizontal retinal nerve fiber layer curvature, and vertical retinal nerve fiber layer curvature) that describes the shape of the optic disc and parapapillary retina (globally and locally). These parameters then are used as inputs to a relevance vector machine classifier, and the resulting output is summarized as the probability (between 0% and 100%) that the eye is glaucomatous (based on fit-to-training data from healthy and glaucoma eyes).
Statistical Analysis
The final OHTS and CSLO analysis data sets include all OHTS and CSLO data and POAG endpoints with initial suspicious dates that were confirmed and entered into the database by March 2009. The primary analysis compares the rate of topographic change in eyes in which POAG endpoints developed and eyes in which POAG endpoints did not develop, as determined by the endpoint committee. In addition, the rate of HRT topographic rate of change was estimated in those eyes that developed (1) an initial optic disc POAG endpoint only, (2) an initial visual field POAG endpoint and (3) reproducible optic disc change as determined by the OHTS Optic Disc Reading Center, including those not considered as POAG endpoints by the endpoint committee. Specifically, eyes determined to have optic disc progression by the OHTS Optic Disc Reading Center included eyes classified by the endpoint committee as an OHTS optic disc POAG endpoint (most probably the result of POAG), as well as eyes not considered a optic disc POAG endpoint (most probably not the result of POAG or not clinically significant or an artifact). For participants in whom unilateral POAG developed, only the POAG eye was included in the analysis.
All descriptive tables (means and percentages) of ophthalmic measures include the right and left eyes separately because each eye was used in the multivariate analysis. To compare patient-specific categorical variables (race, gender, family history of glaucoma, and randomization assignment to treatment arm) of participants who did or did not develop POAG, we used the Fisher exact test. Continuous variables (age, baseline visual field pattern standard deviation [PSD], baseline visual field mean deviation, central corneal thickness, baseline IOP, and baseline rim area) in eyes that did or did not develop POAG were compared using the Wilcoxon rank-sum test.
Mixed effects modeling was used to evaluate the relationship between HRT measurements and POAG status over time in univariate and multivariate models. Initially, in what we considered univariate analysis, we compared rates of topographic change in POAG versus non-POAG eyes without adjusting for any covariates. These univariate or single-covariate models included time, POAG, and an interaction term (time × POAG). Subsequently, we built 8 multivariate mixed-effects models that evaluated the influence of the following 8 covariates: randomization to medication, race, baseline age, central corneal thickness baseline visual field PSD, IOP (as repeated measures), disc area, and image quality (standard deviation of the mean topography) on the rate of rim area change. IOP and standard deviation of the mean image height were included as covariates with repeated measures in the multivariate models. These covariates were chosen for analysis based on their importance in previous publications on their effect on the development of glaucoma and their statistical significance in the univariate models. In multivariate models, appropriate 2-way interactions (e.g., covariate × time) and 3-way interactions (covariate × time × POAG) were studied to understand any multifactorial relationships. Mixed effects models with random intercepts and random slopes have been used previously in this setting to adjust for within-patient correlation in measurements between eyes from the same participant and to account for repeated measurements over time. Eyes that had a single eligible HRT visit were included in the models.
A P value less than .05 was considered statistically significant. Multiple testing corrections were not applied. Statistical analyses were performed using SAS software version 9.2 (SAS Institute, Cary, North Carolina, USA) and R version 2.10.0 ( http://www.r-project.org/ ).
Results
Four hundred forty-one participants (832 eyes) in the CSLO Ancillary Study to the OHTS met the inclusion criteria for this report. Baseline clinical and ocular factors of the 441 CSLO Ancillary Study participants included in this analysis are presented in Tables 1 and 2 . The mean baseline age (95% confidence interval [CI]) of the participants was 54.4 years (range, 53.5 to 55.2 years).
| Not at POAG Endpoint | POAG Endpoint | All | ||||
|---|---|---|---|---|---|---|
| No. | % | No. | % | No. | % | |
| Race | ||||||
| Other | 327 | 89.1 | 40 | 10.9 | 367 | 100 |
| Black | 62 | 83.8 | 12 | 16.2 | 74 | 100 |
| Sex | ||||||
| Female | 234 | 91.4 | 22 | 8.6 | 256 | 100 |
| Male | 155 | 83.8 | 30 | 16.2 | 185 | 100 |
| Parent/sibling family history of glaucoma | ||||||
| No | 256 | 85.6 | 43 | 14.4 | 299 | 100 |
| Yes | 133 | 93.7 | 9 | 6.3 | 142 | 100 |
| Randomization to medication | ||||||
| No | 193 | 89.4 | 23 | 10.6 | 216 | 100 |
| Eye | Not at POAG Endpoint | POAG Endpoint | All | |||||||
|---|---|---|---|---|---|---|---|---|---|---|
| No. | Mean | 95% CI | No. | Mean | 95% CI | No. | Mean | 95% CI | ||
| Follow-up (y) | 766 | 8.9 | 8.5 to 9.2 | 66 | 5.8 | 5.1 to 6.5 | 832 | 8.6 | 8.3 to 8.9 | |
| No. of HRT visits | 766 | 7.0 | 6.7 to 7.3 | 66 | 4.8 | 4.2 to 5.4 | 832 | 6.8 | 6.6 to 7.1 | |
| Baseline variables | ||||||||||
| Age (y) | 389 | 54.1 | 53.2 to 55.0 | 52 | 56.4 | 53.9 to 58.8 | 441 | 54.4 | 53.5 to 55.2 | |
| IOP (mm Hg) a | Right | 384 | 25.1 | 24.8 to 25.3 | 34 | 25.8 | 24.8 to 26.8 | 418 | 25.1 | 24.9 to 25.4 |
| Left | 382 | 24.9 | 24.7 to 25.2 | 32 | 25.8 | 24.9 to 26.8 | 414 | 25.0 | 24.8 to 25.2 | |
| Central corneal thickness (μm) a | Right | 352 | 577.0 | 573.0 to 581.0 | 33 | 562.0 | 550.7 to 573.3 | 385 | 575.7 | 572.0 to 579.4 |
| Left | 351 | 577.1 | 573.2 to 581.0 | 30 | 560.3 | 546.6 to 574.0 | 381 | 575.7 | 572.0 to 579.5 | |
| Visual field pattern standard deviation (dB) a | Right | 384 | 1.91 | 1.88 to 1.94 | 34 | 1.95 | 1.88 to 2.02 | 418 | 1.91 | 1.89 to 1.93 |
| Left | 382 | 1.89 | 1.86 to 1.92 | 32 | 1.99 | 1.90 to 2.08 | 414 | 1.90 | 1.87 to 1.93 | |
| Visual field mean deviation (dB) a | Right | 384 | 0.43 | 0.32 to 0.54 | 34 | 0.08 | −0.31 to 0.47 | 418 | 0.40 | 0.29 to 0.51 |
| Left | 382 | 0.44 | 0.32 to 0.56 | 32 | 0.09 | −0.36 to 0.54 | 414 | 0.42 | 0.31 to 0.53 | |
| Disc area (mm 2 ) | Right | 384 | 1.92 | 1.88 to 1.96 | 34 | 1.92 | 1.79 to 2.05 | 418 | 1.92 | 1.88 to 1.96 |
| Left | 382 | 1.93 | 1.89 to 1.97 | 32 | 1.92 | 1.77 to 2.07 | 414 | 1.93 | 1.89 to 1.97 | |
| Rim area (mm 2 ) | Right | 384 | 1.41 | 1.38 to 1.44 | 34 | 1.18 | 1.09 to 1.27 | 418 | 1.39 | 1.36 to 1.42 |
| Left | 382 | 1.41 | 1.38 to 1.44 | 32 | 1.18 | 1.09 to 1.27 | 414 | 1.39 | 1.36 to 1.42 | |
| Rim-to-disc area ratio | Right | 384 | 0.75 | 0.74 to 0.76 | 34 | 0.63 | 0.60 to 0.70 | 418 | 0.74 | 0.73 to 0.75 |
| Left | 382 | 0.75 | 0.74 to 0.76 | 32 | 0.63 | 0.58 to 0.68 | 414 | 0.74 | 0.73 to 0.75 | |
a From the Ocular Hypertension Treatment Study baseline visit.
Fifty-two participants (11.8%; 66 eyes) developed POAG and 389 (88.2%) participants (766 eyes) did not develop POAG during the follow-up period. Rates of change were calculated for all available visits for eyes not demonstrating POAG and until the first suspicious finding for those eyes that developed POAG. The median (first quartile to third quartile) length of follow-up was 11.0 years (range, 5.2 to 12.2 years) for participants not demonstrating POAG and 5.6 years (range, 4.0 to 8.0 years) to the time participants developed POAG. The median (first quartile to third quartile) number of HRT examinations was 8.0 (range, 3 to 10 examinations) for participants not demonstrating POAG and 4.5 examinations (range, 3 to 6 examinations) for participants who developed POAG. Of the 52 participants in whom POAG developed, 14 (26.9%) developed bilateral POAG and 38 (73.1%) developed unilateral POAG after the initial CSLO measurement. For participants in whom unilateral POAG developed, only the POAG eye was included in the analysis. Of the 66 POAG eyes, 20 (30.3%) eyes initially reached the endpoint based on visual fields alone, 45 (68.2%) eyes initially reached the endpoint based on stereophotographs alone, and 1 (1.5%) eye initially reached the endpoint based on concurrent visual fields and stereophotographs. Among the 74 black participants, 12 (16%) participants (13 eyes) developed POAG.
It should be noted that of the 45 eyes that initially were classified as having POAG only on the basis of stereophotographs, 8 (17.8%) eyes went on to develop visual field damage attributable to POAG and 8 (40%) of the 20 eyes classified initially as POAG based on only visual fields later developed optic disc changes attributable to POAG. To summarize, of the 66 POAG eyes, a total of 17 (25.8%) developed both optic disc and visual field changes attributable to POAG during the study follow-up period. The primary statistical modeling classifies the eyes as demonstrating POAG or not without regard to whether the POAG endpoint(s) for an eye was determined by visual fields, optic disc, or both.
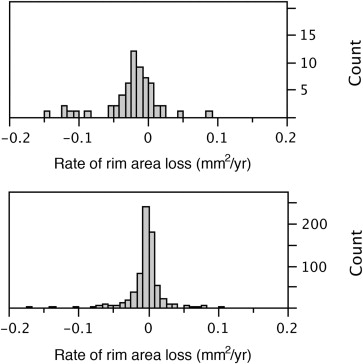
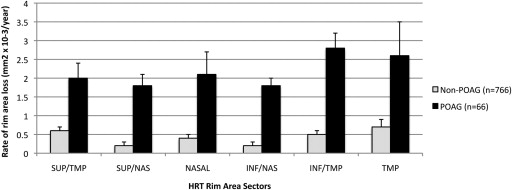
Based on the univariate mixed effects model, the mean rate of global rim area change was significantly faster ( P < .0001) in eyes in which POAG developed compared with eyes in which it did not (−0.0131 mm 2 /year; 95% CI, −0.0174 to −0.0089 mm 2 /year) and −0.0026 mm 2 /year (95% CI, −0.0036 to −0.0015 mm 2 /year), respectively ( Table 3 ). There was a broad distribution in rim area slopes, ranging from −0.150 to 0.088 mm 2 /year in eyes in which POAG developed and from −0.170 to 0.1 mm 2 /year in eyes in which POAG did not develop ( Figure 1 ). Among eyes that were in the fastest quartile of rim area loss (between −0.009 and −0.170 mm 2 /year), 22% developed POAG, compared with 3% to 5% in the slower 3 quartiles. In addition, the rate of rim area change was significantly faster in each of the 6 rim area regions (temporal, temporal inferior, temporal superior, nasal, nasal inferior, and nasal superior) in eyes in which POAG developed compared with eyes in which it did not ( P < .05 for each region; Figure 2 ).
| Parameter | Estimate | Standard Error | P Value |
|---|---|---|---|
| Intercept | 1.41 | 0.013 | <.0001 |
| POAG a | −0.200 | 0.039 | <.0001 |
| Time (y) | −0.003 | 0.0005 | <.0001 |
| POAG × time | −0.011 | 0.0022 | <.0001 |
a Variable indicating development of POAG endpoint (1 = yes, 0 = no).
We also investigated the rate of change as a percentage of the baseline values. Eyes that developed POAG had a mean baseline rim area of 1.12 mm 2 and the mean percentage decrease from baseline rim area was 0.99%/year (95% CI, 0.74% to 1.23%/year); in eyes in which POAG did not develop (mean baseline rim area, 1.39 mm 2 ), this rate represents an overall mean percentage rim area decrease of 0.18%/year (95% CI, 0.14% to 0.21%/year).
In eyes that did not develop POAG, we also found statistically significant rates of rim area decrease over time globally as well as in each of the 6 regions. Specifically, in univariate models, the average rate of change in global rim area (−0.0026 mm 2 /year; P < .0001) and rim area in the temporal inferior (−0.0005 mm 2 /year; P < .0001), nasal inferior (−0.0002 mm 2 /year; P = .0027), temporal superior (−0.0006 mm 2 /year; P < .0001), nasal superior (−0.0002 mm 2 /year; P < .0001), temporal (−0.0007 mm 2 /year; P = .0034), and nasal regions (−0.0004 mm 2 /year; P = .0061) were significantly less than 0.
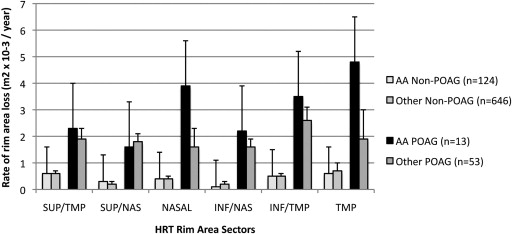
Among participants who developed POAG, the mean rate of rim area change over time was significantly ( P = .0262) faster in black participants (−0.0182 mm 2 /year; 95% CI, −0.0256 to −0.0107 mm 2 /year) compared with other participants (−0.0116 mm 2 /year; 95% CI, −0.0166 to 0.0065 mm 2 /year; Figure 3 ). Among those who did not develop POAG during the study period, the rate of rim area change was similar in black participants (−0.0024 mm 2 /year; 95% CI, −0.0048 to −0.0000 mm 2 /year) and other participants (−0.0026 mm 2 /year; 95% CI, −0.0038 to −0.0014 mm 2 /year; Figure 3 ). To see this difference, refer to Figure 3 : among eyes with POAG, black persons had a faster rate of rim area loss. However, when both race and disc area were included in the same multivariate model to explain the rate of change over time, only disc area remained significantly associated with the rate of rim area change; the P value for the interaction term of time with disc area was P = .0004 and was P = .6655 for the interaction term of time with race ( Table 4 ).
| Parameter | Estimate | Standard Error | P Value |
|---|---|---|---|
| Intercept | 1.4043 | 0.0130 | <.0001 |
| POAG a | −0.2160 | 0.0414 | <.0001 |
| Time | −0.0024 | 0.0003 | <.0001 |
| Disc area | 0.1684 | 0.0099 | <.0001 |
| Race | 0.0330 | 0.0333 | 0.3213 |
| POAG × time | −0.0099 | 0.0016 | <.0001 |
| POAG × race | 0.0730 | 0.0901 | .4182 |
| POAG × disc area | −0.0930 | 0.0309 | .0028 |
| Time × area | −0.0009 | 0.0003 | .0004 |
| Time × race | 0.0003 | 0.0007 | .6655 |
a Variable indicating development of POAG endpoint (1 = yes, 0 = no).
We evaluated the effect of 8 covariates (randomization assignment to treatment arm, race, baseline age, central corneal thickness, baseline visual field PSD, IOP as a longitudinal measure, disc area, and standard deviation of the mean image) individually on the rate of rim area loss in 8 separate multivariate models that included terms that specifically measured the contribution of each of these covariates on the rate of change over time ( Table 5 ). Specifically, the interaction term (covariate × time) was included to assess whether the covariate influences the rate of change. We found that when evaluated in separate single variable models, larger disc area ( P = .0005), worse baseline visual field PSD ( P = .0001), higher IOP (as a longitudinal measure; P < .0001), and higher standard deviation of the mean image ( P = .0009) each were associated individually with a faster rate of rim area loss. Randomization assignment to treatment arm ( P = .927), race ( P = .3448), central corneal thickness ( P = .1702), and baseline age ( P = .3438) were not significantly associated with the rate of rim area loss ( Table 5 ).
| Multivariate Models | Covariates | Main Effects | Association of Covariates on the Rate of Rim Area Change (Covariate × Time) | |
|---|---|---|---|---|
| Time | Covariate | |||
| 1 | Randomization to medication | |||
| Estimate | −0.0025 | −0.0130 | <0.0001 | |
| P value | .0011 | .6070 | .9270 | |
| 2 | Race | |||
| Estimate | −0.0025 | 0.1534 | −0.0007 | |
| P value | <.0001 | <.0001 | .3448 | |
| 3 | Baseline age | |||
| Estimate | −0.0011 | −0.0023 | <0.0001 | |
| P value | .4965 | .0962 | .3438 | |
| 4 | Central corneal thickness | |||
| Estimate | −0.0026 | 0.0120 | −0.0003 | |
| P value | <.0001 | .3358 | .1702 | |
| 5 | Baseline visual field pattern standard deviation | |||
| Estimate | −0.0026 | −0.0116 | −0.0009 | |
| P value | <.0001 | .1734 | .0001 | |
| 6 | IOP as a repeated measure | |||
| Estimate | −0.0028 | 0.0061 | −0.0017 | |
| P value | <.0001 | .0133 | <.0001 | |
| 7 | Disc area | |||
| Estimate | −0.0026 | 0.1647 | −0.0009 | |
| P value | <.0001 | <.0001 | .0005 | |
| 8 | Standard deviation of the mean topography as a repeated measure | |||
| Estimate | −0.0025 | 0.0014 | −0.0008 | |
| P value | <.0001 | .4728 | .0009 | |
Stay updated, free articles. Join our Telegram channel

Full access? Get Clinical Tree


