Purpose
To investigate how visual field (VF) clusters affect performance-based measures of the ability to perform activities of daily living and subjective measures of vision-related quality of life (QoL) in patients with glaucoma.
Design
Prospective, cross-sectional study.
Methods
setting : Institutional – Wills Eye Hospital. study population : 322 eyes of 161 patients with moderate-stage glaucoma. observation : VF tests were conducted using the Humphrey 24-2 Swedish Interactive Thresholding Algorithm standard perimeter. The VFs of each patient were divided into 5 clusters: nasal, temporal, central, paracentral, and peripheral. The score for each cluster was the averaged total deviation scores of all tested points within the cluster. Each cluster score was correlated with performance-based measures of visual function and subjective assessment of vision-related QoL. main outcome measures : The Compressed Assessment of Ability Related to Vision, the National Eye Institute Visual Functioning Questionnaire 25 (NEI VFQ-25), and the Modified Glaucoma Symptom Scale.
Results
The central VF cluster in the better eye was positively correlated with all Compressed Assessment of Ability Related to Vision (performance-based measure) subscales. The strongest correlation for the better eye was between the central VF cluster and total Compressed Assessment of Ability Related to Vision score (0.39, P < .001). The inferior VF hemisphere in both eyes was positively correlated with most Compressed Assessment of Ability Related to Vision subscales. Central VF clusters in the better eye were positively correlated with a majority of the NEI VFQ-25 subscales. There were no significant correlations between VF clusters and Modified Glaucoma Symptom Scale subscales.
Conclusions
Scores of central VF defects in the better eye and inferior hemisphere defects in both eyes were positively correlated with performance-based measures of the ability to perform activities of daily living. Glaucoma patients with central defects in the better eye were more likely to have reduced scores on assessments of vision-related QoL.
Glaucoma is the leading causes of irreversible blindness, affecting approximately 70 million individuals worldwide. Vision loss from glaucoma is known to decrease vision-related quality of life (QoL), with many patients having difficulties with driving, walking, taking medications, doing housework, preparing meals, and reading, along with a growing fear of blindness, social withdrawal, and depression.
Studies examining the relationship between visual field (VF) loss and vision-related QoL often use mean deviations (MD) to assess the severity of VF loss. However, patients with the same degree of MD may have different locations of VF defects that could have different effects on vision-related QoL domains. Therefore, identifying the locations of VF defects may provide a better understanding of the relationship between vision-related QoL and VF loss. Researchers have examined clustered VFs and vision-related QoL using the National Eye Institute Visual Function Questionnaire (NEI VFQ-25) and found that lower paracentral and peripheral VF defects in the better eye are positively correlated with the NEI VFQ-25. In other studies, relationships were found between VF hemifields and vision-related QoL, suggesting that inferior VF loss has a more substantial impact on patients’ vision-related QoL. While these studies have found associations between VF clusters with subjective assessments of vision-related QoL, there are limited data on how VF clusters affect performance-based measures of activities of daily living.
The aim of this study was to investigate how VF defect clusters affects both performance-based measures of activities of daily living and subjective measures of vision-related QoL in patients with glaucoma.
Methods
The Wills Eye Hospital Institutional Review Board approved the study protocol, and written informed consent was obtained from all patients in accordance with the Health Insurance Portability and Accountability Act (HIPAA) and the Declaration of Helsinki. This clinical trial was registered at www.clinicaltrials.gov , with registration number NCT01476644 .
This prospective, observational study was performed at the Wills Eye Hospital Glaucoma Research Center. This report is a sub-analysis of data obtained from the baseline visit of an ongoing cohort study conducted over a 4-year period. The design, methods, and results of the baseline visit of this study are described in detail elsewhere. In brief, patients were eligible to participate if they were between the ages of 21 and 85, were able to communicate in English, had a minimum 2-year diagnosis of open-angle glaucoma or chronic angle-closure glaucoma, and their Disk Damage Likelihood Scale (DDLS) score was between 5 and 8 in at least 1 eye (moderate-stage glaucoma). Patients were excluded from the study if they had neurologic or musculoskeletal diseases that would influence performance, incisional eye surgery within 3 months prior to enrollment, laser therapy within 1 month prior to enrollment, any cause of visual impairment other than glaucoma, or any medical condition that would preclude the subject’s providing reliable and valid data (eg, cognitive impairment).
The extent of glaucoma was measured using 3 measures: clinical measures, performance-based assessments that indicate the ability to carry out daily activities, and self-reported measurements of vision-related QoL.
Clinical Measures
Clinical measures included a complete ocular examination that documented subjects’ current symptoms, general health conditions, medications, and ocular comorbidities. The ocular examination included visual acuity (VA) assessment using the Early Treatment Diabetic Retinopathy Study (ETDRS) guidelines and a slit-lamp examination, including intraocular pressure (IOP) measurement using Goldmann applanation tonometry and a fundus examination. Two consecutive VF tests, separated by 25–50 minutes, were conducted using the Humphrey 24-2 Swedish Interactive Thresholding Algorithm standard perimeter (Carl Zeiss Meditec, Inc, Dublin, California, USA). Other clinical measures, including optic nerve head imaging using Cirrus spectral-domain optical coherence tomography (Carl Zeiss Meditec) and contrast sensitivity tests were also performed; their results are outside the scope of this manuscript and reported separately.
Performance-based Assessments of the Ability to Carry Out Daily Activities
Previous studies have used the Assessment of Disability Related to Vision (ADREV) test to assess activities of daily living in patients with glaucoma. The Compressed Assessment of Ability Related to Vision, the assessment used in the current study, was based on the ADREV. Both tests were found to correlate closely ; the Compressed Assessment of Ability Related to Vision is a shorter test that includes only 4 items: computerized motion detection, recognizing facial expressions, reading street signs, and finding objects in a room. In performing these tests, subjects used their own refractive correction in order to resemble normal function. Each item was scored on a scale of 0–7, with 0 as the lowest score and 7 as the highest. A total Compressed Assessment of Ability Related to Vision score was calculated as the average of the 4 items.
Self-reported Measurements of Subjective Well-being and Vision-Related Quality of Life
In this study, the NEI VFQ-25 was used. The NEI VFQ-25 consists of 42 multiple-choice questions assessing subjects’ vision using 12 subscales: general health, general vision, ocular pain, near activity, distant activity, social functioning, mental health, role difficulties, dependency, driving, color vision, and peripheral vision. Responses were converted to a 0–100 scale, with 0 as the lowest score and 100 as the highest score. One score was generated for each subscale. Then, all subscale scores, except general health, were averaged to create 1 composite score. This test was self-administered; if the patient requested help, the interviewer read the questions and answers to the subject and marked the score sheet.
A Modified Glaucoma Symptom Scale was used. The interviewer administered this test to assess glaucoma subjects’ symptom severity. The 10 symptoms assessed were burning/smarting/stinging, tearing, dryness, itching, soreness/tiredness, feeling of something in the eye, blurry/dim vision, difficulty seeing in daylight, difficulty seeing in dark places, and observation of a halo around lights. In each eye, responses were recorded on a scale from 1 to 4, with 1 indicating very bothersome complaints and 4 indicating no complaints or symptoms. The score on the 4-level scale was converted to a score on a 100-level scale, with 0 indicating a very bothersome problem and 100 indicating the absence of a problem. The final score was an unweighted average of the responses in each eye.
Visual Field Clusters
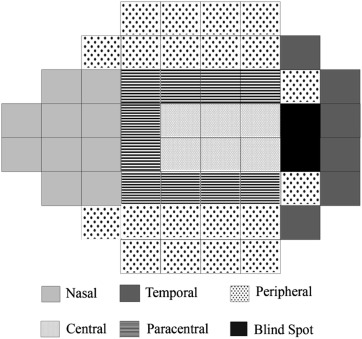
VFs were divided into 5 clusters: nasal, temporal, central, paracentral, and peripheral ( Figure ), a modification of the 10-cluster classification system described by Sawada and associates for 24-2 VFs. The scores for each of the 5 clusters were the averaged total deviation (TD) scores of all tested points within the cluster. As there were 2 consecutive VF tests done, the average of both tests was used for each cluster. The VF was also divided into a superior and inferior hemifield, and each hemifield score was averaged based on individual point-by-point TD scores.
Statistical Analysis
All data were analyzed using Statistical Analysis Software version 9.4 (SAS Institute, Cary, North Carolina, USA). Demographic data were described using percentages and frequencies, or using medians and interquartile ranges. Better or worse eye was determined by the MD. To test for association, Spearman correlation coefficients were used to assess the relationship between the 5 VF clusters and superior and inferior hemifields with the NEI VFQ-25, Modified Glaucoma Symptom Scale, and Compressed Assessment of Ability Related to Vision scores. P values <.05 were considered to be statistically significant and were adjusted using the dependent false discovery rate (dFDR) adjustment.
Results
A total of 322 eyes of 161 patients were included in the study. Table 1 summarizes the baseline demographic and clinical characteristics of the study population. The mean age was 64.6 years (range: 30–83 years); subjects were predominantly female (n = 86, 53%). The majority were white (59%) and African American (32%).
| Variable | Data (N = 161) |
|---|---|
| Age (y), mean (range) | 64.6 (30–83) |
| Sex, n (%) male | 75 (47%) |
| Race, n (%) | |
| White | 94 (58.4%) |
| African American | 52 (32.3%) |
| Asian | 13 (8.1%) |
| Hispanic | 2 (1.2%) |
| Diagnosis | |
| Primary open-angle glaucoma | 125 (77.6%) |
| Normal tension glaucoma | 23 (14.3%) |
| Pseudoexfoliation glaucoma | 7 (4.4%) |
| Angle-closure glaucoma | 6 (3.7%) |
| Visual acuity (logMAR), median (range) | |
| Better | 0.02 (−0.20 to 0.86) |
| Worse | 0.14 (−0.18 to 1.64) |
| MD, median (range) | |
| Better | −4.4 (−30.4 to 1.5) |
| Worse | −12.7 (−33.0 to −0.2) |
Table 2 shows the TD for the better and worse eye according to VF clusters and hemifields. The nasal cluster was most severely affected in both the better (average TD = −8.5 dB) and worse (average TD = −16.2 dB) eyes. The superior hemifield (average TD = −10.95 dB) was more severely affected than the inferior hemifield (average TD = −9.05 dB) in the better and worse eyes.
| Average TD (dB) Better Eye | Average TD (dB) Worse Eye | |||
|---|---|---|---|---|
| Mean | Range | Mean | Range | |
| Cluster | ||||
| Nasal | −8.5 | −31.2, 7.2 | −16.2 | −32.9, 1.3 |
| Temporal | −5.7 | −31.2, 16.0 | −10.2 | −31.8, 1.9 |
| Central | −5.7 | −30.3, 10.3 | −12.5 | −34.7, 1.3 |
| Paracentral | −6.7 | −41.5, 5.8 | −14.4 | −48.9, 1.0 |
| Peripheral | −6.8 | −30.6, 6.1 | −13.1 | −31.8, 0.6 |
| Hemifield | ||||
| Superior | −7.3 | −31.4, 14.7 | −14.6 | −35.3, 1.8 |
| Inferior | −6.1 | −33.4, 3.5 | −12.0 | −33.1, 1.0 |
Table 3 shows the correlations between the 5 VF clusters and total MD in the better eye, performance-based measures of activities of daily living, and subjective measures of vision-related QoL. The central cluster showed significant correlations with most Compressed Assessment of Ability Related to Vision and NEI VFQ-25 subscales. The strongest correlation was seen between the central cluster and total Compressed Assessment of Ability Related to Vision (0.39, P < .001). The Modified Glaucoma Symptom Scale did not show any significant correlations with any cluster.
| QoL Variable | Nasal | Temporal | Central | Paracentral | Peripheral | MD |
|---|---|---|---|---|---|---|
| Compressed Assessment of Ability Related to Vision total score | 0.28 (.012) | 0.33 (.003) | 0.39 (<.001) | 0.37 (<.001) | 0.36 (.001) | 0.37 (<.001) |
| Facial recognition | 0.21 (.127) | 0.23 (.062) | 0.28 (.012) | 0.32 (.003) | 0.29 (.009) | 0.28 (.009) |
| Finding objects | 0.20 (.155) | 0.25 (.037) | 0.28 (.010) | 0.29 (.008) | 0.25 (.037) | 0.27 (.016) |
| Motion detection | 0.25 (.037) | 0.27 (.014) | 0.28 (.011) | 0.28 (.011) | 0.28 (.010) | 0.30 (.007) |
| Reading street signs | 0.15 (.619) | 0.18 (.299) | 0.26 (.028) | 0.17 (.384) | 0.21 (.109) | 0.21 (.141) |
| NEI-VFQ-25 total score | 0.24 (.054) | 0.23 (.061) | 0.34 (.002) | 0.26 (.025) | 0.29 (.009) | 0.29 (.008) |
| Color vision | 0.24 (.040) | 0.28 (.012) | 0.26 (.029) | 0.27 (.014) | 0.30 (.007) | 0.26 (.025) |
| Dependency | 0.21 (.104) | 0.24 (.053) | 0.30 (.005) | 0.22 (.082) | 0.26 (.025) | 0.24 (.052) |
| Distance activities | 0.23 (.063) | 0.27 (.019) | 0.34 (.002) | 0.26 (.025) | 0.29 (.009) | 0.30 (.005) |
| Driving | 0.25 (.054) | 0.23 (.113) | 0.32 (.006) | 0.27 (.033) | 0.29 (.018) | 0.31 (.007) |
| General health | 0.09 (>.999) | 0.09 (>.999) | 0.17 (.416) | 0.08 (>.999) | 0.09 (>.999) | 0.11 (>.999) |
| General vision | 0.17 (.410) | 0.17 (.405) | 0.32 (.004) | 0.23 (.063) | 0.22 (.077) | −.01 (>.999) |
| Mental health | 0.19 (.243) | 0.11 (>.999) | 0.25 (.029) | 0.16 (.579) | 0.19 (.254) | 0.16 (.525) |
| Near activities | 0.15 (.602) | 0.16 (.541) | 0.25 (.032) | 0.19 (.213) | 0.20 (.173) | 0.20 (.177) |
| Ocular pain | −.03 (>.999) | −.01 (>.999) | −.01 (>.999) | −.01 (>.999) | 0.02 (>.999) | −.01 (>.999) |
| Peripheral vision | 0.25 (.036) | 0.28 (.013) | 0.30 (.006) | 0.27 (.019) | 0.30 (.005) | 0.31 (.005) |
| Role difficulties | 0.09 (>.999) | 0.2 (.597) | 0.24 (.047) | 0.13 (>.999) | 0.14 (.969) | 0.14 (.783) |
| Social functioning | 0.24 (.053) | 0.33 (.002) | 0.31 (.005) | 0.30 (.007) | 0.31 (.004) | 0.29 (.008) |
| Modified Glaucoma Symptom Scale score: binocular | 0.02 (>.999) | 0.04 (>.999) | 0.02 (>.999) | −.02 (>.999) | 0.07 (>.999) | 0.05 (>.999) |
| Modified Glaucoma Symptom Scale score: better eye | 0.04 (>.999) | 0.08 (>.999) | 0.02 (>.999) | −.03 (>.999) | 0.11 (>.999) | 0.06 (>.999) |
| Modified Glaucoma Symptom Scale score: worse eye | 0.01 (>.999) | 0.03 (>.999) | 0.03 (>.999) | −.01 (>.999) | 0.06 (>.999) | 0.04 (>.999) |
Table 4 shows the correlations between the 5 VF clusters and outcome measures in the worse eye. The strongest correlation was seen in the temporal cluster, with the total Compressed Assessment of Ability Related to Vision (0.40, P < .01). The Modified Glaucoma Symptom Scale did not show any significant correlation with any cluster.
| QoL Variable | Nasal | Temporal | Central | Paracentral | Peripheral |
|---|---|---|---|---|---|
| Compressed Assessment of Ability Related to Vision total score | 0.22 (.088) | 0.40 (<.001) | 0.28 (.011) | 0.25 (.036) | 0.33 (.003) |
| Facial recognition | 0.12 (>.999) | 0.26 (.026) | 0.15 (.771) | 0.15 (.684) | 0.19 (.208) |
| Finding objects | 0.22 (.084) | 0.32 (.003) | 0.29 (.007) | 0.22 (.101) | 0.29 (.008) |
| Motion detection | 0.23 (.054) | 0.26 (.022) | 0.19 (.220) | 0.27 (.016) | 0.24 (.046) |
| Reading street signs | 0.12 (>.999) | 0.32 (.003) | 0.23 (.097) | 0.17 (.440) | 0.24 (.048) |
| NEI VFQ-25 total score | 0.34 (.001) | 0.32 (.004) | 0.30 (.006) | 0.35 (.001) | 0.36 (.001) |
| Color vision | 0.24 (.040) | 0.22 (.095) | 0.20 (.181) | 0.22 (.082) | 0.26 (.021) |
| Dependency | 0.25 (.032) | 0.24 (.042) | 0.21 (.105) | 0.22 (.077) | 0.25 (.034) |
| Distance activities | 0.30 (.005) | 0.31 (.004) | 0.28 (.010) | 0.31 (.005) | 0.32 (.003) |
| Driving | 0.26 (.041) | 0.26 (.044) | 0.19 (.321) | 0.24 (.078) | 0.27 (.032) |
| General health | 0.03 (>.999) | 0.11 (>.999) | 0.10 (>.999) | 0.08 (>.999) | 0.13 (>.999) |
| General vision | 0.26 (.021) | 0.25 (.031) | 0.29 (.007) | 0.29 (.008) | 0.29 (.007) |
| Mental health | 0.25 (.033) | 0.16 (.523) | 0.22 (.097) | 0.22 (.080) | 0.25 (.032) |
| Near activities | 0.22 (.082) | 0.30 (.006) | 0.25 (.029) | 0.24 (.053) | 0.27 (.014) |
| Ocular pain | 0.10 (>.999) | 0.07 (>.999) | 0.09 (>.999) | 0.16 (.549) | 0.15 (.641) |
| Peripheral vision | 0.35 (.001) | 0.35 (.001) | 0.33 (.003) | 0.37 (<.001) | 0.36 (<.001) |
| Role difficulties | 0.30 (.005) | 0.29 (.008) | 0.26 (.025) | 0.29 (.007) | 0.32 (.003) |
| Social functioning | 0.29 (.008) | 0.35 (.001) | 0.27 (.014) | 0.31 (.004) | 0.36 (<.001) |
| Modified Glaucoma Symptom Scale score: binocular | 0.17 (.419) | 0.16 (.597) | 0.09 (>.999) | 0.17 (.441) | 0.18 (.279) |
| Modified Glaucoma Symptom Scale score: better eye | 0.08 (>.999) | 0.10 (>.999) | 0.02 (>.999) | 0.07 (>.999) | 0.09 (>.999) |
| Modified Glaucoma Symptom Scale score: worse eye | 0.21 (.139) | 0.18 (.273) | 0.12 (>.999) | 0.21 (.105) | 0.23 (.063) |
Stay updated, free articles. Join our Telegram channel

Full access? Get Clinical Tree


