Purpose
To evaluate intraocular pressure (IOP) after phacoemulsification in patients with medically controlled open-angle glaucoma (OAG), and examine the association of biometric variables to IOP changes.
Design
Retrospective case series.
Methods
Open-angle glaucoma patients without prior incisional glaucoma surgery undergoing phacoemulsification by a single surgeon between January 1997 and October 2011 were evaluated. Patient charts were reviewed to obtain demographic information, preoperative glaucoma medications, severity and treatment measures, and preoperative and postoperative IOP.
Results
A total of 157 eyes (157 patients) were included in the study. The average preoperative IOP of 16.3 ± 3.6 mm Hg decreased to 14.5 ± 3.4 mm Hg at 1 year ( P < .001). Sixty eyes (38%) required additional medications or laser for IOP control within the first year postoperatively, or had a higher IOP at postoperative year 1 without medication change. Among eyes without postoperative medication changes (n = 102), higher preoperative IOP ( P < .001), older age ( P = .006), and deeper anterior chamber depth ( P = .015) were associated with lower postoperative IOP.
Conclusions
Phacoemulsification resulted in a small average decrease in IOP in patients with OAG. A sizeable proportion of medically controlled glaucoma patients with open angles undergoing phacoemulsification experienced an increase in IOP or required more aggressive treatment to control IOP postoperatively.
Cataract extraction by phacoemulsification may lead to a decrease in the intraocular pressure (IOP) in patients both with and without glaucoma. In primary angle-closure glaucoma in particular, phacoemulsification as a sole procedure is effective for IOP reduction. This is also true in patients with other secondary forms of open-angle glaucoma (OAG) such as pseudoexfoliation, in whom the disease process may lead to angle narrowing owing to zonular laxity. Multiple studies have demonstrated that patients with or without glaucoma with IOP above 21 mm Hg experience a more dramatic IOP-lowering effect after phacoemulsification than those with IOP that is medically treated into the statistically normal range of 10-21 mm Hg. However, the evidence is less clear in patients whose open-angle glaucoma is considered to be under effective medical control. We investigated the effect of phacoemulsification on IOP in patients with OAG in whom the IOP was considered to be controlled with medical therapy prior to surgery.
Patients and Methods
This retrospective case series evaluated OAG patients undergoing phacoemulsification as a sole procedure, performed by 1 surgeon (P.P.C.) between January 1, 1997 and October 31, 2011 at the University of Washington. This study was approved by the Human Subjects Division of the University of Washington. The diagnosis of glaucoma was based on characteristic optic nerve findings and/or visual field loss. The indication for surgery in these patients was reduced vision attributable to visually significant cataract. All patients had preoperative gonioscopy showing open angles without peripheral anterior synechiae or areas of appositional closure. Patients were excluded if they had a prior trabeculectomy or other incisional glaucoma surgery, had undergone any change in medication regimen within 3 months prior to surgery, did not have at least 3 prior IOP measurements or did not have at least 1 year of follow-up after surgery, or had a complication during phacoemulsification. Patients with pseudoexfoliation, pigment dispersion, uveitis, or steroid-induced glaucoma were also excluded. Patients were also excluded if in the year following phacoemulsification they underwent any additional non-glaucoma-related surgical or laser procedures, including laser capsulotomy. When both eyes of 1 patient were eligible, the eye undergoing surgery first was chosen for the study. Pertinent clinical information prior to phacoemulsification and in the year subsequent to surgery was recorded. This included baseline demographics, disease severity indices, and ophthalmic biometry obtained by IOL Master (Carl Zeiss Meditec Inc, Dublin, California, USA) or ultrasound A-scan (Innovative Imaging Inc, Ellex, Minneapolis, Minnesota, USA). Preoperative IOP was defined as the mean of the IOP readings at the 3 preceding clinic visits and postoperative IOP was recorded for all follow-up visits. One-year-postoperative IOP was considered to be the single-visit reading obtained at the first routine visit at least 1 year postoperatively. All IOP measurements were obtained using Goldmann applanation tonometry, in almost all cases by a technician prior to the patient’s seeing the treating physician.
Retrobulbar, topical, or topical with intracameral anesthesia was used. A scleral tunnel or temporal clear corneal incision was followed by injection of viscoelastic (Healon; Abbott Medical Optics, Abbott Park, Illinois, USA), continuous tear capsulorrhexis, and standard phacoemulsification with placement of an intraocular lens in the posterior chamber. Wounds not found to be watertight were sutured with 10-0 nylon suture. In some eyes, the pupil was manually stretched with Kuglen hooks prior to capsulorrhexis.
Patients were identified who showed lowered or stable IOP at 1 year without any increase in medications or additional laser trabeculoplasty vs those who required additional medications or laser for IOP control, or whose IOP was higher after surgery with the same medication regimen. We performed an additional analysis of patients who had no change in their medication regimen during the year following surgery regardless of their IOP response to phacoemulsification (n = 102).
Statistical Analyses
We considered potential factors for differential changes in IOP after phacoemulsification individually using scatterplots and box plots. Correlations among continuous factors were examined numerically and graphically with scatterplots, and for categorical factors contingency tables and box plots. Multiple linear regression models were considered as suggested by descriptive statistics and nonautomatic stepwise inclusion of risk factors. Statistical analyses were carried out using PASW Statistics 18.0.0 (IBM SPSS Inc, New York, New York, USA).
Results
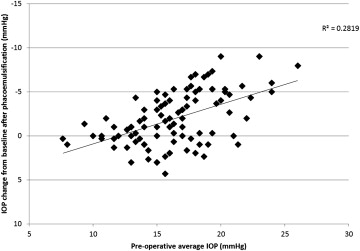
The study population included 157 eyes of 157 patients ( Table 1 ). One eligible eye (0.6%) required trabeculectomy within the first 2 months after phacoemulsification and was excluded from the IOP analysis at 1 year, but was included in our other analyses. Intraocular pressure decreased by a mean of −1.8 ± 3.1 mm Hg in the population after 1 year of follow-up ( P < .001). Use of glaucoma medications was nearly unchanged overall: preoperative mean 1.85 ± 1.01 medications vs postoperative mean 1.92 ± 1.07 medications ( P = .11). Ten eyes (6.4%) had an increase in IOP of ≥3 mm Hg, while 60 eyes (38%) had a decrease of ≥3 mm Hg. Among the 21 eyes (13%) that did not have any change in their medications after phacoemulsification but had a higher IOP after surgery (maximum increase 4 mm Hg), nearly all (20/21, 95%) had a preoperative average IOP below 20 mm Hg ( Figure ).
| Characteristic | Value |
|---|---|
| Age (y) | 74.4 ± 10.2 (range 42–99) |
| Sex | |
| Female | 83 (52.9%) |
| Male | 74 (47.1%) |
| Race | |
| White | 118 (75.2%) |
| Asian | 19 (12.1%) |
| African American | 15 (9.6%) |
| Other | 5 (3.2%) |
| Visual field | |
| Mean deviation (dB) | −5.72 ± 5.93 |
| Pattern standard deviation (dB) | 4.84 ± 3.78 |
| Preoperative visual acuity (logMAR) | 0.394 ± 0.286 (median 0.301) (Snellen equivalent 20/50, median 20/40) |
| Preoperative intraocular pressure (mm Hg) | 16.27 ± 3.54 |
| Preoperative number of glaucoma medications | 1.85 ± 1.01 |
| Postoperative visual acuity (logMAR) | 0.098 ± 0.221 (median 0.0) (Snellen equivalent 20/20, median 20/20) |
| Postoperative intraocular pressure (mm Hg) a | 14.47 ± 3.37 |
| Postoperative number of glaucoma medications a | 1.92 ± 1.07 |
| Change in intraocular pressure (mm Hg) a | −1.79 ± 3.08 |
| Axial length (mm) | 24.61 ± 1.97 |
| Anterior chamber depth (mm) | 3.12 ± 0.45 |
| Gonioscopy grade (Shaffer) | 3.14 ± 0.76 (range 2–4) |
| Central corneal thickness (μm) | 534.3 ± 41.1 |
Patients who had a reduction of IOP after phacoemulsification with either the same or fewer medications and without any additional glaucoma laser (n = 91, 58%) were compared with those who required additional medications for IOP control (n = 37), who required laser trabeculoplasty (n = 1) or trabeculectomy (n = 1), or whose IOP was higher after surgery with the same medication regimen (n = 21; total N with worse IOP control = 60 [38%]). Six eyes (3.7%), which had a higher IOP postoperatively while using fewer medications because the treating physician felt the higher IOP level was clinically acceptable, were excluded from this analysis. No significant differences were detected with regard to age, sex, race, ophthalmic biometry, preoperative IOP, preoperative glaucoma medications, gonioscopy, surgical techniques and maneuvers, or visual field indices ( Table 2 ).
| Risk Factor | IOP Higher on Same Medications, or More Treatment Required (n = 60) | IOP Stable or Lower, Same or Fewer Medications (n = 91) | P |
|---|---|---|---|
| Age (y) | 74.7 ± 9.5 | 74.3 ± 10.7 | .793 a |
| Sex (male) | 26 (48.1%) | 46 (47.4%) | .866 b |
| Race | .496 c | ||
| White | 47 (78.3%) | 66 (72.5%) | |
| Asian | 4 (6.7%) | 15 (16.5%) | |
| African American | 5 (8.3%) | 9 (9.9%) | |
| Other | 4 (6.7%) | 1 (1.1%) | |
| Axial length (mm) | 24.49 ± 1.72 | 24.68 ± 2.14 | .574 a |
| Anterior chamber depth (mm) | 3.14 ± 0.48 | 3.12 ± 0.44 | .748 a |
| Visual field | |||
| Mean deviation (dB) | −5.08 ± 5.01 | −5.64 ± 5.96 | .566 a |
| Pattern standard deviation (dB) | 4.45.15 ± 3.55 | 5.03 ± 3.94 | .380 a |
| Preoperative IOP (mm Hg) | 15.93 ± 3.54 | 16.69 ± 3.44 | .191 a |
| Preoperative gonioscopy grade (Shaffer) | 3.15 ± 0.72 | 3.13 ± 0.78 | .867 c |
| Preoperative glaucoma medications | 1.65 ± 0.95 | 1.90 ± 0.99 | .198 c |
| Central corneal thickness (μm) | 543.2 ± 39.3 | 529.4 ± 42.5 | .086 a |
| Prior laser trabeculoplasty | 8 (15.1%) | 17 (17.5%) | .503 b |
| Iris manipulation | 5 (8.5%) | 12 (12.4%) | .437 b |
| Intraocular lens type | .861 b | ||
| Silicone | 39 (65%) | 61 (67.1%) | |
| Acrylic | 21 (35%) | 30 (32.9%) |
a 2-tailed independent sample t test.
To avoid the confounding effects of medication changes, we evaluated the effect of phacoemulsification on IOP among patients who did not have any change in the number or types of glaucoma medications after surgery (n = 102). Univariate analyses revealed a statistically significant correlation with preoperative average IOP measurement but failed to detect a statistically significant correlation with anterior chamber depth or gonioscopy grade. A multiple linear regression was performed using all factors in Table 3 . Using all factors in a single analysis resulted in statistically significant association between change in IOP with both preoperative IOP and age; the other factors were not independently associated because of relationships between them. For example, gonioscopy, anterior chamber (AC) depth, and axial length were all correlated (data not shown). These factors were then removed using nonautomatic stepwise exclusion and the preoperative IOP, age, and AC depth were each found to have statistically significant associations with change in IOP after phacoemulsification. A model was developed using these 3 factors ( Table 4 ). In this population, age is correlated with anterior chamber depth, with older age associated with shallower AC depth (data not shown, r = −0.349, P < .001), and multicollinearity was minimal (Variance Inflation Factor [VIF] 1.170, 1.144). In this model, a higher preoperative IOP, deeper anterior chamber, and greater age were each associated with a greater reduction in IOP at 1 year after phacoemulsification. The equation
IOP change = 15.538 − 0.482 × ( preoperative IOP in mm Hg ) − 0.068 × ( age in years ) − 1.465 × ( anterior chamber depth in millimeters )
Stay updated, free articles. Join our Telegram channel

Full access? Get Clinical Tree


