Purpose
To examine how demographic and geographic variations in US populations from 2011 to 2050 will contribute to estimated numbers of primary open-angle glaucoma (POAG) cases.
Design
Cross-sectional study.
Methods
Prevalence rates from selected population-based studies were used to estimate the number of persons aged 40 years and older with POAG in the United States. For calculation, the age-, sex-, and race/ethnicity-specific prevalence rates were multiplied by the US Census estimates and projections from 2011 to 2050. Main outcome measures are estimated numbers of persons with POAG in different age, sex, and racial/ethnic groups and total and per capita POAG rates by state.
Results
In 2011, 2.71 million persons in the United States have POAG, with the highest estimated number among populations aged 70 to 79 years (31%), women (53%), and non-Hispanic whites (44%). The largest demographic group is non-Hispanic white women. In 2050, an estimated 7.32 million persons will have POAG, with the highest number among populations aged 70 to 79 years (32%), women (50%), and Hispanics (50%). The largest demographic group will shift to Hispanic men. During the next 40 years, the highest per capita POAG rates will double in New Mexico, Texas, and Florida.
Conclusions
Despite the high prevalence of POAG in African Americans and Hispanics, the largest group in the United States is currently among older non-Hispanic white women but is expected to shift to Hispanic men over the next few decades. Given this shift, the greatest yield from screening programs is likely to be in those states with high numbers of non-Hispanic white women and Hispanic men.
Glaucoma, a leading cause of blindness worldwide, remains a significant public health problem. It is estimated that the number of people worldwide with glaucoma will increase from 60.5 million in 2010 to 79.6 million in 2020. Primary open-angle glaucoma (POAG) is the most common type, constituting 74% of all persons with glaucoma. As the population in the United States ages, the number of persons with POAG is rising. Additionally, increasing immigration to the United States in the past decades has further contributed to the rising number. The percentage of people of Hispanic/Latino and Asian origins has more than doubled in recent decades. According to one estimate, the data on POAG prevalence rates in Hispanics/Latinos and other minorities are lacking. Recently, the Los Angeles Latino Eye Study (LALES) and other large population-based studies on Asians have concluded and reported their results. Data from these recent population-based studies have not been included in previous estimates. Analyses including these more recent data will improve the accuracy of the estimation, particularly for these minority groups. Furthermore, most previous estimates of POAG have focused on prevalence and have highlighted the high rates in African Americans and Hispanics/Latinos. In this study, we estimate the overall numbers of persons with POAG and highlight how demographic differences within the United States are related to geographic variations in the burden of POAG, elucidating how demographic changes in the population over the next 4 decades are likely to change the groups that contribute to the greatest burden of this disease in the United States.
Methods
Data Sources
We calculated the number of persons with POAG in the United States for 5 racial/ethnic groups: non-Hispanic whites, African Americans, Hispanics/Latinos, Asians, and other minorities. Based on the Census, the term “other minorities” refers to populations classified as American Indian, Alaska Native, Native Hawaiian, and other Pacific Islander. A MEDLINE (Medical Literature Analysis and Retrieval System Online) search was performed to identify representative studies for each racial/ethnic group of the US population. Search terms used included the MeSH (medical subject headings) terms “glaucoma, open-angle” and “prevalence” with restrictions on language (English) and date (1/1/1986 to 11/15/2010). A total of 258 relevant abstracts were identified and reviewed. All of the US population estimates and projections were obtained from data provided on www.census.gov .
Study Selection and Data Extraction
The representative studies for each racial/ethnic group in the United States were selected based on: 1) population-based studies conducted in the United States; 2) diagnostic criteria based on assessment of visual field and/or optic nerve; and 3) available age-, sex-, and racial/ethnic-specific prevalence rates for the studied population aged 40 years or older. Based on our review, 6 major population-based studies have been conducted in the United States for predominantly non-Hispanic white populations (Framingham Eye Study, Baltimore Eye Survey, and Beaver Dam Eye Study), mixed white and African American populations (Baltimore Eye Survey and Salisbury Eye Evaluation Study), and Hispanic/Latino populations (Proyecto VER [Vision and Eye Research] and LALES). Based on our selection criteria, the Baltimore Eye Survey was selected to represent non-Hispanic white and African American populations, and the LALES was chosen to represent Hispanic/Latino populations. The Supplemental Table (available at AJO.com ) summarizes diagnostic criteria for POAG for each study and reason to include/exclude each study. In brief, we excluded the Framingham Eye Study because the screening method used might lead to underestimation of POAG prevalence. In this study, screening examination was performed in 10% of the sample. In addition, we excluded the Beaver Dam Eye Study because the study’s criteria for POAG diagnosis were based on intraocular pressure, which is not included in the current definition of POAG. Furthermore, the Salisbury Eye Evaluation Study was excluded because the study was limited to older participants, aged 73 years or greater. In addition, details of vertical cup-to-disc ratio and symmetry were not described. For the US Hispanics/Latinos, the Proyecto VER was not included based on its limited diagnostic criteria. Specifically, it included only cases with structural and functional evidence in category 1 and advanced cases of structural damage with unproven visual field loss in category 2 (vertical cup-to-disc ratio >0.85). Thus the study was likely to underestimate the prevalence. On the other hand, the LALES criteria are similar to those used in other selected US studies. Lastly, because data on prevalence rate of POAG in US Asians and other minorities are lacking, an alternative approach was applied. We found 3 major population-based studies or surveys of Asian populations, including the population survey of the Chinese residents in Singapore, Tanjong Pagar district; the Singapore Malay Eye Study; and the Beijing Eye Study. We selected the study of Chinese residents of Singapore to represent US Asians for 2 reasons: first, the Chinese are the largest group of US Asians; and second, the socioeconomic background of Chinese residents in Singapore is similar to that of residents in the United States. Specifically, Singapore and the United States ranked eleventh and thirteenth, respectively, according to the Economist Intelligent Unit’s quality-of-life index based on 9 quality-of-life factors, including income and life expectancy. In addition, the Singaporean government provides subsidized medical insurance for retirees, “Medisave,” comparable to the US “Medicare.” For other minorities, we used estimated prevalence rates developed by the Eye Disease Prevalence Research Group (EDPRG). Specifically, given that there are no studies that have been conducted on racial/ethnic groups included in the “other minorities” group, the EDPRG used the unweighted average of the pooled stratum-specific prevalence rates for whites, African Americans, and Hispanics/Latinos for the other minorities group. Table 1 provides characteristics of selected studies for each race/ethnicity.
| Characteristic | BES | BES | LALES | Singapore Study | EDPRG |
|---|---|---|---|---|---|
| Race/ethnicity | Non-Hispanic white | African American | Hispanic | Asian | Other minorities a |
| Sample size | 2913 | 2395 | 6142 | 1232 | 23 012 b |
| Sex (women/men) | 1.3 | 1.7 | 1.4 | 1.2 | 1.4 |
| Age range (y) | 40+ | 40+ | 40+ | 40+ | 40+ |
| Overall prevalence of POAG, % (95% CI) | 1.7 (1.1–2.3) | 5.6 (4.6–6.6) | 4.7 (4.2–5.3) | 2.4 (1.6–3.2) | 1.86 (1.8–2.0) |
a American Indian, Alaska Native, Native Hawaiian, and other Pacific Islander.
b The EDPRG “other minorities” prevalence is an unweighted pooled prevalence rate derived from the sum of all participants from non-Hispanic white, African American, and Hispanic categories used in the EDPRG estimate of the prevalence of POAG.
Data Synthesis
The principal investigator and/or co-investigator of the selected studies were contacted to obtain age-, sex-, and racial/ethnic-specific prevalence rates for POAG. Of note, because the data for populations aged 80 years and older are not available in the Singapore Study, we used the prevalence rates for population aged 70 to 79 years for population aged 80 years and older.
All of the US population estimates and projections were obtained from data provided on www.census.gov . We used a 2008 updated version for population estimate and a 2009 updated version for population projection based on the US Census 2000 for the analyses. The updated versions were adjusted for annual birth rates, death rates, and net immigration. Specifically, this adjustment was calculated by the Census.
The detailed methods for population estimates and projection can be found at www.census.gov . In brief, based on the 2000 Census, the Census Bureau produces quarterly updated estimates of the US population. The updated estimates are calculated from the base population, adding births to US resident women, subtracting deaths to US residents, and adding net international migrants. Data for births to US women, deaths to US residents, and net international immigration are derived from the National Health Center for Health Statistics and American Community Survey. In the present study, we used the 2008 updated estimate, as recommended by the US Census. In addition, the Census Bureau provides data for population projections from 2000 to 2050. In the present study, we used the middle series of the 2009 version for population projections. In brief, the projections were calculated using a “cohort-component” method. Specifically, for each passing year, 1 year of age was added to each person, and the number was then adjusted by survival rate and net immigration. A new birth cohort, the population under 1 year of age, was calculated by applying projected age-specific fertility rates to the female population aged 15 to 49 years. In the middle series, fertility was assumed to remain almost constant (2.1 births per woman); life expectancy is projected to increase from 76.0 years in 1993 to 82.6 years in 2050; and net immigration remains constant at 880 000 per year.
Current and Projected Estimates of Persons With Primary Open-Angle Glaucoma From 2011 to 2050
Tables for age-, sex-, and race/ethnicity-specific US estimates and projections from 2011 to 2050 were obtained from www.census.gov . The strata-matched prevalence rates for POAG were multiplied by the population estimates and projections to calculate the number of persons with POAG in the United States from 2011 to 2050.
Current and Projected Estimates of Persons With Primary Open-Angle Glaucoma by State and Region
Customized tables for estimates of the US population in 2009 (current) and 2050 (projected) by age, sex, and race/ethnicity for each state and region were obtained from www.census.gov . The strata-matched prevalence rates for POAG were then multiplied by the population estimates to calculate the number of persons with POAG and the per capita burden (density in percent) of POAG in the United States by state and region.
The total number of persons with POAG from 2011 to 2050 was computed by combining estimated number of persons with POAG by age, sex, and race/ethnicity. All analyses were performed using SAS (Statistical Analysis System) (SAS Institute Inc, Cary, North Carolina, USA) and Microsoft Excel 2007 (Microsoft Corporation, Bellevue, Washington, USA).
Sensitivity Analysis
We conducted a sensitivity analysis of our assumptions regarding the prevalence rate of POAG in the United States for different racial and ethnic groups. We tested the impact of our assumptions by making changes in the main model and by modifying prevalence rates based on available data. For scenario 1, the pooled prevalence rates from the EDPRG, the combined data for European-derived non-Hispanic whites, were used for non-Hispanic whites. For scenario 2, the pooled prevalence rates from the Proyecto VER and LALES were used for Hispanics/Latinos. For scenario 3, the pooled prevalence rates from the EDPRG, the unweighted averages of the pooled stratum-specific prevalence rates for non-Hispanic whites, African Americans, and Hispanics/Latinos were used for Asians. We then compared the numbers from each scenario to the main model.
Results
Demographic Changes From 2011 to 2050
The following summarizes demographic changes from current to future projected numbers of persons with POAG in the United States from 2011 to 2050.
Current Estimates of Persons With Primary Open-Angle Glaucoma in the United States
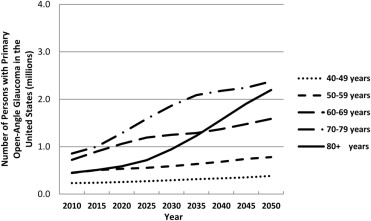
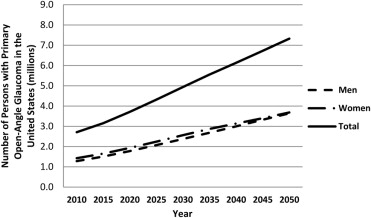
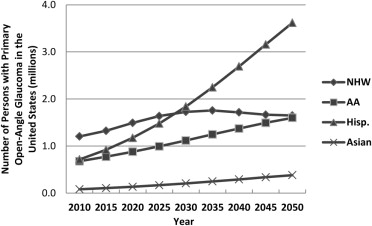
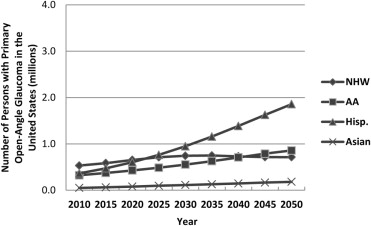
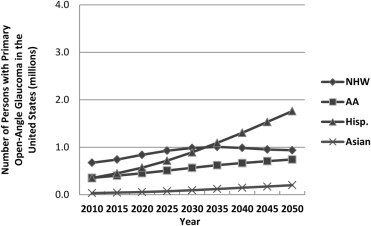
In 2011, 2.71 million persons in the United States have POAG. The largest number of persons with POAG is among those aged 70 to 79 (31%), followed by those aged 60 to 69 (27%), aged 50 to 59 (17%), aged 80 and older (17%), and aged 40 to 49 (8%) ( Table 2 and Figures 1-3 ). Women with POAG outnumber men with POAG by 11% ( Table 3 , Figure 4 ). In terms of race/ethnicity, non-Hispanic whites (44% of all persons with POAG) constitute the largest number of persons with POAG in the United States ( Table 3 , Figures 5-7 ). Overall, non-Hispanic white women make up 25% of the current estimate, and non-Hispanic white women aged 70 years and older make up the single largest demographic group of this current estimate.
| 2011 | 2015 | 2020 | 2025 | 2030 | 2035 | 2040 | 2045 | 2050 | |
|---|---|---|---|---|---|---|---|---|---|
| Age group | |||||||||
| 40–49 years | 0.23 | 0.24 | 0.25 | 0.27 | 0.29 | 0.32 | 0.33 | 0.35 | 0.38 |
| 50–59 years | 0.45 | 0.51 | 0.53 | 0.55 | 0.59 | 0.63 | 0.68 | 0.74 | 0.78 |
| 60–69 years | 0.72 | 0.90 | 1.06 | 1.19 | 1.25 | 1.29 | 1.37 | 1.48 | 1.59 |
| 70–79 years | 0.85 | 1.00 | 1.28 | 1.59 | 1.86 | 2.09 | 2.18 | 2.24 | 2.38 |
| 80+ years | 0.45 | 0.51 | 0.59 | 0.71 | 0.95 | 1.23 | 1.57 | 1.91 | 2.20 |
| Total | 2.71 | 3.15 | 3.72 | 4.32 | 4.94 | 5.56 | 6.13 | 6.72 | 7.32 |
| Women/men | 1.11 | 1.10 | 1.09 | 1.08 | 1.08 | 1.07 | 1.05 | 1.02 | 1.01 |
| 2011 | 2015 | 2020 | 2025 | 2030 | 2035 | 2040 | 2045 | 2050 | |
|---|---|---|---|---|---|---|---|---|---|
| Non-Hispanic white | |||||||||
| Women | 0.67 | 0.74 | 0.84 | 0.93 | 0.98 | 1.01 | 0.98 | 0.95 | 0.94 |
| Men | 0.53 | 0.58 | 0.65 | 0.71 | 0.74 | 0.75 | 0.73 | 0.71 | 0.71 |
| Total | 1.20 | 1.32 | 1.49 | 1.64 | 1.73 | 1.76 | 1.72 | 1.67 | 1.65 |
| African American | |||||||||
| Women | 0.35 | 0.40 | 0.45 | 0.51 | 0.57 | 0.62 | 0.67 | 0.71 | 0.74 |
| Men | 0.32 | 0.37 | 0.43 | 0.49 | 0.55 | 0.63 | 0.71 | 0.79 | 0.86 |
| Total | 0.68 | 0.77 | 0.88 | 0.99 | 1.12 | 1.25 | 1.37 | 1.49 | 1.60 |
| Hispanic/Latino | |||||||||
| Women | 0.35 | 0.45 | 0.57 | 0.72 | 0.89 | 1.09 | 1.30 | 1.53 | 1.76 |
| Men | 0.36 | 0.47 | 0.60 | 0.76 | 0.95 | 1.16 | 1.39 | 1.63 | 1.86 |
| Total | 0.72 | 0.92 | 1.17 | 1.48 | 1.84 | 2.25 | 2.69 | 3.16 | 3.62 |
| Asian | |||||||||
| Women | 0.03 | 0.04 | 0.06 | 0.07 | 0.09 | 0.12 | 0.15 | 0.17 | 0.20 |
| Men | 0.05 | 0.06 | 0.08 | 0.10 | 0.11 | 0.13 | 0.15 | 0.17 | 0.18 |
| Total | 0.08 | 0.11 | 0.13 | 0.17 | 0.21 | 0.25 | 0.29 | 0.34 | 0.38 |
| Other minorities | |||||||||
| Women | 0.02 | 0.02 | 0.02 | 0.02 | 0.03 | 0.03 | 0.04 | 0.04 | 0.04 |
| Men | 0.01 | 0.01 | 0.01 | 0.02 | 0.02 | 0.02 | 0.02 | 0.03 | 0.03 |
| Total | 0.03 | 0.03 | 0.04 | 0.04 | 0.05 | 0.06 | 0.06 | 0.07 | 0.07 |
Projected Estimates of Persons with Primary Open-Angle Glaucoma in the United States from 2011 to 2050
In 2050, an estimated 7.32 million persons are projected to have POAG (an increase of 270% from current estimates, whereas the overall US population will increase only 150% from its current estimate). A higher proportion of the number of persons with POAG will be those aged 70 to 79 (32%), followed by persons aged 80 years and older (30%), 60 to 69 years (22%), 50 to 59 years (11%), and 40 to 49 years (5%) ( Table 2 , Figures 1-3 ). Women will outnumber men by a smaller proportion (1%) than currently (11%) ( Table 3 , Figure 4 ). By 2035, the single largest demographic group will consist of Hispanic/Latino men aged 70 years and older. Finally, in 2050, Hispanics/Latinos will make up 50% of the projected number and constitute the largest group of persons with POAG compared to non-Hispanic whites (currently the largest proportion); and Hispanic/Latino men will outnumber non-Hispanic white women (currently, women outnumber men) ( Table 3 , Figures 5-7 ).
Geographic Distributions From 2011 to 2050
The following summarizes geographic changes from current to future projected numbers of persons with POAG distribution in the United States from 2011 to 2050.
Current Geographic Distribution
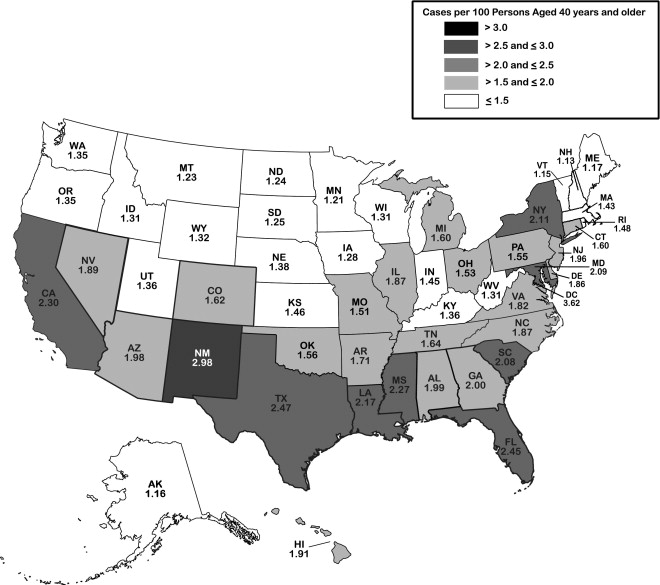
Currently by state, California, Texas, and Florida have the highest estimated numbers of persons with POAG (0.36 million, 0.24 million, and 0.23 million, respectively). By state, the 3 with the highest per capita burden of POAG are New Mexico, Texas, and Florida (2.98%, 2.47%, and 2.45%, respectively, Figure 8 A). By region, the majority (40%) of all persons with POAG in the United States will be located in the Southern region, followed by 22% in the West, 17% in the Midwest, and 17% in the Northeast regions ( Table 4 ). Furthermore, the highest per capita burden of POAG by region is in the South (2.10%), followed by the West (1.99%), Northeast (1.77%), and Midwest (1.53%). By sex, women outnumber men in every region. By race/ethnicity, the highest estimated numbers are among non-Hispanic whites in all regions except the West, where Hispanics/Latinos are the major contributor ( Table 4 ). Specifically, non-Hispanic white women are the major contributors in every region except the West, where the major contributors are Hispanic/Latino men.
| Northeast | Midwest | South | West | |||||
|---|---|---|---|---|---|---|---|---|
| Women | Men | Women | Men | Women | Men | Women | Men | |
| In 2011 | ||||||||
| Non-Hispanic white | 136.7 | 102.3 | 168.0 | 130.0 | 237.0 | 183.7 | 125.3 | 102.5 |
| African American | 59.4 | 52.0 | 59.9 | 55.0 | 188.2 | 171.4 | 27.7 | 28.9 |
| Asian American | 5.7 | 9.8 | 2.8 | 4.6 | 5.4 | 9.0 | 20.6 | 23.7 |
| Hispanic | 53.9 | 51.2 | 22.4 | 27.3 | 129.3 | 134.3 | 130.0 | 140.1 |
| Other minorities | 0.7 | 0.4 | 1.4 | 0.9 | 3.1 | 2.1 | 4.9 | 3.2 |
| Total | 256.3 | 215.6 | 254.4 | 217.8 | 563.0 | 500.5 | 308.5 | 298.3 |
| Region total | 471.9 | 472.2 | 1063.5 | 606.8 | ||||
| In 2050 | ||||||||
| Non-Hispanic white | 192.6 | 137.3 | 235.0 | 172.7 | 329.7 | 246.8 | 173.4 | 136.8 |
| African American | 127.1 | 142.2 | 126.6 | 151.3 | 393.1 | 458.6 | 58.0 | 77.0 |
| Asian American | 34.7 | 35.4 | 16.6 | 16.3 | 32.2 | 32.4 | 135.3 | 91.2 |
| Hispanic | 273.2 | 260.3 | 110.1 | 135.4 | 673.2 | 712.2 | 657.2 | 714.9 |
| Other minorities | 2.0 | 1.3 | 3.9 | 2.6 | 8.9 | 6.1 | 13.7 | 9.1 |
| Total | 629.6 | 576.4 | 492.3 | 478.4 | 1437.1 | 1456.2 | 1037.6 | 1029.0 |
| Region total | 1206.0 | 970.7 | 2893.3 | 2066.5 | ||||
Stay updated, free articles. Join our Telegram channel

Full access? Get Clinical Tree


