Purpose
To estimate the incidence of age-related macular degeneration (AMD) and the association of smoking and alcohol in a population of older women.
Design
Prospective cohort study.
Methods
Subjects were women who attended the Study of Osteoporotic Fractures year-10 and year-15 follow-up clinic visits and had fundus photographs taken at both visits (n = 1958; 245 Black and 1713 White subjects; mean age at year 10 visit, 78.2 years). Forty-five degree stereoscopic fundus photographs were graded for AMD. Logistic regression was used to test whether risk factors were associated with incident AMD.
Results
The overall 5-year AMD incidence was 24.1% (95% confidence interval [CI], 21.7 to 26.6) for early and 5.7% (95% CI, 4.6 to 6.8) for late. Early AMD incidence in White subjects ranged from 21.9% in those aged 74 to 79 years to 33.2% in those 80 to 84 years, but was observed at the slightly lower rate of 29.0% in subjects ≥85 years (trend P < .0001). After confounder adjustment, alcohol consumption was significantly associated with an elevated risk of incident early AMD (odds ratio [OR], 1.57; 95% CI, 1.18 to 2.11). There was an increased risk of early AMD among subjects aged 80 years or older who were smoking compared to those younger than 80 years who were not smoking (OR, 5.49; 95% CI, 1.57 to 19.20; P for interaction = .026).
Conclusions
The magnitude of the greater-than-additive effect of smoking on the age-adjusted risk of AMD reinforces recommendations to quit smoking even for older individuals.
Age-related macular degeneration (AMD) is the leading cause of blindness in persons 65 years of age and older in the developed world. Age is the strongest risk factor for AMD; however, most of the populations providing incidence and prevalence data have included relatively few subjects over the age of 75 years. For example, all of the population-based studies conducted in the United States, including the Beaver Dam Eye Study and the Baltimore Eye Survey, have included fewer than 1000 subjects aged 75 years or older. Furthermore, although previous research suggests that AMD is less common in Blacks than people of European descent, there remains a paucity of studies that provide data on incidence of AMD in Blacks.
Second to age, smoking is the most consistently identified risk factor for AMD. Although multiple studies have examined the relationship of AMD to smoking and other factors, we are not aware of any previous study that has assessed interactions between smoking and age in relation to AMD.
Findings regarding the association of alcohol consumption with AMD have been inconsistent. Alcohol has been hypothesized to have both positive and negative effects on the development of AMD, with some studies showing increased AMD risk, particularly associated with heavy drinking or beer consumption, whereas others showed a lower risk associated with wine consumption.
Utilizing data from the Study of Osteoporotic Fractures, the goal of the present study was to estimate the incidence of early and late AMD in older White and Black subjects, as well as to determine the association of alcohol use and smoking status with the incidence of AMD. In addition, this study sought to determine whether the effects of alcohol use or smoking may be modified by age.
Methods
Subjects
In 1986 to 1988 a cohort of 9704 White women aged 65 years or older were enrolled in the Study of Osteoporotic Fractures (SOF), a multicenter prospective cohort study originally designed to identify risk factors for osteoporotic fractures. Details of the study design have been previously published. Subjects were recruited from 4 geographic areas in the United States using community-based listings such as health plan membership lists, Department of Motor Vehicles tapes, and voter registration lists. The SOF cohort was originally focused on detecting health effects in a cohort of White women, but at the year-10 visit in 1997 to 1998, the cohort was enhanced by the enrollment of 662 Black women at the four centers using the same recruitment methods and inclusion/exclusion criteria as for the original cohort.
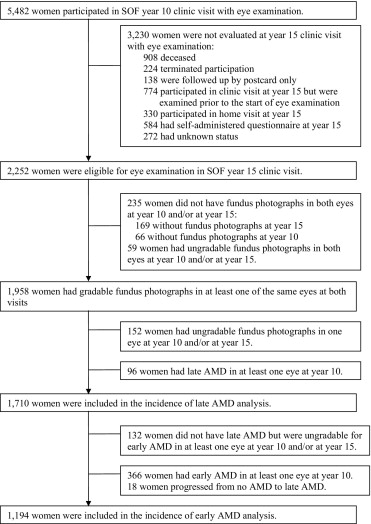
Subjects were eligible for the present study if they attended the year-10 and year-15 follow-up clinic visits in 1997 to 1998 and 2002 to 2004, respectively, and had fundus photographs in both eyes at both visits. Subject selection and reasons for noneligibility for the present study can be seen in Figure 1 . Of the 5,482 women attending the year-10 clinic visit, 3230 (58.9%) were not evaluated for the year-15 clinic visit with an eye examination. Of the remaining 2252 who were eligible for the present study, 294 (13%) did not have fundus photographs or had ungradable fundus photographs in both eyes at year-10 and/or year-15 visit. A comparison of baseline characteristics between participants and eligible nonparticipants can be found in Table 1 . Participants were younger ( P = .0002), more likely to walk for exercise ( P = .005), and more likely to have consumed alcohol in the previous 30 days ( P = .010) than nonparticipants.
| Characteristics | Participants a (n = 1958) | Nonparticipants b (n = 294) | P value c |
|---|---|---|---|
| Study site | |||
| Baltimore, Maryland | 322 (16%) | 53 (18%) | .18 |
| Minneapolis, Minnesota | 661 (34%) | 94 (32%) | |
| Pittsburgh, Pennsylvania | 508 (26%) | 90 (31%) | |
| Portland, Oregon | 467 (24%) | 57 (19%) | |
| Age (years) | |||
| Mean ± SD | 78.2 ± 3.7 | 79.3 ± 4.0 | |
| Median | 78.0 | 78.0 | .0002 |
| Race | |||
| White | 1713 (87%) | 262 (89%) | .43 |
| Black | 245 (13%) | 32 (11%) | |
| Education (years) | |||
| Mean ± SD | 12.9 ± 2.7 | 12.8 ± 2.6 | |
| Median | 12.0 | 12.0 | .72 |
| <12 years | 338 (17%) | 52 (18%) | .86 |
| ≥12 years (high school graduate or above) | 1619 (83%) | 242 (82%) | |
| Walking for exercise | |||
| Yes | 895 (46%) | 109 (37%) | .005 |
| No | 1056 (54%) | 184 (63%) | |
| Current smoker | |||
| Yes | 75 (4%) | 10 (3%) | .72 |
| No | 1881 (96%) | 284 (97%) | |
| Any alcohol in last 30 days | |||
| Yes | 942 (48%) | 118 (40%) | .010 |
| No | 1015 (52%) | 176 (60%) | |
| Self-rated health status | |||
| Good/excellent | 1668 (85%) | 244 (83%) | .33 |
| Fair/poor | 290 (15%) | 50 (17%) | |
| History of diabetes | |||
| Yes | 105 (5%) | 8 (3%) | .054 |
| No | 1853 (95%) | 285 (97%) | |
| History of hypertension | |||
| Yes | 706 (36%) | 106 (36%) | >.99 |
| No | 1252 (64%) | 188 (64%) |
a Subjects had gradable fundus photographs in at least 1 of the same eyes at both year-10 and year-15 clinic visits.
b Eligible subjects did not have fundus photographs or had ungradable fundus photographs in both eyes at year-10 and/or at year-15 clinic visits.
c P values are from Wilcoxon rank-sum tests for continuous variables and χ 2 tests for categorical variables.
Of the 1,958 women with gradable fundus photographs, 96 were excluded from the present analyses because of the presence of late AMD in at least 1 eye at the year-10 visit, and 152 were excluded because of ungradable fundus photographs in 1 eye at either visit. Thus, 1,710 subjects were included in the present analysis for incidence of late AMD. Relevant to analyzing incidence of early AMD, there were 366 with known early AMD in at least 1 eye at year-10, 18 progressed from no AMD to late AMD, and 132 were not gradable for early AMD in at least 1 eye at either year-10 or year-15. Thus, 1194 women were included in the analysis for early AMD.
Definition of Incident Age-Related Macular Degeneration
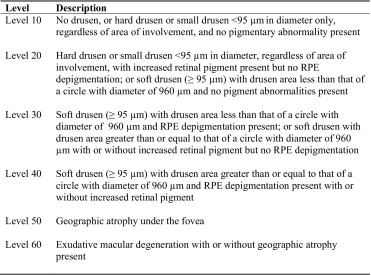
Two 45 degree stereoscopic fundus photographs per eye were taken for each subject, and they were graded for AMD using a modification of the Wisconsin Age-Related Maculopathy Grading System (WARMGS) used in National Health and Nutrition Examination Survey (NHANES) III. Photographs from the year-10 and year-15 visits were double-graded by two independent graders in a masked fashion. AMD characteristics and severity were graded on a six-level severity scale used in the Beaver Dam Eye Study and modified for use with 45 degree stereoscopic photographs ( Figure 2 ). Incident late AMD was defined as the presence of subfoveal geographic atrophy or choroidal neovascularization (level 50 or 60) in at least 1 eye at year-15 when late AMD was not present in either eye at year-10. Incident early AMD was defined as the presence of soft drusen (≥95 μm in diameter) and 1) drusen area < that of a circle with a diameter of 960 μm and retinal pigment epithelial depigmentation present; or 2) drusen area ≥ to that of a circle with diameter 960 μm with or without pigmentary abnormalities (ie, level 30 or 40) in at least 1 eye and without late AMD in either eye at year-15 in subjects with no AMD (level 10 or 20) in either eye at year-10. In cases of a discrepancy in the categorization of an eye as no AMD, early AMD, or late AMD, or in cases where photographs were deemed not gradable by at least one grader, photographs were evaluated by a retina specialist (E.L.T.) whose grading was taken as the final grade.
From July 2003 to January 2004, fundus photographs of 871 subjects were graded independently by both graders. Of those, a stratified quality control sample of 100 subjects was selected (30 subjects from the late AMD, early AMD, and non-AMD groups, respectively, and 10 subjects whose photographs were not gradable or gradable in only 1 eye). To measure internal reliability of the photograph grading, fundus photographs from this sample were mixed with the fundus photographs for regular grading and sent to both graders three additional times. All discrepancies were adjudicated by the retina specialist. The kappas for the status of AMD in subjects increased from 0.81 (baseline grading vs third grading) to 0.91 (second grading vs third grading), where baseline refers to the original grade assigned prior to inclusion in the stratified sample. To measure external reliability, photographs from the same quality control sample were sent for grading by the Wisconsin Reading Center. The kappas were relatively stable and ranged from 0.65 (Wisconsin vs second grading) to 0.75 (Wisconsin vs baseline grading). These kappas are indicative of good to very good agreement, and are consistent with other population-based studies of AMD.
Assessment of Risk Factors
Alcohol consumption was ascertained with the year-10 self-administered questionnaire and was defined as consumption of any alcoholic beverage in the last 30 days (yes/no). Smoking status was ascertained with the year-10 self-administered questionnaire by asking subjects, “Do you currently smoke cigarettes?” (yes/no).
Assessment of Potential Confounders
Potential confounders measured included age at the year-10 clinic visit, clinical site of enrollment, ethnicity, history of hypertension, self-reported diabetes, years of education, self-reported health status, and walking for exercise. Ethnicity was self-reported as either White or Black. History of hypertension, self-reported health status, and walking for exercise were ascertained with the year-10 self-administered questionnaire. For history of hypertension, subjects were asked if they were ever told by a doctor that they had hypertension. For self-reported health status, subjects were asked to rate their overall health, compared to others their own age, as very excellent, excellent, good, fair, poor, or very poor. For the purposes of the present analysis, this variable was dichotomized as excellent/good vs fair/poor. History of diabetes was ascertained with the year-10 self-administered questionnaire by asking subjects, “Has a doctor ever told you that you have diabetes?” Regarding walking for exercise, subjects were asked if they walk for exercise (yes/no), defined as walking one block or more without stopping. Years of education were ascertained with the baseline self-administered questionnaire for white subjects and the year-10 questionnaire for Blacks.
Statistical Analysis
All statistical analyses were performed using SAS version 9.1 statistical software (SAS Institute, Cary, North Carolina, USA). Baseline characteristics and unadjusted incidence rates were compared using χ 2 tests, t tests, or Wilcoxon rank-sum tests when appropriate. Age-adjusted, age- and race-adjusted, and multivariable-adjusted logistic regression models were used to test whether smoking or alcohol consumption were associated with incident early or late AMD. Variables that were significantly associated with each outcome in bivariate analyses at the significance level of 0.25, and/or those associated with AMD in the literature, were entered into the full multivariable model. Clinically relevant variables were retained in the model a priori, and any remaining variables were then removed after assessment of confounding to obtain the final model. The final model included alcohol consumption, current smoking, age, ethnicity, history of hypertension, study recruitment site, and walking for exercise. Interactions between current smoking and alcohol consumption, age and smoking, and age and alcohol consumption were tested by entering cross product terms in the logistic regression model and examining their effects.
To address concerns of selection bias primarily attributable to loss to follow-up, we performed analyses using attrition weights among year-10 participants to assess the potential impact of attrition bias on the observed results. This method is based on the assumption that subjects with certain profiles of characteristics are more likely to be included in the analysis than others. A logistic regression model is developed to predict the likelihood of a subject being included in the analysis conditional on a set of observed covariates. Attrition weights for each subject are calculated by taking the inverse of the predicted probability. They are then applied as sampling weights for each subject who was included in the analyses. From the target population of those attending the year-10 clinic visit, we calculated attrition weights from the predicted likelihood of having gradable photos at both year-10 and year-15, conditional on covariates including age at year-10, study recruitment site, education, self-rated health status, alcohol consumption, smoking, body mass index, walking for exercise, walking speed, average grip strength, use of arms to stand up, hours spent with feet up, functional disability, number of chronic diseases at year-10, presence of breast cancer, history of falls, history of any fractures, depression, cognitive status, and current use of certain medications, including anticonvulsant drugs, long-acting benzodiazepines, hypotensive and/or vasodilating agents, beta- and alpha-blockers, anxiolytics, and diuretics-thiazide. The attrition weights were calculated separately for Whites and Blacks.
Results
Both unweighted and attrition weight–adjusted analyses were performed, and the results were similar from both analyses. Except for the descriptive tables, in which both results are presented, only weighted results are presented. Of 1194 subjects with no AMD at year-10 who were gradable for early AMD in both eyes at year-15, there were 286 (24.0%) with incident early AMD. The 5-year incidence of early AMD was 24.1% (95% confidence interval [CI], 21.7 to 26.6). Of 1710 subjects with no AMD or early AMD at year-10 who were gradable for late AMD in both eyes at year-15, there were 94 (5.5%) who developed incident late AMD. The 5-year incidence of late AMD was 5.7% (95% CI, 4.6 to 6.8). Incidence of early and late AMD by age and ethnicity is found in Tables 2 and 3 . Overall, incidence of early AMD was higher for Whites compared to Blacks (25.1% vs 16.7%; P = .022), as was incidence of late AMD (6.2% vs 0.9%; P = .002). Only 2 of the 217 Black women at risk had incident late AMD; these women were 71 and 73 years old, respectively. White participants (median age, 78 years; range, 74 to 92 years) as a group were older than Black participants (median age, 73 years; range, 65 to 94 years). Given that the youngest White participant was 74 years old, age-specific incidence was compared between Whites and Blacks for subjects aged 74 years and older by expanding the 75 to 79 years age category in Blacks to include subjects aged 74 years. Incidence of early AMD in Blacks aged 74 to 79 was 20.0%. Age-specific incidence was higher for Whites than Blacks for both outcomes, with the exception of early AMD in subjects aged 85 and older; however, there were just 2 Blacks at risk in this age category, preventing reliable inferences.
| Age Group | Number of Women at Risk | Incidence n (%) | 95% CI of Incidence | Weighted Incidence a (95% CI) |
|---|---|---|---|---|
| Early AMD | ||||
| Age (years) | ||||
| 74 to 79 b | 724 | 158 (21.8%) | 18.9 to 25.0 | 21.9 (18.8 to 25.0) |
| 80 to 84 | 271 | 90 (33.2%) | 27.6 to 39.2 | 33.2 (27.6 to 38.7) |
| 85+ | 38 | 11 (28.9%) | 15.4 to 45.9 | 29.0 (14.8 to 43.1) |
| Total | 1033 | 259 (25.1%) | 22.5 to 27.8 | 25.3 (22.6 to 28.0) |
| Trend P value c | .0007 | .0009 | ||
| Late AMD | ||||
| Age (years) | ||||
| 74 to 79 b | 991 | 41 (4.1%) | 3.0 to 5.6 | 4.3 (3.0 to 5.6) |
| 80 to 84 | 426 | 40 (9.4%) | 6.8 to 12.6 | 9.4 (6.7 to 12.2) |
| 85+ | 76 | 11 (14.5%) | 7.5 to 24.4 | 14.5 (6.7 to 22.3) |
| Total | 1493 | 92 (6.2%) | 5.0 to 7.5 | 6.4 (5.1 to 7.6) |
| Trend P value c | <.0001 | <.0001 |
a Estimates were weighted by attrition weights.
b Includes 14 subjects at risk for incident early AMD who were 74 years old, 4 (28.6%) of whom had incident early AMD, and 22 subjects at risk for incident late AMD who were 74 years old, 1 (4.5%) of whom had incident late AMD.
| Age Group | Number of Women at Risk | Incidence N (%) | 95% CI of Incidence | Weighted Incidence b (95% CI) |
|---|---|---|---|---|
| Early AMD | ||||
| Age (years) | ||||
| 65 to 69 | 15 | 3 (20.0%) | 4.3 to 48.1 | 17.9 (0.0 to 38.8) |
| 70 to 74 | 90 | 15 (16.7%) | 9.6 to 26.0 | 17.4 (9.5 to 25.4) |
| 75 to 79 | 38 | 6 (15.8%) | 6.0 to 31.3 | 15.7 (4.1 to 27.3) |
| 80 to 84 | 16 | 1 (6.3%) | 0.2 to 30.2 | 6.4 (0.0 to 18.3) |
| 85+ | 2 | 2 (100%) | 47.8 to 100 | 100 |
| Total | 161 | 27 (16.7%) | 11.4 to 23.5 | 17.0 (11.1 to 22.9) |
| Trend P value c | .85 | .79 |
a Only 2 of the 217 Blacks at risk (0.9%) had incident late AMD; subjects were 71 and 73 years old, respectively. Estimates for incident late AMD and age-stratified incident early AMD might be imprecise and should be interpreted with caution because of the small sample size of Blacks.
b Estimates were weighted by attrition weights. Confidence interval was not available for the age group of 85+ years when attrition weights were used.
In Whites, incidence of early AMD ranged from 21.9% (95% CI, 18.8 to 25.0) in those aged 74 to 79 years to 33.2% (95% CI, 27.6 to 38.7) in those 80 to 84 years, with a lower incidence rate of 29.0% (95% CI, 14.8 to 43.1) in subjects 85 years of age and older (trend P < .0001). In contrast, incidence of early AMD in Blacks was estimated to range from 17.9% (95% CI, 0.0 to 38.8) in those 65 to 69 years of age to 6.4% (95% CI, 0.0 to 18.3) in those 80 to 84 years of age (trend P = .79); given the relatively few Blacks at risk in the 65 to 69 and 80 to 84 years age groups, results in these groups should be interpreted with caution. Incidence of late AMD in Whites ranged from 4.3% (95% CI, 3.0 to 5.6) in subjects aged 74 to 79 years to 14.5% (95% CI, 6.7 to 22.3) in those aged 85 years and older (trend P < .0001).
Early and late AMD incidences by baseline characteristics are shown in Table 4 . Increasing age and White race were associated with incidence of both early AMD ( P < .0001 and P = .022, respectively) and late AMD ( P < .0001 and P = .002, respectively). In addition, any alcohol consumption in the previous 30 days ( P = .0002) was associated with incidence of early AMD ( Table 4 ).
| Characteristics | No AMD at Both Visits a | Incident Early AMD | P value b | No or Early AMD at Both Visits | Incident Late AMD | P value b |
|---|---|---|---|---|---|---|
| Total | 908 | 286 | 1616 | 94 | ||
| Study Site | ||||||
| Baltimore, Maryland | 156 (78%) | 43 (22%) | .13 | 259 (94%) | 16 (6%) | .45 |
| Minneapolis, Minnesota | 307 (73%) | 116 (27%) | 555 (96%) | 25 (4%) | ||
| Pittsburgh, Pennsylvania | 239 (80%) | 61 (20%) | 419 (94%) | 26 (6%) | ||
| Portland, Oregon | 206 (76%) | 66 (24%) | 383 (93%) | 27 (7%) | ||
| Age (years) | ||||||
| Mean ± SD | 77.4 ± 3.4 | 78.6 ± 3.4 | 77.9 ± 3.6 | 80.0 ± 3.5 | ||
| Median | 77.0 | 78.0 | <.0001 | 77.0 | 80 | <.0001 |
| Race | ||||||
| White | 774 (75%) | 259 (25%) | .022 | 1401 (94%) | 92 (6%) | .002 |
| Black | 134 (83%) | 27 (17%) | 215 (99%) | 2 (1%) | ||
| Education (years) | ||||||
| <12 years | 155 (78%) | 43 (22%) | .43 | 279 (94%) | 17 (6%) | .84 |
| ≥12 years (high school graduate or above) | 753 (76%) | 242 (24%) | 1336 (95%) | 77 (5%) | ||
| Walking for exercise | ||||||
| Yes | 399 (74%) | 142 (26%) | .09 | 734 (95%) | 40 (5%) | .57 |
| No | 505 (78%) | 143 (22%) | 876 (94%) | 54 (6%) | ||
| Current smoker | ||||||
| Yes | 32 (76%) | 10 (24%) | .98 | 62 (95%) | 3 (5%) | .75 |
| No | 874 (76%) | 276 (24%) | 1552 (94%) | 91 (6%) | ||
| Any alcohol in last 30 days | ||||||
| Yes | 422 (72%) | 168 (28%) | .0002 | 787 (95%) | 42 (5%) | .45 |
| No | 486 (81%) | 117 (19%) | 828 (94%) | 52 (6%) | ||
| Self-rated health status | ||||||
| Good/excellent | 769 (76%) | 239 (24%) | .65 | 1380 (94%) | 83 (6%) | .44 |
| Fair/poor | 139 (75%) | 47 (25%) | 236 (96%) | 11 (4%) | ||
| History of diabetes | ||||||
| Yes | 59 (84%) | 11 (16%) | .10 | 88 (96%) | 4 (4%) | .62 |
| No | 849 (76%) | 275 (24%) | 1528 (94%) | 90 (6%) | ||
| History of hypertension | ||||||
| Yes | 309 (74%) | 111 (26%) | .14 | 584 (95%) | 33 (5%) | .84 |
| No | 599 (77%) | 175 (23%) | 1032 (94%) | 61 (6%) |
Stay updated, free articles. Join our Telegram channel

Full access? Get Clinical Tree


