Purpose
To evaluate the integrity of the photoreceptor inner segment/outer segment (IS/OS) junction using spectral-domain optical coherence tomography (SD OCT) in patients with diabetic macular edema and to correlate the relationship between the integrity of the IS/OS junction and visual acuity.
Design
Retrospective, comparative, consecutive case series.
Methods
Sixty-two eyes from 38 patients with diabetic macular edema underwent SD OCT imaging. For each patient, 2 experienced observers masked to visual acuity measured several SD OCT variables, including central macular thickness, retinal volume, global disruption scale of outer retina, percentage disruption of the outer retina, and history of previous treatments. Visual acuity recorded as number of Early Treatment Diabetic Retinopathy Study letters was used as the outcome variable in univariate and multivariate analysis testing the measured SD OCT variables as predictors.
Results
A statistically significant correlation between percentage disruption of the IS/OS junction and visual acuity was found ( P = .0312). Additionally, there was a strong trend suggesting a relationship between macular volume and visual acuity, although borderline significance was found ( P = .07).
Conclusions
Disruption of the photoreceptor IS/OS junction is an important predictor of visual acuity among diabetic macular edema patients.
Diabetic macular edema (DME) is a major cause of vision loss in patients with both insulin-dependent and non–insulin-dependent diabetes mellitus. It long has been accepted that macular edema can develop at all stages of retinopathy. Classically, patients have a gradual onset of blurry vision, and in more advanced cases, the macula becomes thickened and even cystic with profound visual loss. Because of the various clinical presentations of DME, specialized techniques such as spectral-domain optical coherence tomography (SD OCT) have become an important tool and an integral part of the diagnosis and management of this condition.
With the improved visualization of retinal architecture offered by OCT, many clinical studies have used this imaging technique to evaluate the effectiveness of various treatment methods and subsequent resolution of macular edema. Through these studies, authors have found that some eyes with DME have poor visual outcomes despite successful treatment and complete resolution of edema. Moreover, a recent study by the Diabetic Retinopathy Clinical Research Network showed only a modest relationship between measured central retinal thickness and visual acuity in patients with DME. The aforementioned observations imply that visual acuity likely is multifactorial and maybe related to damage or disruption of the retinal architecture or direct photoreceptor damage.
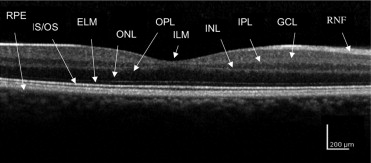
The retinal photoreceptor layer can be evaluated accurately using SD OCT by examining the integrity of the photoreceptor inner segment/outer segment (IS/OS) junction. Disruption of this hyperreflective line just above the retinal pigment epithelium reveals damage to the macular photoreceptors, and several recent studies highlight the value of IS/OS junction integrity in retinal diseases including retinitis pigmentosa, central serous chorioretinopathy, acute zonal occult outer retinopathy, branch retinal vein occlusion, and macular hole treated with vitrectomy. In each of these diverse retinal pathologic conditions, disturbance of the photoreceptors correlated with poor visual acuity or outcome.
Limited information is available regarding the association between the foveal IS/OS junction line and visual function in DME. One recent study retrospectively reviewed the relationship between the IS/OS junction layer on Stratus OCT (Carl Zeiss Meditec, Dublin, California, USA) after the resolution of DME after pars plana vitrectomy. This study reported that photoreceptor integrity is closely related to final visual acuity. However, the study did not have the advantage of SD OCT and was limited specifically to patients who underwent pars plana vitrectomy for DME. In fact, the authors state that a study using SD OCT, with its ability to average multiple scans and reduce noise, would be beneficial to determine the relationship of photoreceptor status in the case of macular edema and visual outcome.
In this study, we examined the relationship between visual acuity and the integrity of the foveal photoreceptor layer in eyes with both previously treated and treatment-naïve DME by evaluating the IS/OS junction. We believe that, similar to other macular pathologic features, photoreceptor integrity is an important predictor of visual acuity in DME patients.
Methods
Records of patients with DME who underwent SD OCT scanning were reviewed retrospectively. Only patients with evidence of edema clinically, FA leakage, or OCT thickening from DME were included in the study. Patients with macular edema from other causes, including any history of uveitis, retinal detachment, recurrent ERMs, or vitreomacular traction, were excluded. Additionally, patients with concurrent macular diseases such as macular degeneration or patients with significant cataracts, graded at more than N03 or NC3 according to the Lens Opacity Classification Scheme, were excluded.
In total, 62 eyes with DME from 38 patients were identified for study evaluation. From the medical records of these patients, best-corrected visual acuity, using standardized calibrated Early Treatment Diabetic Retinopathy Study (ETDRS) methodology, was recorded closest to the date of the SD OCT scan. In addition, information about patient age, gender, involved eye, insulin dependency, and any prior treatments for DME were recorded. Prior treatments included PRP, focal laser, pars plana vitrectomy, triamcinolone injections, or bevacizumab injections. The status of the lens, including lens grade if phakic or evidence of a posterior capsular opacity if pseudophakic, also was noted.
Imaging
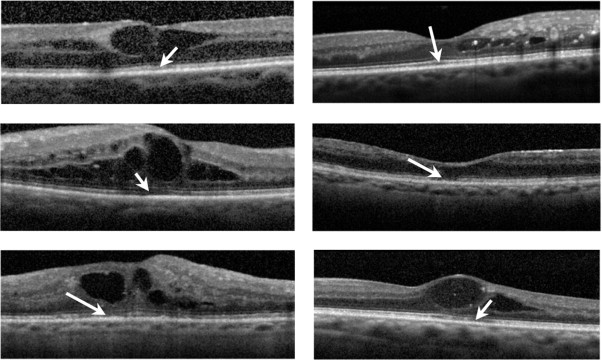
Diabetic macular edema was evaluated with scanning laser SD OCT using either an OPKO-OTI (OTI Inc, Toronto, Ontario, Canada) or a Heidelberg Spectralis (Heidelberg Engineering, Vista, California, USA). For each patient, horizontal and vertical SD OCT images through the fovea were obtained for evaluation. Two experienced observers (S.F.O., F.M.) masked to visual acuities measured several variables. First, foveal thickness was calculated by using the calipers feature on the SD OCT instrument with manual correction as needed. An average thickness value was obtained after reviewing both scans. Next, the photoreceptor IS/OS layer was evaluated 500 μm in either direction of the fovea. The IS/OS junction disruption was graded from 0 to 2. Grade 0 was given when an intact IS/OS layer was found, grade 1 was assigned for focal disruption of the IS/OS junction of 200 μm or less, and grade 2 was assigned for more than 200 μm of disruption. Grades from each patient’s horizontal and vertical scan were added to yield a global disruption scale. For example, a global disruption scale of 0 corresponded to no disruption in either scan, whereas a scale of 4 resulted from grade 2 disruption horizontally and vertically. Last, the percentage of disruption along the IS/OS layer, again measured 500 μm in either direction from the foveal center, was recorded. The percentage disruption was averaged to generate a number between 0% (no IS/OS disruption) and 100% (total loss of the IS/OS layer in both horizontal and vertical scans; Figures 1 and 2 ) .
Statistical Analysis
Visual acuity recorded as the number of ETDRS letters was used as the outcome variable in univariate and multivariate analysis, whereas tested predictors included central macular thickness, retinal volume, global disruption scale of outer retina, percentage disruption of the outer retina, and history of previous treatments. In this study, most participating patients had both eyes in the study; therefore, the generalized estimating equation was used to handle the intrapatient correlation between the 2 eyes. All statistical analysis was performed using SAS software version 9.2 (SAS Institute, Cary, North Carolina, USA).
Stay updated, free articles. Join our Telegram channel

Full access? Get Clinical Tree


