Purpose
To evaluate relationships between tear meniscus dimensions and parameters of ocular surface disease in a variety of tear dysfunction conditions.
Design
Single-institution prospective observational study.
Methods
This study from the Baylor College of Medicine included 128 eyes of 64 subjects. Cross-sectional lower tear meniscus height and tear meniscus area were measured using optical coherence tomography and were compared with tear break-up time (TBUT), corneal staining, conjunctival staining, and an irritation symptom questionnaire (Ocular Surface Disease Index). Study groups included meibomian gland disease (MGD), aqueous tear deficiency (ATD), Sjögren syndrome, non–Sjögren syndrome ATD, and control subjects. Statistical analyses were performed using the Pearson correlation and Student’s t test.
Results
When compared with mean tear meniscus height in controls (345 μm), mean tear meniscus height was lower in all tear dysfunction (234 μm; P = .0057), ATD (210 μm; P = .0016), and Sjögren syndrome groups (171 μm; P = .0054). For tear meniscus height ≤210 μm, relative risk ratio for developing corneal staining ≥10 was 4.65. Tear meniscus height correlated with corneal staining for all subjects ( R = −0.32; P = .0008), MGD ( R = +0.40; P = .059), and ATD ( R = −0.36; P = .04). Tear meniscus area showed similar trends in MGD ( R = +0.55; P = .006) and ATD ( R = −0.40; P = .018). Tear meniscus height correlated with TBUT for all subjects ( R = +0.39; P < .0001) and ATD ( R = +0.37; P = .018).
Conclusions
In tear dysfunction conditions, lower tear volume correlates with worse corneal epithelial disease in ATD and Sjögren syndrome, conditions with lacrimal gland dysfunction. In contrast, higher tear volume is associated with corneal epithelial disease in MGD. These findings may improve the ability to identify patients at risk for corneal epithelial disease.
The integrated lacrimal functional unit regulates tear production and clearance to maintain an adequate tear volume of appropriate composition to support and protect the ocular surface. Disease or dysfunction of components of the lacrimal functional unit results in deficiency and compositional changes in tears. Lacrimal gland disease causes aqueous tear deficiency, while meibomian gland disease results in lipid tear deficiency and increased tear evaporation.
Diagnosis of aqueous tear deficiency has traditionally relied on the Schirmer test, which may induce reflex tearing. Meibomian gland disease is generally diagnosed by presence of clinical signs. Interferometry can be used to image the lipid tear layer. Lipid tear deficiency has been found to increase tear evaporation ; however, measurement of tear evaporation rate is not a routine clinical test.
Optical coherence tomography (OCT) is an objective, noninvasive technology that has been used to indirectly measure tear volume by measuring tear meniscus parameters. Previous studies have used OCT to compare tear volume to clinical ocular surface disease parameters and suggested that OCT has the potential to distinguish subgroups of dry eye.
The objective of this study was to compare tear meniscus height and area measured by OCT in a variety of tear dysfunction conditions, including meibomian gland disease, aqueous tear deficiency, and Sjögren syndrome, and examine correlations between tear meniscus and clinical parameters, with the goal of more accurately stratifying and classifying tear dysfunction for clinical trials and therapeutic decision making.
Methods
This study protocol to prospectively evaluate the utility of the FDA-approved anterior segment OCT device to measure tear meniscus dimensions for diagnostic classification and severity grading of tear dysfunction conditions was approved by the Baylor College of Medicine Institutional Review Board (IRB). It adheres to the tenets of the Declaration of Helsinki for clinical research and complies with the Health Insurance Portability and Accountability Act, and written informed consent was obtained from all participants after explanation of the purpose and possible consequences of the study. This single-institution prospective observational study began on November 1, 2011 and lasted for 17 months.
Subjects
One hundred twenty-eight eyes from 64 subjects were included in this prospective observational study. Tear dysfunction was stratified into the following groups: meibomian gland disease (MGD), aqueous tear deficiency (ATD), and Sjögren syndrome ATD, both primary and secondary forms. The American College of Rheumatology Classification Criteria were used for diagnosis of Sjögren syndrome. Normal subjects with no symptoms of dry eye or tear deficiency were also evaluated.
Dry Eye Questionnaire
On entry to the study, each subject completed an Ocular Surface Disease Index (OSDI) questionnaire that contains 12 questions that evaluate the character and severity of dry eye symptoms, including vision-related function, ocular symptoms, and environmental triggers. The subject was asked to score the frequency of symptoms from none to all the time . The questionnaire scores ranged from 12 (no symptoms) to a maximum of 60.
Ocular Surface Clinical Parameters
Table 1 displays the inclusion and exclusion criteria for each group. The ocular surface clinical parameters were all measured by the same observer (S.C.P.). Parameters included tear break-up time (TBUT), corneal fluorescein staining, conjunctival lissamine green staining, and Schirmer I test. TBUT was measured by instilling fluorescein into the lower fornix with a wetted fluorescein strip (BioGlo; HUB, Rancho Cucamonga, California, USA). The patient was allowed to blink at a spontaneous rate, and the time elapsed from the last blink to the appearance of the first break in the continuous layer of fluorescein, as observed under cobalt blue light, was recorded to be the TBUT. Corneal fluorescein staining was graded 0-6 in each of 5 zones (central, temporal, nasal, superior, and inferior), as reported in Rao and associates. Conjunctival lissamine green staining was graded on a scale of 0-3 exposed in the nasal and temporal bulbar conjunctiva with a total maximum score of 6. Schirmer I test without anesthesia was used to measure tear production, by inserting a dry Schirmer test strip over the outer third of the lower eyelid margin. The distance that the tears traveled along the test strip at 5 minutes was recorded as the Schirmer I score.
| Groups | OSDI | TBUT ≤7 Sec | Schirmer <10 mm | MGD a |
|---|---|---|---|---|
| All tear dysfunction | >20 | + | ||
| MGD | >20 | + | − | + |
| ATD | >20 | + | + | − |
| SSATD b | >20 | + | + | − |
| Non-SSATD | >20 | + | + | − |
| Controls | ≤20 | − | − | − |
a Diagnostic criteria are provided in the Methods.
b The American College of Rheumatology Classification Criteria were used for diagnosis of Sjögren syndrome.
Subtypes of Dry Eye
Criteria for classifying normal tear function or subtypes of tear dysfunction are provided in Table 1 . Subjects were excluded if they had prior corneal transplantation surgery, prior surgery of the lacrimal system, a history of contact lens wear, use of topical medications other than preservative-free artificial tears, or chronic use of systemic medications known to reduce tear production. In addition, subjects were excluded if they had active ocular surface or corneal inflammation or infection, eyelid disorders causing exposure of the ocular surface, or clinically significant conjunctivochalasis greater than grade 1 by LIPCOF (lid-parallel conjunctival folds) criteria as defined by Hoh and associates.
Optical Coherence Tomography–Defined Tear Meniscus Parameters
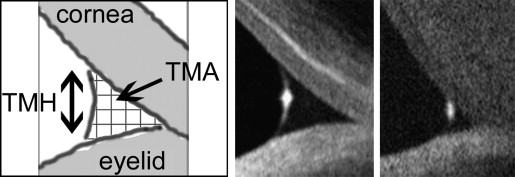
OCT measurement of the lower tear meniscus was performed as described by Gumus and associates. All subjects underwent cross-sectional imaging of the lower tear meniscus prior to instilling drops or measuring any clinical parameters, using the RTVue-100 (Ver. 4.0.7.5; Optovue Inc, Fremont, California, USA) with a corneal adaptor. The system takes 26 000 axial scans per second and has a 5-μm axial resolution and 15-μm transverse resolution. The Cornea-Anterior Module (CAM) software was added to the device for anterior segment imaging. The long-CAM (13 mm, wide field) lens adapter was used to take images. The subject was asked to fixate on a target but was allowed to blink freely throughout the duration of the measurement, and an image of the vertical cross section through the center of the lower tear meniscus was recorded. The scan was repeated if artifact attributable to eye or eyelid movement was noted. Tear meniscus height and tear meniscus area were defined as the height and area of the triangular-shaped cross section between the lower eyelid margin and the cornea, and were measured with RTVue-100 image analysis software ( Figure 1 ).
Statistical Analysis
Tear meniscus dimensions and clinical parameters were recorded in a database. Statistical analysis was performed using GraphPad Prism 5.04 for Windows (GraphPad software, Inc, La Jolla, California, USA) and Microsoft Excel 14.0 for Windows (Microsoft Corporation, Redmond, Washington, USA).
Mean values of tear meniscus dimensions were compared between subtypes using Student’s t test. A value of P ≤ .05 was considered to be statistically significant, and 95% confidence intervals were used. The Pearson correlation coefficient ( R ) was calculated to assess the relationship between tear meniscus dimensions and clinical parameters within the entire tear dysfunction cohort and in each subtype.
Results
Study Population
The demographic information for tear dysfunction and control subjects is presented in Table 2 . When comparing mean age, there was a statistically significant difference between ATD (64.7 years) and controls (51.1 years) ( P = .028), and between non–Sjögren syndrome ATD (65.5 years) and controls (51.1 years) ( P = .036), but not for any other group. There was no significant difference in mean age when each study group was compared to other study groups. There was significant difference in mean age found between controls ≥50 years (65.4 years) and controls <50 years (22.3 years) ( P = 6.64 × 10 −10 ).
| Groups | N (Eyes) | N (Subjects) | Age, Mean (y) | Age Range (y) | Male-to-Female Ratio |
|---|---|---|---|---|---|
| All subjects | 128 | 64 | 56 | 19-87 | 0.37 |
| All tear dysfunction | 68 | 34 | 60 | 25-87 | 0.13 |
| MGD | 23 | 13 | 57 | 25-85 | 0.18 |
| ATD | 41 | 21 | 65 | 31-87 | 0.14 |
| SSATD | 17 | 9 | 64 | 31-76 | 0.29 |
| Non-SSATD | 16 | 10 | 65 | 49-87 | 0.10 |
| All controls | 33 | 20 | 51 | 19-82 | 2.17 |
| Controls ≥50 years | 17 | 12 | 65 | 50-82 | 1.40 |
| Controls <50 years | 16 | 8 | 22 | 19-27 | 3.00 |
Summary of Tear Dysfunction Parameters for Each Group
For each group, the mean and standard deviation values for clinical parameters of tear dysfunction and for OCT-defined tear meniscus parameters are summarized in Table 3 .
| Groups | OSDI | Corneal Staining | Conjunctival Staining | Schirmer (mm) | TBUT (s) | TMH (μm) | TMA (μm 2 ) |
|---|---|---|---|---|---|---|---|
| All subjects | |||||||
| Mean (SD) | 27.1 (± 13.1) | 2.7 (± 4.4) | 1.8 (± 2.2) | 14.0 (± 11.0) | 6.6 (± 5.3) | 280.68 (± 147.53) | 0.0395 (± 0.081) |
| All controls | |||||||
| Mean (SD) | 13.7 (± 2.1) | 0.1 (± 0.4) | 0.4 (± 0.4) | 19.3 (± 8.6) | 12.4 (± 4.9) | 347.92 (± 181.1) | 0.0621 (± 0.134) |
| All tear dysfunction | |||||||
| Mean (SD) | 36.0* (± 9.7) | 4.7* (± 5.2) | 2.8* (± 2.5) | 11.7* (± 10.3) | 2.6* (± 1.6) | 234.45* (± 124.02) | 0.0271 (± 0.033) |
| P value | <.01 | <.01 | <.01 | .01 | <.01 | <.01 | .12 |
| MGD a | |||||||
| Mean (SD) | 39.2* (± 11.4) | 0.9* (± 1.2) | 2.2* (± 2.1) | 17.7 (± 11.4) | 3.9* (± 1.2) | 313.42 (± 157.72) | 0.0465 (± 0.044) |
| P value | <.01 | <.01 | <.01 | .63 | <.01 | .43 | .50 |
| All ATD | |||||||
| Mean (SD) | 32.1* (± 8.8) | 6.1* (± 5.4) | 2.7* (± 2.5) | 5.0* (± 2.7) | 2.3* (± 1.4) | 204.78* (± 88.5) | 0.0198 (± 0.0218) |
| P value | <.01 | <.01 | <.01 | <.01 | <.01 | <.01 | .06 |
| SSATD | |||||||
| Mean (SD) | 33.6* (± 10.3) | 8.9* (± 5.4) | 4.6* (± 3.2) | 3.1* (± 2.2) | 1.3* (± 1.0) | 170.35* (± 50.66) | 0.0106* (± 0.0061) |
| P value | <.01 | <.01 | <.01 | <.01 | <.01 | <.01 | .02 |
| Non-SSATD | |||||||
| Mean (SD) | 29.6* (± 7.2) | 2.9* (± 3.2) | 1.8* (± 1.4) | 6.8* (± 2.3) | 3.3* (± 1.4) | 255.38* (± 110.78) | 0.0304 (± 0.0284) |
| P value | <.01 | <.01 | <.01 | <.01 | <.01 | .03 | .17 |
Mean Values Comparison for Optical Coherence Tomography Lower Meniscus Measurements
Each subject was assigned a mean tear meniscus height that was calculated by averaging values for the 2 eyes. If only 1 eye was included, then the value for the 1 eye was used to represent mean tear meniscus height. Then, the mean tear meniscus height values for all subjects were averaged and this mean value was compared between groups. Mean tear meniscus area was calculated in the same fashion ( Figure 2 ).
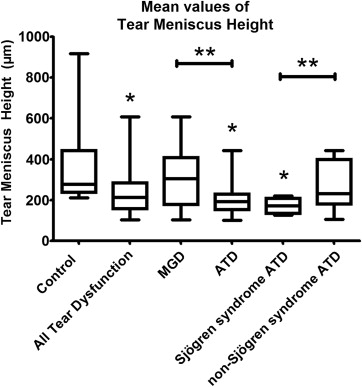
When compared with mean tear meniscus height in controls (345 μm; 95% confidence interval [CI] = 266-423 μm), there was significantly lower mean tear meniscus height for all tear dysfunction (234 μm; CI = 195-273 μm; P = .0057), ATD (210 μm; CI = 172-248 μm; P = .0016), and Sjögren syndrome ATD (171 μm; CI = 143-200 μm; P = .0054). Also, MGD (302 μm; CI = 213-392 μm) had lower mean tear meniscus height values than control ( P = .486), and non–Sjögren syndrome ATD (262 μm; CI = 181-344 μm) had lower mean tear meniscus height than control ( P = .1763), but these values were not significant. There was significant difference between MGD and ATD groups ( P = .0235), and there was significant difference between Sjögren syndrome ATD and non–Sjögren syndrome ATD groups ( P = .0358). There was no statistical difference in tear meniscus height or tear meniscus area when a subgroup of severe Sjögren syndrome ATD (Schirmer <5) was compared to the entire Sjögren syndrome ATD group (Schirmer <10). There was no significant difference when mean tear meniscus height of older controls ≥50 years of age (344 μm; CI = 268-419 μm) was compared to younger controls <50 years of age (346 μm; 150-542 μm) ( P = .976).
Among all subjects, a tear meniscus height ≤210 μm (the mean tear meniscus height for the ATD group) carried a relative risk ratio for developing corneal staining ≥10 of 4.65 and an odds ratio of 5.59.
Optical Coherence Tomography–Defined Tear Meniscus Parameters Correlated With Clinical Signs and Symptoms
Correlation data are presented in Table 4 and Figures 3-5 . Significant correlations were found between corneal staining and tear meniscus height, between corneal staining and tear meniscus area, and between TBUT and tear meniscus height in several study groups (all subjects, all tear dysfunction, MGD, and ATD). However, there was no significant correlation between TBUT and tear meniscus area in any subgroup of tear dysfunction ( Table 4 ). Comparisons between tear meniscus parameters and conjunctival staining or OSDI score were not significant for any group. None of the correlations within the non–Sjögren syndrome ATD group were significant.
| All Subjects | All Tear Dysfunction | MGD | ATD | |||||
|---|---|---|---|---|---|---|---|---|
| R Value | P Value | R Value | P Value | R Value | P Value | R Value | P Value | |
| Corneal staining vs TMH | −0.322* | .0008 | −0.31* | .015 | +0.400 | .059 | −0.36* | .04 |
| Corneal staining vs TMA | −0.248* | .0106 | −0.29* | .024 | +0.553* | .006 | −0.40* | .018 |
| TBUT vs TMH | +0.391* | <.0001 | +0.422* | .0003 | +0.173 | .48 | +0.374* | .018 |
| TBUT vs TMA | +0.338* | .0004 | +0.405* | .0013 | +0.123 | .616 | +0.458* | .0065 |
| Conjunctival staining vs TMH | −0.232 | .0549 | −0.15 | .338 | −0.02 | .931 | −0.40 | .052 |
| Conjunctival staining vs TMA | −0.156 | .201 | −0.11 | .485 | +0.044 | .841 | −0.36 | .085 |
| Schirmer vs TMH | +0.385* | .0002 | +0.424* | .0009 | +0.188 | .39 | +0.0686 | .691 |
| Schirmer vs TMA | +0.354* | .001 | +0.382* | .004 | +0.198 | .36 | +0.0795 | .665 |
Stay updated, free articles. Join our Telegram channel

Full access? Get Clinical Tree


