Purpose
To evaluate the effect of subretinal fluid (SRF), imaged with spectral-domain optical coherence tomography (SD-OCT), on visual acuity outcomes in cases of uveitic macular edema (ME), and to analyze the response of SRF and uveitic ME to therapy.
Design
Retrospective case series.
Methods
One hundred and one eyes of 75 patients with uveitic ME, as imaged by SD-OCT, were identified at a single tertiary-care referral center. The main outcome measures were best-corrected visual acuity, central subfield thickness (CSFT), and rates of macular edema improvement (≥20% reduction in CSFT), and resolution (defined as reduction of CSFT to <315 μm) of ME at 3 and 6 months follow-up.
Results
Forty eyes of 29 patients had SRF on SD-OCT at presentation, which was associated with greater macular thickness (mean CSFT 488 μm vs 362 μm, P = .0001) and worse visual acuity than ME without SRF (20/115 vs 20/51, P = .015). However, eyes with SRF responded more favorably to treatment, and at 3 and 6 months of follow-up they achieved greater rates of improvement and resolution of ME than eyes without SRF (77% improved and 50% resolved at 6 months, vs 20% and 13%, respectively; P = .003 and P = .017, respectively) and recovered to a similar level of visual acuity (20/62 vs 20/42 at 6 months, P = .54).
Conclusions
SRF in uveitic ME is associated with thicker retinas and worse visual acuity on presentation but responds more favorably to treatment and displays greater rates of edema resolution and visual acuity improvement.
Uveitic macular edema (ME) is the most frequent structural complication of uveitis and the most common cause of visual impairment in patients with uveitis. Studies also have documented the impact of ME on visual acuity in other disease processes, including diabetic retinopathy, branch retinal vein occlusion (BRVO), and Irvine-Gass syndrome.
With the advent of optical coherence tomography (OCT), the ability to recognize the presence of subretinal fluid (SRF) in cases of ME has been greatly enhanced. The more recent introduction of spectral-domain OCT, which offers better image resolution, 3-dimensional mapping, and faster imaging speed, has brought additional insight into the morphologic features of uveitic macular edema. The impact of SRF on visual acuity outcomes and on the response of ME to therapy has not been fully elucidated. In patients with diabetic retinopathy and ME, a spectrum of morphologic subtypes has been described, including ME with associated SRF. In this context, SRF has been associated with worse visual acuity outcomes in response to macular photocoagulation, intravitreal triamcinolone, and intravitreal bevacizumab. Similarly, in patients with BRVO, the presence of SRF appears to decrease the response of ME and visual acuity to grid laser photocoagulation at 6 months follow-up. In contrast, a comprehensive review of uveitic ME with and without SRF (as imaged by time-domain OCT) demonstrated no significant difference in visual acuity at 6 months or total retinal thickness at 3 months follow-up after standard uveitis therapy. In this study of SRF in uveitic ME, we sought to characterize the impact of SRF on visual acuity outcomes and the response of ME to treatment, with use of spectral-domain OCT technology and a longer period of OCT follow-up.
Methods
We conducted a retrospective review of patients with uveitic ME seen at the Department of Ophthalmology at the Mount Sinai School of Medicine from September 2008 through September 2011. Approval was obtained from the Institutional Review Board of the medical school prior to initiation of the study. Patients with uveitic ME were identified through a query of the billing records database cross-referencing cases of ME (ICD-9 code 362.53) and uveitis (ICD-9 codes 363.00 through 364.99). A review of all spectral-domain OCTs (Heidelberg Spectralis; Heidelberg Engineering, Vota, California, USA) performed on patients with diagnosis codes 363.00 through 364.99 also was conducted in order to ensure the identification of all patients with uveitic ME. All patients meeting the criteria were included from the time when spectral-domain OCT became available in September 2008 until the data collection phase of the study was concluded at the end of September 2011. Patients with retinal edema from choroidal neovascularization were excluded.
Data Collection and Outcome Measures
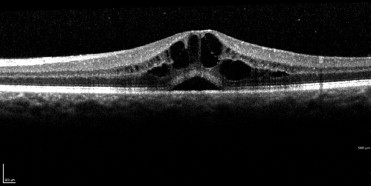
Patients with uveitic macular edema were identified, all OCTs of both eyes reviewed, and the presence or absence of SRF ( Figure 1 ) confirmed. Patients and eyes were characterized as having or not having SRF based on the first visit at which ME was identified (baseline or ME “presentation” visit). Best-corrected visual acuity, presence or absence of SRF, and central subfield thickness as recorded by the Spectralis OCT were recorded at presentation and 3 and 6 months after presentation. If a patient did not complete both a 3-month and 6-month follow-up visit by the time the data collection phase of the study terminated, the patient was recorded as having only partial follow-up and only the available data for that patient were used. Macular edema was defined as a retinal thickness of 315 μm or greater in the central subfield of the Spectralis OCT. Subretinal fluid was defined as a hyporeflective space causing elevation of the neurosensory retina away from the underlying retinal pigment epithelium/choriocapillaris. Eyes with macular edema were further classified as having either cystoid macular edema or diffuse macular edema based on the presence or absence of hyporeflective cystoid spaces in the retinal parenchyma. This classification was used for subgroup analyses. Improvement in ME was defined as a 20% reduction in macular thickness or resolution of edema if a less than 20% decrease led to normalization in the macular thickness. Resolution of macular edema was defined as a decrease in macular thickness to a normal level (<315 μm). Visual acuity was analyzed using logarithm of minimal angle of resolution (logMAR) transformation to determine mean acuities and transformed back to Snellen equivalents for reporting purposes. Visual acuities recorded as hand motion or count fingers were converted to logMAR equivalents using previously described methods. In addition, the percentages of patients with acuities at standard thresholds (20/40 or better and 20/200 or worse) were reported at baseline and at 3 and 6 months. Age, sex, race, months elapsed since the diagnosis of uveitis, presence or absence of an epiretinal membrane (ERM), treatment modality (oral corticosteroids, regional corticosteroids, or immunomodulatory therapy), and anatomic location of uveitis (anterior, intermediate, anterior and intermediate, posterior, or panuveitis) also were recorded and accounted for as potential confounders.
Statistical Analysis
Mixed analysis of variance (ANOVA) models, stratified by visit, were used to relate the outcomes of central subfield thickness and logMAR to the presence or absence of SRF. These models take into account the correlation between eyes in the same patient. Separate variances were estimated for each of the SRF groups since these variances were not homogeneous. Log-binomial regression models were used to relate the binary outcomes of improvement and resolution to presence or absence of SRF. The parameters of these models were estimated using the generalized estimating equations (GEE) method; like the mixed ANOVA models, this method accounts for the correlation between eyes within a patient. χ 2 and Wilcoxon tests were used to compare patient characteristics on categorical and continuous variables, respectively, between SRF groups. All analyses were carried out using SAS 9.2 (SAS Institute Inc, Cary, North Carolina, USA). P values are nominal, as no correction was made for multiple comparisons.
Results
Characteristics of the Patient Population
Demographic data and general characteristics of the study population are presented in Table 1 . Seventy-five patients with uveitic ME were identified, of whom 29 (38.7%) had SRF on OCT and 46 (61.3%) did not. Sex distribution and anatomic type of uveitis were similar between the 2 groups. There was no statistically significant difference in the presence of epiretinal membranes between the 2 groups, but there was a trend toward a higher percentage of epiretinal membranes in the patients without subretinal fluid. There was a greater proportion of Hispanic patients in the SRF group ( P = .01). Among patients with SRF, 19 (65.5%) were non-Hispanic white, 6 (20.7%) were Hispanic, and 4 (13.8%) were African American. Patients with SRF had, on average, a shorter duration of uveitis (median 12 months since diagnosis vs 30 months [ P = .02]) and were more likely to have bilateral ME (51.7% vs 23.9% [ P = .01]).
| Characteristic | All Patients | Patients With Subretinal Fluid in At Least 1 Eye | Patients Without Subretinal Fluid in Either Eye | P Value |
|---|---|---|---|---|
| Number of patients | 75 | 29 | 46 | |
| Sex, n (%) | .51 | |||
| Men | 32 (42.7) | 11 (37.9) | 21 (45.7) | |
| Women | 43 (57.3) | 18 (62.1) | 25 (54.3) | |
| Race, n (%) a | .040 | |||
| White, non-Hispanic | 52 (70.3) | 19 (65.5) | 33 (73.3) | |
| Hispanic | 7 (9.5) | 6 (20.7) | 1 (2.2) | |
| African American | 13 (17.6) | 4 (13.8) | 9 (20.0) | |
| Asian/Pacific Islander | 2 (2.7) | 0 (0.0) | 2 (4.5) | |
| Ethnicity, n (%) a | .013 | |||
| Non-Hispanic | 67 (90.5) | 23 (79.3) | 44 (97.8) | |
| Hispanic | 7 (9.5) | 6 (20.7) | 1 (2.2) | |
| Months since uveitis diagnosis [interquartile ranges] | 23.0 | 12.0 [3.0, 24.0] | 30.0 [9.0, 96.0] | .021 |
| Bilateral macular edema, n (%) | 26 (34.7) | 15 (51.7) | 11 (23.9) | .014 |
| Epiretinal membrane in an eye with macular edema, n (%) | 36 (48.0) | 10 (34.5) | 26 (56.5) | .06 |
| Type of uveitis, n (%) | .95 | |||
| Anterior uveitis | 12 (16.0) | 4 (13.8) | 8 (17.4) | |
| Intermediate uveitis | 17 (22.7) | 7 (24.1) | 10 (21.7) | |
| Anterior and intermediate uveitis | 18 (24.0) | 6 (20.7) | 12 (26.1) | |
| Posterior uveitis | 15 (20.0) | 6 (20.7) | 9 (19.6) | |
| Panuveitis | 13 (17.3) | 6 (20.7) | 7 (15.2) |
a Data was not available for one patient. Percentages were calculated for 45 patients.
Of the 75 patients, 14 had no available 3- or 6-month follow-up data, whereas 61 had follow-up data available. Comparison of those with and without follow-up showed no statistically significant differences for age, race, sex, bilateral macular edema, presence of ERM, or the percentage of patients with SRF in at least 1 eye (37.7% [23/61]) of patients with follow-up had SRF vs 42.9% (6/14) of patients without follow-up, P = .72). The duration of uveitis at presentation was statistically different between the 2 groups (median duration 24.0 months for those with follow-up vs 3.0 months for those without, P = .004).
Subretinal Fluid on Optical Coherence Tomography, Macular Thickness, and Visual Acuity at Presentation
Comparison of eyes with and without SRF at presentation is detailed in Table 2 . Subretinal fluid was associated with greater retinal thickness and poorer visual acuity at presentation. Average central subfield thickness for eyes with SRF at presentation was 488 μm, vs 362 μm for eyes without SRF ( P = .0001). The minimal angle of resolution was more than doubled in eyes with SRF, with a mean Snellen visual acuity of 20/115 (logMAR 0.76), vs 20/51 (logMAR 0.41) in eyes lacking SRF ( P = .0147). Fifty-one percent (31/61) of eyes without SRF had visual acuity 20/40 or better, vs 30% (12/40) of eyes with SRF. Thirty-two percent (13/40) of eyes with SRF had a presentation acuity of 20/200 or worse, vs 16% (10/61) of eyes without SRF. Subgroup analysis by presence and absence of cystoid spaces also was performed and yielded results similar to the primary analysis. In the eyes presenting with cystoid ME, the mean central subfield thickness was 492 μm for eyes with SRF and 374.7 μm for those without SRF, P = .0004, and in those presenting with noncystoid (diffuse) edema, the mean central subfield thickness was 520 μm for eyes with SRF and 349 μm for eyes without SRF, P = .06.
| Characteristic | Eyes With Subretinal Fluid | Eyes Without Subretinal Fluid | Mean Difference/Prevalence Ratio | 95% CI | P Value |
|---|---|---|---|---|---|
| Number of eyes | 40 | 61 | |||
| Central subfield thickness (μm), mean ± SE | 488 ± 28 | 362 ± 5.70 | 126 ± 29 | 68, 185 | .0001 |
| Visual acuity | |||||
| logMAR (mean ± SE) | 0.76 ± 0.12 | 0.41 ± 0.06 | 0.35 ± 0.14 | 0.07, 0.62 | .015 |
| Mean acuity (Snellen) | 20/115 | 20/51 | |||
| 20/40 or better (%) | 30 | 51 | 0.65 | 0.39, 1.07 | .091 |
| 20/200 or worse (%) | 32 | 16 | 1.94 | 0.93, 4.03 | .077 |
Subretinal Fluid on Optical Coherence Tomography and Response to Treatment
Treatment data for patients with and without SRF are outlined in Table 3 . There was no significant difference between the percentage of patients with and without SRF receiving oral corticosteroids, immunosuppressive therapy, or regional corticosteroids ( P = .09, P = .60, P = .12, respectively). We also evaluated the proportion of patients treated with combination oral corticosteroids and regional corticosteroid injections and found no difference between the 2 groups ( P = .19). The response to therapy is outlined in Table 4 . Eyes with SRF were more likely to experience improvement of retinal edema, resolution of edema, and improvement in visual acuity than were eyes without SRF. At 3 months follow-up, 74% (23/31) of eyes with SRF at baseline had improvement of thickness and 48% (15/31) had resolution of ME, whereas 23% (11/48) without SRF had improvement and 21% (10/48) had resolution ( P < .0001 and P = .019, respectively). At 6 months follow-up, the results were similar, with 77% (17/22) of SRF eyes experiencing improvement in thickness compared with presentation and 50% (11/22) having resolution of ME, vs 20% (6/31) and 13% (4/31), respectively in the non-SRF group ( P = .003 and P = .017, respectively). The response of mean central subfield thickness over time is illustrated in Figure 2 . At 3 and 6 months follow-up, the groups with and without SRF had similar mean central subfield thicknesses (328 μm vs 360 μm at 6 months, P = .28) and visual acuities. The mean Snellen equivalents for visual acuity for those with and without SRF at the 3-month follow-up were 20/54 and 20/51 ( P = .91) and at the 6-month follow-up were 20/62 and 20/42, respectively ( P = .54). In subgroup analyses of the 6-month follow-up data for patients presenting with cystoid ME, eyes presenting with SRF had similar thicknesses to those presenting without SRF (mean central subfield thickness 337 μm vs 320 μm, P = .63). Likewise, at 6 months follow-up for patients presenting with diffuse edema, eyes presenting with SRF had similar thicknesses to those presenting without SRF (mean CSFT 320 μm vs 377 μm, P = .29).
| Treatment | Patients With Subretinal Fluid in At Least 1 Eye | Patients Without Subretinal Fluid In Either Eye | P Value | ||
|---|---|---|---|---|---|
| Number | Percent | Number | Percent | ||
| Regional corticosteroids a | 8 | 33 | 6 | 15 | .12 |
| Oral corticosteroids | 18 | 75 | 21 | 54 | .09 |
| Immunosuppression | 12 | 50 | 16 | 41 | .60 |
| Combination regional corticosteroids a & oral corticosteroids | 7 | 29 | 5 | 13 | .19 |
a Regional corticosteroids include those given periocularly and those given intravitreally.
| Outcome | Eyes With Subretinal Fluid a | Eyes Without Subretinal Fluid a | Mean Difference/Prevalence Ratio | 95% CI | P Value |
|---|---|---|---|---|---|
| At 3 months follow-up | |||||
| Number of eyes | 31 | 48 | |||
| Central subfield thickness (μm), mean ± SE | 336 ± 22 | 372 ± 11 | −36 ± 24 | −85, 14 | .15 |
| Improvement edema (%) b | 74 | 23 | 3.22 | 1.87, 5.52 | <.0001 |
| Resolution edema (%) b | 48 | 21 | 2.26 | 1.15, 4.47 | .0187 |
| Visual acuity | |||||
| logMAR (mean ± SE) | 0.43 ± 0.13 | 0.41 ± 0.06 | −0.02 ± 0.14 | −0.27, 0.30 | .91 |
| Mean acuity (Snellen) | 20/54 | 20/51 | |||
| 20/40 or better (%) | 66 | 57 | 1.17 | 0.84, 1.62 | .36 |
| 20/200 or worse (%) | 16 | 18 | 0.90 | 0.37, 2.20 | .81 |
| At 6 months follow-up | |||||
| Number of eyes | 22 | 31 | |||
| Central subfield thickness (μm), mean ± SE | 328 ± 25 | 360 ± 14 | −32 ± 29 | −92, 28 | .28 |
| Improvement edema (%) b | 77 | 20 | 3.49 | 1.53, 7.96 | .003 |
| Resolution edema (%) b | 50 | 13 | 4.61 | 1.32, 16.08 | .017 |
| Visual acuity | |||||
| logMAR (mean ± SE) | 0.49 ± 0.24 | 0.32 ± 0.06 | 0.16 ± 0.25 | −0.42, 0.74 | .54 |
| Mean acuity (Snellen) | 20/62 | 20/42 | |||
| 20/40 or better (%) | 64 | 55 | 1.16 | 0.75, 1.77 | .51 |
| 20/200 or worse (%) | 23 | 13 | 1.81 | 0.65, 5.02 | .26 |
Stay updated, free articles. Join our Telegram channel

Full access? Get Clinical Tree


