Purpose
To assess whether laser treatment to the retinal pigment epithelium anterior to drusen in eyes of patients with EFEMP1 -related maculopathy affects visual acuity, deposit volume, and retinal sensitivity.
Design
Prospective, interventional case series.
Methods
In 11 patients with autosomal dominant drusen and confirmed disease-causing EFEMP1 mutation, the worse-seeing eye was treated with Argon green laser (10 to 15 laser spots; 200-μm spot size, 0.1-second duration, 80 to 120 mW). Patients were examined before treatment as well as 1, 3, 6, and 12 months after the procedure. Clinical assessment included visual acuity, fundus-controlled perimetry, spectral-domain optical coherence tomography, and autofluorescence imaging. Custom-made software allowed for coregistration of fundus-controlled perimetry and spectral-domain optical coherence tomography data sets. The main outcome measures were change in visual acuity, retinal sensitivity, and drusen volume.
Results
The untreated eyes lost an average of 0.8 letters, whereas the treated eyes gained an average of 4.9 letters. For fundus-controlled perimetry, locus-by-locus differences in sensitivity were calculated between pretreatment and posttreatment assessments; subsequently, the overall difference in the treated and untreated eye was compared. Five patients showed significant improvement in retinal sensitivity, 5 patients showed no change, and 1 patient showed significant deterioration. An increase in mean drusen thickness was observed in the untreated eyes, but not in the treated eyes ( P = .0322). The thickness of the drusen correlated with retinal sensitivity (ρ = −0.49; P < .0001). Safety was demonstrated and no adverse events were observed.
Conclusions
Low-energy laser treatment is safe and may be effective in the treatment of autosomal dominant drusen. Further evaluation with long-term assessment is required to confirm the benefits.
Autosomal dominant drusen (MIM 126600) is a dominantly inherited maculopathy, also known as Doyne honeycomb retinal dystrophy and Malattia Leventinese. Autosomal dominant drusen is characterized by drusen in the macular area and, typically, around the edge of the optic nerve head. These drusen appear in early adulthood, are radially distributed, and with age, increase in size and number. As material gradually accumulates beneath the retinal pigment epithelium (RPE), large confluent drusen are formed, leading to RPE and outer retinal atrophy. Patients typically are asymptomatic until the fourth or fifth decade of life, when they demonstrate metamorphopsia, reduced visual acuity, and occasionally, abnormal dark adaptation. As the disease progresses, additional central visual loss occurs and absolute scotomata become evident. Choroidal neovascularization (CNV), although rare, can be a complication in autosomal dominant drusen. Importantly, marked interfamilial and intrafamilial variability is observed in terms of retinal appearance, severity, and progression. To date, there is no beneficial medical or surgical treatment.
A single heterozygous missense mutation (p.Arg345Trp) in the EFEMP1 (EGF-containing fibulin-like extracellular matrix protein 1) gene encoding fibulin 3 is responsible for the autosomal dominant drusen phenotype. Fibulin 3 is an extracellular matrix glycoprotein, secreted in a number of tissues, including the RPE. In autosomal dominant drusen donor eyes, mutant fibulin 3 was found to accumulate within and beneath the RPE cells overlaying the drusen, but was not a major component of the drusen themselves. A similar fibulin-3 deposition pattern was observed also in eyes from patients diagnosed with age-related macular degeneration (AMD), suggesting that fibulin 3 may have a role in AMD.
Autosomal dominant drusen has a close phenotypic similarity to AMD, where laser photocoagulation has been shown to lead to drusen reabsorption and has been tried as a prophylactic treatment. Meta-analysis of 9 randomized controlled trials of laser treatment of drusen in AMD confirmed that laser photocoagulation leads to drusen disappearance; however, no evidence was found that it reduces the risk of developing CNV, geographic atrophy, or visual acuity loss.
The aim of this study was to obtain a detailed clinical phenotype of autosomal dominant drusen and to assess the efficacy of laser photocoagulation as a therapeutic approach for patients with autosomal dominant drusen. Primary outcome measures are change in visual acuity, change in retinal sensitivity as determined with fundus-controlled perimetry, and change in drusen volume as determined with spectral-domain optical coherence tomography (SD OCT) imaging. A secondary outcome measure was the evaluation of safety of laser treatment in autosomal dominant drusen patients.
Methods
Study Subjects and Clinical Examination
Thirteen patients from 9 families with autosomal dominant drusen and confirmed p.Arg345Trp mutation in the EFEMP1 gene encoding fibulin 3 were included in this prospective, interventional case series. The median age was 56 years (range, 35 to 66 years). The inclusion criterion was average loss of macular function of 10 dB or more in an area of more than 1 disc diameter within the central 20 degrees of field in at least 1 eye, as assessed by fundus-controlled perimetry. If both eyes fulfilled the inclusion criterion, the worse-seeing eye, as assessed by visual acuity, was assigned for treatment. If visual acuity was the same in both eyes, the nondominant eye was treated. The exclusion criterion was previously diagnosed CNV. Informed consent was obtained in all patients before the baseline assessment.
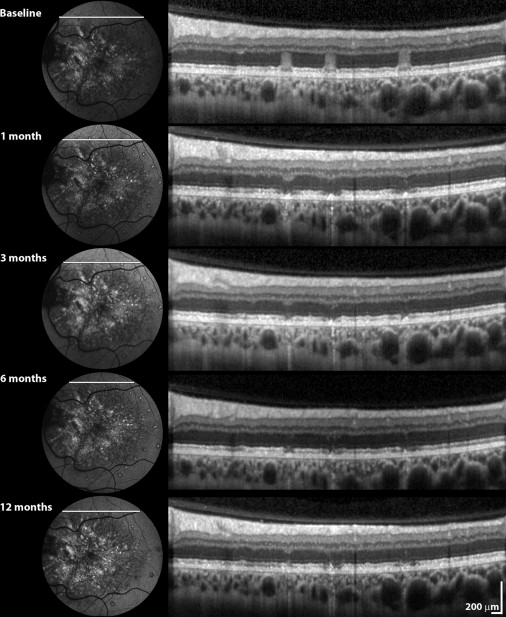
The eye assigned to treatment received photocoagulation with Argon green laser with a 200-μm spot size and a 0.1-second duration. The power setting was titrated to cause RPE blanching (in general between 80 and 120 mW). A total of 10 to 15 laser burns were placed anterior to the drusen boundary and at least 500 μm from the fovea. Immediate posttreatment fundus autofluorescence (FAF) imaging was performed. Evolution of laser lesions over time was monitored with SD OCT.
Patients were examined at baseline as well as at 1, 3, 6, and 12 months after laser treatment. Clinical assessment included Early Treatment Diabetic Retinopathy Study visual acuity, color fundus photography (TRC-50IA; Topcon, Tokyo, Japan), fundus-controlled perimetry (MP1 Microperimeter; Nidek Technologies, Padova, Italy), SD OCT (Spectralis; Heidelberg Engineering, Heidelberg, Germany), and FAF (Heidelberg Retina Angiograph, Heidelberg Engineering). Our SD OCT protocol included a volume scan (145 B scans) over a 20 × 20-degree block of the macular region. Fundus-controlled static perimetry also was performed. All patients underwent a special training test at the beginning of perimetry testing to familiarize themselves with the procedure. The right eye always was tested first. For static MP1 microperimetry, the Humphrey10 program, assessing 76 retinal locations in the central 20 degrees with a 4-2 staircase and threshold sensitivities from 0 to 20 dB, was used; the test spot size was Goldmann III. All procedures were carried out in both eyes to compare results before and after laser surgery and also between the treated and nontreated eye. Perimetry scores ranged from −1 (no response to brightest stimulus) to 20 (response with 20 dB).
Safety measures were assessed by complete ophthalmic examination, ocular imaging, and review of symptoms. The primary safety measure was development of CNV.
Coregistration of Functional Testing, Autofluorescence Imaging, and Retinal Thickness Profiles
The custom-made software tool MultiModalMapper version 1.1 was used to align FAF, MP1 microperimetry, and SD OCT data sets accurately using anatomic landmarks. The MultiModalMapper 1.1 software is not a commercial product. The software was developed as a Microsoft Windows Presentation Foundation application (Microsoft Inc, Redmond, Washington, USA) using the Microsoft NET Framework 3.5 sp1.24. To map FAF and MP1 microperimetry on SD OCT data, we manually selected at least 3 landmarks on related fundus images. The result of the coregistration process was visualized immediately as an overlaid image to allow for adjustment by moving or adding additional landmarks. After coregistration and alignment, the SD OCT data set was rendered as a 3-dimensional model, with the FAF image and MP1 microperimetry color-coded data layers displayed as textured planes.
In this study, a manual segmentation by 2 expert graders (E.L., E.T.) was performed. The graders were masked to the treatment status of the eyes. Markers for the internal limiting membrane, the drusen border, and the outer border of RPE were positioned manually in MultiModalMapper with an accuracy of 1 μm or better (depending on the chosen zoom level during segmentation). Subsequently, these markers were used to define borderlines and to create thickness maps for neurosensory retina (from the vitreoretinal interface to the drusen border), drusen (from drusen border to the outer border of the RPE), and total retina (from the vitreoretinal interface to the outer border of the RPE) for the baseline and 12-month examination and allowed us to determine the changes in thicknesses in 1 year’s time. Neurosensory retina and drusen retinal thickness was determined for each MP1 microperimetry data point for baseline and 12 months, and the difference in thicknesses in 1 year’s time was calculated.
Statistical Analysis
Statistical analysis was performed using the GraphPad Prism software version 4.00 (GraphPad Software, San Diego, California, USA). The data are reported as median with corresponding interquartile ranges. The Wilcoxon signed-rank test was used to compare the change in visual acuity, scotoma size, and drusen volume before and 1 year after laser photocoagulation between the treated and nontreated eyes. For retinal sensitivity, locus-by-locus differences before and after treatment were calculated, and a Wilcoxon signed-rank test was performed for each patient. The Spearman rank correlation coefficient (ρ) was used to measure the association between static perimetry values and drusen or neurosensory retinal thickness; 1 eye of each patient was used. Nonparametric (distribution-free) tests were chosen because the calculated parameters were not distributed normally. We plotted retinal thickness as a function of retinal sensitivity in linear units, because it was shown previously that a simple linear model accurately relates SD OCT to retinal sensitivity parameters; 20, 40, 60, 80, and 100 in a linear scale correspond to a retinal sensitivity of 13 dB, 16 dB, 18 dB, 19 dB, and 20 dB, respectively.
Results
The data presented are for 11 patients who successfully finished a 1-year follow-up. Two patients were excluded from analysis; one patient could not perform the tests reliably (amblyopic eye), and the other failed to finish the follow-up because of other medical problems. Results are summarized in the Table . Notably, none of the patients demonstrated any complications, such as CNV. Evolution of laser lesions over time (as monitored with SD OCT) is presented in Figure 1 .
| Patient No. | Age (y) | Visual Acuity (ETDRS Letters) | Microperimetry | SD OCT Drusen (μm) | Subjective Report | |||||
|---|---|---|---|---|---|---|---|---|---|---|
| Mean Sensitivity (dB) | Absolute Scotoma Size a | |||||||||
| Untreated | Treated | Untreated | Treated | Untreated | Treated | Untreated | Treated | |||
| 1 | 35 | −28 | −19 | 0.2 | 3.7 | 3 | −1 | 6.1 | 0.7 | Worsened |
| 2 | 42 | 14 | 13 | 2.9 | 2.2 | −2 | 3 | 8.3 | −1.8 | Improved |
| 3 | 45 | 0 | 6 | 1.8 | 3.2 | 0 | −3 | −0.8 | 3.5 | Improved |
| 4 | 47 | 2 | −6 | 1.2 | 1.2 | 2 | −2 | 5.5 | −0.6 | No change |
| 5 | 47 | 0 | 10 | 0.8 | 3.5 | 2 | −13 | 0.7 | 6.9 | Improved |
| 6 | 56 | 5 | 0 | −0.6 | 1.0 | 3 | −13 | 1.7 | 3.1 | Worsened |
| 7 | 56 | 1 | 10 | 2.6 | 5.2 | 2 | −20 | 6.6 | −2.3 | Improved |
| 8 | 57 | −4 | 14 | 0.5 | 0.1 | 4 | 1 | 6.4 | −4.1 | Improved |
| 9 | 62 | 1 | 6 | 0.4 | −0.6 | 0 | 6 | 7.1 | −6.5 | Worsened |
| 10 | 66 | 0 | 5 | 2.9 | 1.2 | 1 | 6 | 4.8 | −0.1 | No change |
| 11 | 66 | 0 | 15 | −0.2 | 3.0 | −5 | −14 | 11.3 | 0.9 | Improved |
a Number of perimetry sites tested that had a sensitivity score of –1 (no response to brightest stimulus).
Visual Acuity
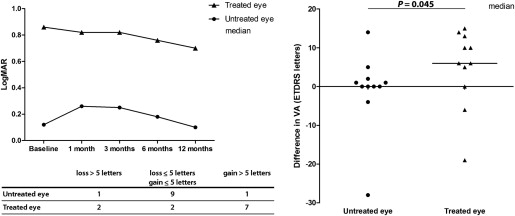
Median visual acuity over time is presented in Figure 2 , Top left. The difference in visual acuity for the treated and untreated eye between baseline and 12 months after treatment was assessed ( Figure 2 , Right). Overall, visual acuity in treated eyes improved compared with that in untreated eyes ( P = .0449, Wilcoxon signed-rank test). Notably, more than a 5-letter gain was observed in 7 of 11 patients in the treated eye ( Figure 2 , Bottom left).
Retinal Sensitivity
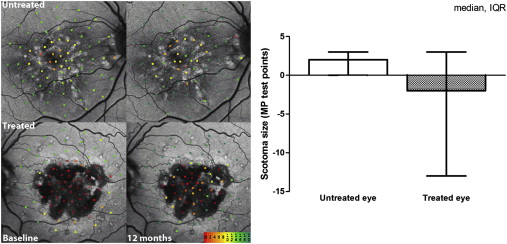
Locus-by-locus differences in retinal sensitivity before and after treatment were calculated. To eliminate test–retest variability, overall change in retinal sensitivity between baseline and 12 months was compared between the treated and untreated eye. The Wilcoxon signed-rank test revealed statistically significant improvement ( P < .0167) after 12 months in 5 of 11 patients, no change in 5 patients, and deterioration in 1 patient. The scotoma size was evaluated as the number of MP1 microperimetry sites tested that had a sensitivity score of −1, that is, there was no response to the brightest stimulus. In the treated eyes, the scotoma reduced in size, whereas in the untreated eyes, it enlarged; however, this result was not statistically significant ( P = .197, Wilcoxon signed-rank test; Figure 3 ).
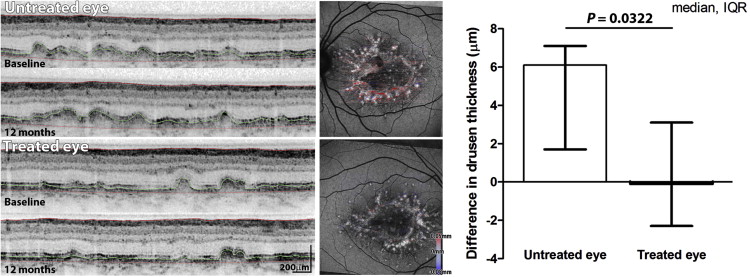
Deposit and Neurosensory Retina Thickness
Mean thickness (of drusen deposit and neurosensory retina) was assessed in the treated and untreated eye at baseline and at 12 months after the laser treatment. Over time, drusen thickness reduced marginally in the average treated eye and increased in the average untreated eye. Analysis of difference in mean drusen thickness for each eye revealed an increase in the untreated eyes, but not in the treated eyes ( P = .0322, Wilcoxon signed-rank test; Figure 4 ). The median difference in neurosensory retina thickness showed thinning in the untreated eye (−3.6; interquartile range, −13.6 to 2.4) compared with that in the treated eye (−0.3; interquartile range, −2.0 to 0.2); however, this was not statistically significant ( P = .1748, Wilcoxon signed-rank test).