Purpose
To investigate the structure of polypoidal choroidal vasculopathy (PCV) by tomographic localization of the branching vascular network and late geographic hyperfluorescence.
Design
Observational case series.
Methods
We examined 34 eyes with PCV by simultaneous indocyanine green angiography (ICGA) and spectral-domain optical coherence tomography (OCT) imaging. The margin of the branching vascular network and the late geographic hyperfluorescence on ICGA was colocalized on OCT, in a point-to-point manner, using innate software. The large vessels within the branching vascular network were also colocalized on OCT.
Results
Late geographic hyperfluorescence on ICGA was noted in 30 eyes. The extent of late geographic hyperfluorescence was larger than that of branching vascular network in 12 eyes. In the remaining eyes, the extent was the same. A double-layer sign on OCT, which consisted of two hyper-reflective lines, representing the retinal pigment epithelium and Bruch membrane, was noted in 29 eyes. In all 28 eyes exhibiting both late geographic hyperfluorescence and the double-layer sign, the extent of late geographic hyperfluorescence matched exactly the extent of double-layer sign on OCT. In 7 of 34 eyes, the thickness of the subretinal pigment epithelial space over the Bruch membrane was too thin to accommodate the large vessels of the branching vascular network. Although the double-layer sign showed mild reduction in area after photodynamic therapy, its general configuration was maintained.
Conclusions
Late geographic hyperfluorescence on ICGA corresponds with the double-layer sign on OCT in eyes with PCV. Our observations suggest that the double-layer sign consists mainly of fibrous tissue harbored by the branching vascular network, and late geographic hyperfluorescence may originate from the staining of tissue.
Polypoidal choroidal vasculopathy (PCV) is a disease characterized by polypoidal subretinal vascular lesions associated with serous and hemorrhagic detachment of the retinal pigment epithelium (RPE). In addition to the characteristic polypoidal lesion, PCV exhibits several distinctive angiographic features that are differentiated from other types of choroidal neovascularization (CNV). Indocyanine green angiography (ICGA) shows a branching vascular network and vascular dilation at the border of the network of vessels. Choroidal vascular hyperpermeability on ICGA is more commonly noted in PCV than in other types of CNV. Recently, one study reported more common bilateral involvement, thickened choroid, and poor response to intravitreal injections of ranibizumab in patients with PCV associated with choroidal vascular hyperpermeability than those without it.
Late geographic hyperfluorescence, which is defined as a well-demarcated hyperfluorescent lesion in late-phase ICGA, is another characteristic finding in PCV. Late geographic hyperfluorescence has been suggested to be a highly sensitive and specific ICGA finding for PCV. In previous studies, late geographic hyperfluorescence was noted in almost all eyes with PCV, whereas only 7.5% of eyes with exudative age-related macular degeneration exhibited late geographic hyperfluorescence. In addition, the presence of late geographic hyperfluorescence, even in the absence of a branching vascular network in the unaffected fellow eye appears to be a significant risk factor for the development of active PCV, thus constituting the diagnosis of preclinical PCV. However, whether late geographic hyperfluorescence represents only a late-phase manifestation of a branching vascular network or another pathologic feature remains to be elucidated. Currently, little is known about the structure of PCV, especially the detailed tomographic localization of the branching vascular network and late geographic hyperfluorescence.
The purpose of the present study was to investigate the topographic features of branching vascular network and late geographic hyperfluorescence. We used simultaneous confocal scanning laser ophthalmoscopy combined with spectral-domain optical coherence tomography (OCT) for accurate colocalization between angiographic and tomographic features.
Methods
This observational case series was performed at a single center and the methodology adhered to the tenets of the Declaration of Helsinki. The study was prospectively approved by the institutional review board (Samsung Medical Center IRB No. 2012-06-069).
We conducted a medical record review of patients diagnosed with idiopathic PCV at our institution between May 2011 and May 2012. Eyes with other macular abnormalities, including high myopia, idiopathic CNV, angioid streak, other secondary CNVs, macular hole, and epiretinal membrane, were excluded. True cases of CNV accompanied by PCV, which usually exhibits profuse dye leakage on midphase fluorescein angiography, were also excluded.
The diagnosis of PCV was made in accordance with the observation of a branching vascular network with polypoidal vascular dilation at the border or inside the branching vascular networks via ICGA at initial presentation. As defined in our previous study, late geographic hyperfluorescence is a hyperfluorescent lesion with a clearly demarcated geographic margin, which becomes apparent approximately 10 minutes after injection of indocyanine green dye ( Figure 1 ).
Each patient underwent a comprehensive ophthalmologic evaluation, including examinations for best-corrected visual acuity using a Snellen visual acuity chart, anterior segment examination, and dilated fundus examination with a 90-diopter lens. ICGA and spectral-domain OCT examinations were conducted using a combined instrument (Spectralis HRA-OCT, Heidelberg Engineering, Heidelberg, Germany). Horizontal and vertical enhanced depth imaging OCT crosshair scans focused on the center of the fovea were conducted and were followed by simultaneous ICGA-OCT imaging. Between 8 and 12 horizontal or vertical OCT scans covering the extent of polyps, branching vascular network, and late geographic hyperfluorescence were performed while obtaining ICGA images. To improve visualization, 50 to 100 scans were averaged for each section.
We focused on OCT findings observed at the region of the late geographic hyperfluorescence. Accurate point-to-point colocalization of late geographic hyperfluorescence is possible between OCT and late-phase ICGA images. Particular attention was paid to whether the end margin of the double-layer sign on OCT coincided with the border of the late geographic hyperfluorescence or branching vascular network. The double-layer sign was defined as two hyper-reflective layers that consisted of the RPE and another highly reflective layer beneath the RPE. In some eyes, a branching vascular network that was observed in the early phase of ICGA was noted through the late phase of ICGA. However, the exact profile of the branching vascular network could not be determined in the late phase of ICGA in the majority of eyes. In the later cases, colocalization of ICGA and OCT findings was performed with reference to the location of the adjacent retinal vessels or the optic disk. We focused in particular on relatively large-diameter vessels of the branching vascular network in order to determine the location of these vessels on OCT images.
Temporal changes in the double-layer sign were identified during follow-up examination by additional measurement of the area between the RPE and Bruch membrane in eyes that showed a definite double-layer sign. OCT images of crosshair scans focused on the center of the fovea were imported into Image J (National Institutes of Health, Bethesda, MD, USA) software for measurement. The area between the RPE and Bruch membrane was measured manually using the polygon selection tool provided by the software and defined as an area of the double-layer sign. The mean area of the double-layer sign in each eye was obtained by averaging the values from horizontal and vertical scans. RPE detachment secondary to the active polyps was not included in the area measurement. The area measured when an active polyps was noted on ICGA was compared to that measured after treatment.
Statistical analyses were performed using a commercially available software package (SPSS v 18.0 for Windows; SPSS, Chicago, IL, USA). The difference in the area of the double-layer sign was estimated using the Wilcoxon signed rank test.
Results
We included 34 eyes of 34 consecutive Korean patients (21 men and 13 women) with PCV. The average age was 69.3 ± 7.7 years (mean ± standard deviation), and the BCVA was 0.49 ± 0.46 (logarithm of minimal angle of resolution). Of the eyes, 11 were treatment-naive. The other 23 eyes were relapsed cases with histories of previous treatments for PCV prior to simultaneous ICGA and OCT examinations for this study. Before the examinations, these patients underwent a mean of 2.0 photodynamic therapy sessions, 0.4 focal laser photocoagulation of active polyps, and 4.4 intravitreal antivascular endothelial growth factor injections. On OCT examination, the double-layer sign, which consisted of two hyper-reflective lines representing the RPE and Bruch membrane, was noted in 29 of 34 eyes (85.3%). Homogenous and heterogeneous reflectivity within the double-layer sign ( Figure 2 ) was noted in 21 eyes (72.4%) and 8 (27.6%) eyes, respectively.
The polyps were located at the end of the double-layer sign in 26 of 29 eyes (89.7%), whereas the polyps were located at the middle of the double-layer sign in the other 3 eyes (10.3%).
We measured the mean area of the double-layer sign based on crosshair scans centered on the fovea in 19 of 29 eyes (65.5%), excluding eyes in which the foveal center was not involved with the double-layer sign. The mean area was 0.093 ± 0.049 mm 2 when active polyps were noted on ICGA. All 19 eyes underwent photodynamic therapy, and the mean area was changed to 0.080 ± 0.044 mm 2 at 8.1 ± 2.2 weeks after the therapy ( P = 0.001). In most cases, the general configuration of the double-layer sign was maintained throughout the follow-up period after the photodynamic therapy ( Figure 3 ).
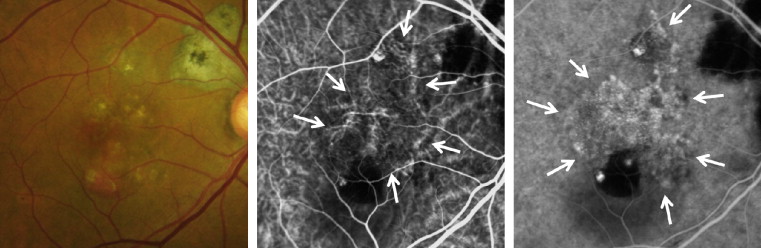
In 30 eyes (88.2%), we found evidence of late geographic hyperfluorescence in ICGA. The extent of late geographic hyperfluorescence matched exactly the total area of the branching vascular network and polyps in 18 of 30 eyes (60.0%), whereas the area of late geographic hyperfluorescence was larger than that of the branching vascular network in the other 12 eyes (40.0%). In all 28 eyes evidencing both late geographic hyperfluorescence and double-layer sign, colocalization analysis showed that the extent of the double-layer sign on OCT exactly matched the extent of late geographic hyperfluorescence on ICGA. In all 12 eyes in which the extent of late geographic hyperfluorescence was larger than that of the branching vascular network, the extent of the double-layer sign was clearly greater than the extent of the branching vascular network and matched the extent of late geographic hyperfluorescence ( Figure 4 ).
Stay updated, free articles. Join our Telegram channel

Full access? Get Clinical Tree


