Purpose
To assess the correlations between retinal nerve fiber layer (RNFL) thickness measured with scanning laser polarimetry and visual field (VF) sensitivity in primary open-angle glaucoma (POAG) and primary angle-closure glaucoma (PACG).
Design
Prospective, comparative, observational cases series.
Methods
Fifty patients with POAG and 56 patients with PACG were examined using scanning laser polarimetry with variable corneal compensation (GDx VCC; Laser Diagnostic Technologies, Inc.) and Humphrey VF analyzer (Carl Zeiss Meditec, Inc.) between August 2005 and July 2006 at Taipei Veterans General Hospital. Correlations between RNFL thickness and VF sensitivity, expressed as mean sensitivity in both decibel and 1/Lambert scales, were estimated by the Spearman rank correlation coefficient ( r s ) and multivariate median regression models (pseudo R 2 ). The correlations were determined globally and for 6 RNFL sectors and their corresponding VF regions.
Results
The correlation between RNFL thickness and mean sensitivity (in decibels) was weaker in the PACG group ( r s = 0.38; P = .004; pseudo R 2 = 0.17) than in the POAG group ( r s = 0.51; P < .001; pseudo R 2 = .31), but the difference in the magnitude of correlation was not significant ( P = .42). With Bonferroni correction, the structure–function correlation was significant in the superotemporal ( r s = 0.62), superonasal ( r s = 0.56), inferonasal ( r s = 0.53), and inferotemporal ( r s = 0.50) sectors in the POAG group (all P < .001), whereas it was significant only in the superotemporal ( r s = 0.53) and inferotemporal ( r s = 0.48) sectors in the PACG group (both P < .001). The results were similar when mean sensitivity was expressed as 1/Lambert scale.
Conclusions
Both POAG and PACG eyes had moderate structure–function correlations using scanning laser polarimetry. Compared with eyes with POAG, fewer RNFL sectors have significant structure–function correlations in eyes with PACG.
Glaucoma is a progressive optic neuropathy characterized by loss of retinal ganglion cells and their axons, which results in thinning of the retinal nerve fiber layer (RNFL) and a reduction of visual field (VF) sensitivity. Both structural and functional losses provide important information in the diagnosis and evaluation of glaucoma. Structural loss is assessed clinically by evaluating the cup-to-disc ratio, neuroretinal rim dimensions, and RNFL thickness. Among these, RNFL atrophy may precede the changes in the optic disc. New imaging technologies provide objective and quantitative measurements of RNFL thickness. Several studies have reported structure–function associations in glaucoma between VF sensitivity and RNFL thickness using a variety of imaging technology, including scanning laser polarimetry (SLP), confocal scanning laser ophthalmoscopy, and optical coherence tomography (OCT). The strength of associations generally are moderate, with a coefficient of determination ranging from 0.11 to 0.62, depending on perimetry scale, RNFL measuring instruments, and patient characteristics.
The pathophysiologic characteristics of primary open-angle glaucoma (POAG) include an interplay of multiple factors such as reduced perfusion to the optic nerve, abnormalities of axonal or ganglion cell metabolism, and disorders of the extracellular matrix of the lamina cribrosa. The current classification scheme defines primary angle-closure glaucoma (PACG) as an eye with glaucomatous optic neuropathy and VF defect similar to those in POAG and an occludable drainage angle. Most cases of PACG are asymptomatic and chronic. Chronic PACG may develop after the resolution or may precede an acute attack of angle closure. Unlike POAG, in which high intraocular pressure (IOP) is just one of several risk factors, the pathogenetic mechanism of optic neuropathy in PACG primarily is IOP dependent secondary to a crowded anterior segment. Evidence has shown that the pattern of VF defect and the relationship of peripapillary atrophy to the structural and functional optic disc changes are different between POAG and PACG, suggesting differences in the pathophysiology of optic nerve damage.
Previous studies of structure–function correlations included mostly participants with POAG. In light of the concept that the pathophysiologic characteristics of PACG may differ from those of POAG, we suggest a hypothesis that the structure–function correlations differ between these 2 forms of glaucoma. If differences exist, it would be important to take them into account while making the diagnosis and detecting disease progression. Furthermore, such differences may shed light on the underlying pathophysiologic features of the 2 disease entities. In this prospective observational case series, we aimed to compare the structure–function relationship between patients with controlled POAG and PACG by using SLP with variable corneal compensation (GDx VCC; Laser Diagnostic Technologies, Inc, San Diego, California, USA) and automated perimetry.
Methods
Subjects
One hundred sixty-five PACG patients and 150 high-tension POAG patients who fulfilled the clinical inclusion criteria were recruited consecutively and prospectively by 1 glaucoma specialist (C.J.L.) between August 2005 and July 2006 at Taipei Veterans General Hospital. Among them, 23 PACG and 29 POAG patients were excluded because of unreliable VF data, and an additional 86 PACG and 71 POAG patients were excluded because of unqualified SLP image. This left a total of 56 PACG and 50 POAG eligible subjects in the present study. All participants underwent a comprehensive ophthalmologic evaluation, including refraction, best-corrected visual acuity (BCVA), slit-lamp biomicroscopy, tonometry, gonioscopy, SLP with variable corneal compensation, and achromatic automated perimetry. In addition, the optic discs were assessed by dilated ophthalmoscopy with a 78-diopters (D) lens and optic disc photography.
The diagnosis of POAG was based on normal open angles; baseline, untreated IOP of 21 mm Hg or more; and reproducible nerve fiber bundle VF defects in at least 2 consecutive field tests that corresponded to the glaucomatous optic disc changes (diffuse or local rim thinning, notching, and excavation). The diagnosis of PACG was based on the same criteria as POAG except that the anterior chamber angle was occludable before laser iridotomy with the posterior trabecular meshwork visible for less than 90 degrees of the angle circumference. Inclusion criteria were BCVA of 20/40 or better, cylinder refraction within ± 3.0 D, controlled IOP (< 24 mm Hg for at least 6 months) at enrollment, and reliable VF test and qualified SLP imaging obtained within a 3-month interval. Patients with glaucoma secondary to medication or other ocular abnormalities, with retinal diseases or other neurologic disease that may cause VF defects, or who had undergone laser or incisional ocular surgery within 3 months were excluded. This study did not include the subgroup of normal-tension glaucoma, and we aimed at comparing the structure–function correlations between patients with high-pressure POAG and PACG.
Automated Perimetry
VF tests were performed with 24-2 Swedish interactive threshold algorithm standard of the Humphrey Field Analyzer 750 (Carl Zeiss Meditec, Inc, Dublin, California, USA). Reliability criteria for VF results were fixation loss of 33% or less, false-positive response of 20% or less, and false-negative response of 20% or less. These reliability criteria that were adopted for the full-threshold strategy may not be strict enough for the Swedish interactive threshold algorithm standard, but to the best of our knowledge, no published criteria exist for the Swedish interactive threshold algorithm standard. A glaucomatous VF defect was defined as glaucoma hemifield test results outside normal limits, a pattern standard deviation outside 95% of age-specific normal limits, or a mean deviation outside 95% of age-specific normal limits that is not attributable to other causes in an eye with a BCVA better than 20/25. The VF results were graded based on the scoring system adopted by the Advanced Glaucoma Intervention Study (AGIS). The eye with the lower AGIS score was selected if both eyes of 1 patient fulfilled all the inclusion criteria and none of the exclusion criteria. The AGIS scoring method requires larger depressions for peripheral locations to be considered defective than that for central locations, and it takes the distribution of retinal nerve fibers into consideration. Therefore, variations in AGIS score may reflect differences in the severity of glaucomatous optic neuropathy better than variations in mean deviation.
VF sensitivity was expressed in 2 ways: exact visual sensitivity in decibel units (raw thresholds) and 1/Lambert (L) scale. At each test point, the differential light sensitivity is measured in dB as 10 × log 10 [L max /(L t − L b )], where L max is the maximal stimulus luminance, L t is the stimulus luminance at threshold, and L b is the stimulus luminance at background. Thus, the 1/L scale is proportional to 10 dB/10 , for simplicity. We used the 1/L scale to avoid the log transformation within the decibel scale.
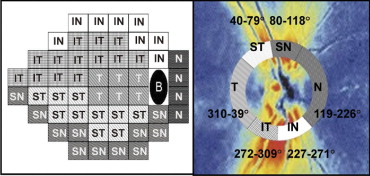
The mean sensitivity (MS) was obtained by averaging thresholds at each of the 52 test points to determine the global structure–function association. Garway-Heath and associates mapped the VF test points corresponding to 6 sectors of the optic disc ( Figure 1 ). The VF was divided into 6 sectors as defined by Reus and Lemij, which were based on Garway-Heath and associates’ optic disc VF map. Averaged thresholds from each sector were calculated for further structure–function comparisons of the 6 corresponding sectors.
Scanning Laser Polarimetry
The RNFL was evaluated with the GDx VCC system, software version 5.5.0, in patients with eyes undilated. The GDx VCC measures the summed retardation of a laser light beam that double passes the RNFL, and its working principles have been described in detail elsewhere. Images were included only if they were well focused, evenly illuminated, and with good centering. Scan images with a quality score of less than 7, with atypical birefringence pattern, or with vitreous degeneration affecting the ellipse and the peripapillary circle were excluded. An atypical birefringence pattern is defined as peripapillary high retardation arranged circumferentially or in a spokelike pattern, or splotchy areas of high retardation nasally and temporally. A medium-sized measurement circle, rather than a small-sized circle, centered on the optic disc with an inner diameter of 3.2 mm and an outer diameter of 4.0 mm was chosen for RNFL assessment because of higher prevalence of peripapillary atrophy and greater peripapillary atrophy-to-disc area ratio in POAG compared with those in PACG. The edge of the optic disc was defined automatically by the GDx machine as the inner margin of the peripapillary scleral ring, which was checked by a trained examiner and adjusted manually if inaccurately defined by the GDx algorithm. The resulting horizontal and vertical disc diameters as shown on the GDx printout were used for analysis.
The GDx VCC standard parameters, including temporal–superior–nasal–inferior–temporal (TSNIT) average, TSNIT standard deviation, and the nerve fiber index (NFI) were collected. The TSNIT average is equivalent to the average RNFL thickness along the measurement circle, and the TSNIT standard deviation is the standard deviation of RNFL measurements along the circle, and it captures the peak-to-trough difference in the RNFL thickness. The NFI is calculated using a support vector machine algorithm based on several RNFL measurements to differentiate optimally glaucoma from normal. The higher the NFI, the greater the likelihood the patient has glaucoma. The GDx VCC device also processed the RNFL thickness measurements for 64 regions along the circumpapillary measurement circle. The 64 peripapillary regions in the GDx VCC retardation image and the 52 VF test points subsequently were grouped into 6 corresponding sectors based on the previously published optic disc-VF map and named after the position of the sector in the GDx VCC image relative to the disc. Because of the fixed exported sectors in the GDx VCC measurements, the 6 optic nerve head sectors were modified slightly but still consistent with their relationship to the VF testing points. The 6 modified optic nerve head sectors were: temporal (310 to 39 degrees), superotemporal (ST; 40 to 79 degrees), superonasal (SN; 80 to 118 degrees), nasal (N; 119 to 226 degrees), inferonasal (IN; 227 to 271 degrees), and inferotemporal (IT; 272 to 309 degrees).
Statistical Analysis
Statistical analyses were performed with Stata statistical software (Stata Corp, College Station, Texas, USA). Because of the nonnormal distribution of the VF sensitivity data, the Spearman rank correlation coefficient ( r s ) was used to determine the correlation between VF MS and RNFL thickness for global measurements and for each of the 6 sectors. Bonferroni correction was used to control the overall type I error rate at 0.05 to account for multiple testing across sectors; that is, a P value < .0083 (0.05/6) was considered statistically significant for each sector. The differences in the correlations between the 2 groups were tested using the Fisher r-z transformation.
Multivariate median regression analysis, with VF sensitivity as the dependent variable, RNFL thickness as the independent variable, and age, sex, axial length, and optic disc diameters (as shown on the GDx VCC printout) as covariates subsequently was performed in the entire field and in each of the 6 sectors. We used median regression, instead of regular (i.e., mean-squared error loss) linear regression, to account for the nonnormality of our data. The coefficient of determination in the median regression, pseudo R 2 , was calculated to represent the proportion of variability in VF sensitivity that can be explained by a given regression model.
Stay updated, free articles. Join our Telegram channel

Full access? Get Clinical Tree


