Purpose
To estimate the 4-year incidence and progression of diabetic retinopathy, macular edema (ME) and clinically significant macular edema (CSME) among adult Latinos with diabetes mellitus.
Design
A population-based, longitudinal study of 4658 self-identified Latinos (primarily Mexican Americans), residing in Los Angeles, examined at baseline (2000–2003) and at 4 years (2004–2008).
Methods
Participants underwent a standardized ophthalmic examination. Diabetic retinopathy (DR) and CSME were detected by grading of stereoscopic fundus photographs using the modified Airlie House classification scheme. χ 2 and trend tests were used to assess differences in incidence when stratifying by age and duration of diabetes.
Results
The 4-year incidence of DR, ME, and CSME was 34.0% (182/535), 5.4% (38/699), and 7.2% (50/699) respectively. Younger persons and those with longer duration of diabetes mellitus had a higher incidence of DR compared to those who were older and had shorter duration of diabetes mellitus. A higher incidence of ME was associated with longer duration of diabetes mellitus ( P = .004). Worsening/progression of any DR was found in 38.9% (126/324) and improvement occurred in 14.0% (37/265) of participants. Progression from nonproliferative DR (NPDR) to proliferative DR (PDR) and from NPDR to PDR with high-risk characteristics occurred in 5.3% and 1.9% of participants.
Conclusions
The 4-year incidence and progression of DR and the incidence of ME and CSME among Latinos are high compared to non-Hispanic whites. These findings support the need to identify and modify risk factors associated with these long-term complications.
Latinos are the largest U.S. minority and the fastest-growing segment of the U.S. population. In the 2000 US Census, 12.5% of residents in this country, or 35 million people, were reported as Latino. This figure is expected to double by the year 2025. Latinos have unique demographic, socioeconomic, and ocular disease characteristics, and bear a disproportionate amount of eye disease burden compared to other racial and ethnic groups. With the aging of the U.S. population and growing numbers of U.S. Latinos, this burden is expected to increase over the next several decades.
While there are few population-based epidemiologic studies focusing on the incidence and progression of diabetic retinopathy (DR) and macular edema (ME) in Latinos, many previous studies have consistently reported that Latinos have a high prevalence of diabetes. Among those with diabetes, the prevalence of retinopathy ranges from 30% to 50% for DR and from 10% to 15% for ME. To date, only 1 other study has examined incidence of DR in a population-based sample of Latinos in the United States. The San Luis Valley study, 1984–1992, obtained estimates of the 4-year incidence of DR in Latinos. However, the study was limited by the small number of young Latinos included in its cohort.
The current investigation provided us with an opportunity to study incidence estimates of DR, ME, and clinically significant macular edema (CSME) among Latinos in the Los Angeles Latino Eye Study (LALES) cohort and to compare them to other population-based studies in non-Hispanic whites and Afro-Caribbean persons with diabetes mellitus. In addition to incidence and progression of DR and ME in the first eye, data from LALES have previously shown that bilateral visual impairment has more of an impact on a person’s health-related quality of life than does unilateral visual impairment. For this reason, obtaining incidence estimates of bilateral retinopathy and macular edema in a group of those who already have unilateral disease is important from a quality-of-life perspective. No previous epidemiologic studies on incidence and progression of DR or ME have reported the development of retinopathy and macular edema in the second eye.
Methods
Study Population and Design
The Los Angeles Latino Eye Study is a population-based cohort study of eye disease in self-identified Latinos aged 40 years and older living in 6 census tracts in the city of La Puente, Los Angeles County, California. The baseline clinical examination was performed from 2000 to 2003, and the 4-year follow-up examination was performed from 2004 to 2008. At baseline, 6357 participants completed an in-home questionnaire and a clinical ophthalmic examination. Details of the study design, methods, and baseline data have been reported elsewhere. The study protocol for this investigation was approved by the Institutional Review Board (IRB)/Ethics Committee at the University of Southern California and adhered to the recommendations of the Declaration of Helsinki. Written informed consent was obtained from all participants.
All living eligible participants (n = 6100) from the LALES baseline examination were invited to participate in a home interview and a clinical examination for this 4-year follow-up study. Similar questionnaire and examination procedures were used for both baseline and follow-up studies. Trained ophthalmologists and technicians performed a comprehensive ocular examination using standardized protocols.
Determination of Diabetes Mellitus
At baseline examination all participants were asked if they had previously received a diagnosis of diabetes mellitus and if they were following any treatment regimen, including oral hypoglycemic medications, insulin, or diet only. All participants were assessed for levels of random blood glucose and glycosylated hemoglobin (HbA1c) using the HemoCue B-glucose analyzer (HemoCue Inc, Lake Forest, California, USA) and the DCA 2000+ System (Bayer Corp, Tarrytown, New York, USA), respectively. Upon interview and clinical assessment, definite diabetes mellitus was diagnosed for participants who 1) had a history of diabetes and were following a treatment regimen, 2) had an HbA1c level ≥7.0%, or 3) had a random blood glucose level ≥200 mg%. Duration of diabetes mellitus was calculated as the difference between the year of diagnosis (self-reported by participant) and the year of the LALES baseline examination.
Grading of Photographs for Diabetic Retinopathy and Macular Edema
At both baseline and follow-up, participants with definite diabetes underwent 30-degree color stereoscopic fundus photography of 7 standard Early Treatment Diabetic Retinopathy Study (ETDRS) fields for each eye after maximal dilation. Masked graders at the Wisconsin Ocular Epidemiology Grading Center graded each fundus photograph for retinopathy and individual lesion severity levels using modifications of the ETDRS adaptation of the modified Airlie House classification of DR. Detailed description of all grading procedures and definitions has been previously presented. In brief, all 7 photographic fields were graded. Each eye was graded independent of the contralateral eye. Any discrepancies between the 2 initial graders were adjudicated by a senior grader using standardized edit rules. All data from the detailed grading were checked for progression or regression of DR lesions using a custom program. For eyes that showed changes in lesion severity by 2 or more steps between the baseline and 4-year follow-up examinations, a longitudinal review was conducted through side-by-side comparison of photographs from both examination periods. Graders were masked to the year the photographs were taken. Eyes with incident or progressed DR including ME were reviewed by a trained ophthalmologist (R.K.) for final confirmation.
Definitions of Diabetic Retinopathy
Diabetic retinopathy was classified by standards set forth in the ETDRS. Diabetic retinopathy was classified into severity levels, each corresponding to a specific clinical characteristic seen on a per-eye basis while grading the fundus photographs (for details, refer to Supplemental Table 1 , available at AJO.com ). The retinopathy level for each person was derived by concatenating the levels for the 2 eyes, giving the eye with the higher level greater weight (for details, refer to Supplemental Table 2 , available at AJO.com ). For concatenation purposes, levels 12 and 13 are grouped as level 10 and levels 14 and 15 are collapsed with level 20. No DR corresponds to step 1, minimal retinopathy corresponds to steps 2–3, mild nonproliferative DR (NPDR) corresponds to steps 4–7, moderate NPDR corresponds to steps 8–9, severe NPDR corresponds to steps 10–13, and proliferative DR (PDR) corresponds to steps 14–15.
Definitions of Macular Edema
The definitions of ME and CSME used by LALES were modeled after the definitions proposed in the Wisconsin Epidemiologic Study of Diabetic Retinopathy (WESDR) and ETDRS.
Macular Edema
An individual was considered to have ME (non-CSME) if at least 1 of 2 conditions were met: 1) there is thickening of the retina with or without partial loss of transparency within 1 disc diameter from the center of the macula, or 2) fundus photographs show focal photocoagulation scarring in the macula.
Clinically Significant Macular Edema
Individuals were considered to have CSME if at least 1 of 3 conditions were met: 1) there is retinal thickening at or within 500 μm from the center of the macula, or there are hard exudates within 500 μm of the center of the macula associated with thickening of the adjacent retina; 2) there is a zone or zones of retinal thickening, at least 1 disc area in size, at least part of which was 1 disc diameter from the center of the macula; or 3) there are signs of past focal photocoagulation treatment.
Describing Incidence and Progression
Incidence estimates for this study were calculated using 3 different approaches (for details, refer to Supplemental Table 3 , available at AJO.com ): 1) incidence in the first eye and required that both eyes be free of disease at baseline; 2) incidence of disease in the second eye and required that, at baseline, 1 eye be free of disease while the contralateral eye have disease; 3) combined incidence in the first eye with incidence in the second eye to obtain incidence in either eye.
Incidence of Diabetic Retinopathy
Individuals were considered at risk for incidence of DR if participants were at step 1 (level 10/10) at baseline. Individuals were considered to have DR if they had no retinopathy at baseline (step1: level 10/10) and developed a retinopathy level of 20/<20 (step 2) or higher at the time of the follow-up examination. Individuals were considered to have DR in the first eye if 1 or both eyes developed retinopathy at follow-up. Individuals were considered to have DR in the second eye if 1 eye developed retinopathy at follow-up and the contralateral eye had evidence of DR at baseline.
Incidence of Macular Edema
Individuals were at risk for incidence of ME (non-CSME) if they were free of any ME at baseline and had no evidence of past focal photocoagulation treatment. Individuals were considered to have ME if evidence of ME (as defined above) was present at follow-up.
Incidence of Clinically Significant Macular Edema
Individuals at risk for CSME were free of ME and showed no evidence of focal photocoagulation at baseline.
Progression of any diabetic retinopathy (2-step increase)
Progression of DR required that individuals have a step score of at least 20/<20 (step 2) at baseline and that they had progressed 2 steps or more at the follow-up examination (for details, refer to Supplemental Table 4 , available at AJO.com ). Likewise, individuals who were at 60+/<60 and 60+/60+ (steps 14 and 15, respectively) at baseline were not at risk for progression, since they were incapable of worsening by 2 steps or more. Similarly, persons classified as step 1 (10/10), with no DR at baseline, were not at risk for progression of disease.
Progression of Nonproliferative Diabetic Retinopathy to Proliferative Diabetic Retinopathy
Progression from NPDR to PDR required that individuals be grouped into steps 2–13 (20/<20, 20/20, 31/<31, 31/31, 37/<37, 37/37, 43/<43, 43/43, 47/<47, 47/47, 53/<53, and 53/53) at baseline. If persons progressed to steps 14 (≥60/<60) or 15 (≥60/≥60) at follow-up, they were classified as having progressed from NPDR to PDR.
Progression of Nonproliferative Diabetic Retinopathy to Proliferative Diabetic Retinopathy with High-Risk Characteristics
Progression from NPDR to PDR with high-risk characteristics (HRC) required that individuals with NPDR (levels 53/53 or less; steps 2–13) at baseline progress to levels 71 or worse (presence of high-risk characteristics) at follow-up.
Improvement of Diabetic Retinopathy
Improvement of diabetic retinopathy required that individuals who were at steps 3 to 15 (20/20 to 60+/60+) at baseline improve by 2 or more steps at follow-up.
Data and Statistical Analysis
All clinical and grading data were entered into a central database with internal automated quality control checks. Incidence and progression of disease were dichotomized into yes/no categories. Comparisons were made between gender, age, and duration of diabetes groups. Age at baseline examination was categorized into 4 groups (40–49 years, 50–59 years, 60–69 years, 70–79 years) for all analysis. Duration of diabetes was defined at baseline and categorized into 5 groups (0 years, 1–4 years, 5–9 years, 10–14 years, 15+ years). The at-risk cohort for incidence excluded participants who were not diagnosed with the particular outcome at baseline examination. Conversely, the at-risk cohort for progression included those who were diagnosed with disease at baseline examination. χ 2 tests were used to detect gender differences, and tests for trend were used to detect linear trends in age and duration of diabetes across the predefined strata. Incidence data from LALES was compared with other population-based incidence studies using annualized percentages. The Statistical Analysis System, version 9 (SAS Institute, Cary, North Carolina, USA) was used for tabulations and statistical analysis. All tests were done at a significance level of 0.05.
Results
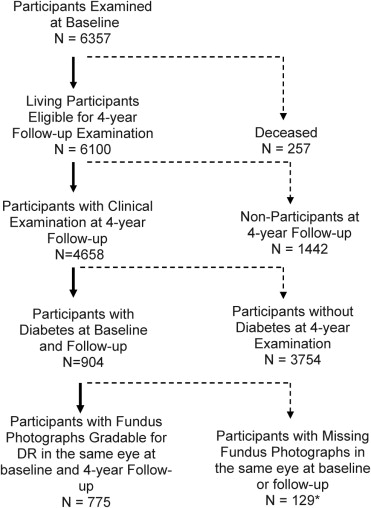
Of the 6357 participants examined at baseline, 6100 living eligible participants were identified for the 4-year follow-up study, and 4658 (76%) completed the follow-up examination. Of these, 904 had definite diabetes at baseline (of which 69 of 904 [7.6%] were newly diagnosed, and 835 of 904 [92.4%] were previously diagnosed), and 775 had gradable fundus photographs in the same eye at baseline and at follow-up; hence this is the cohort used for the analyses in this paper. Compared to those not included in this analysis (n = 129), participants included in this analysis (n = 775) were slightly older (58 ± 9.7 vs 56 ± 10.9 years, P < .05), more likely to report having a good-excellent visual health status (39% vs 28%, P < .05), and were more likely to have health insurance (72% vs 59%, P < .05). There were no other significant differences in baseline characteristics between the analysis cohort (n = 775) and those who did not have gradable photographs at baseline and follow-up (n = 129). A flowchart for assessing the analytical cohort is presented in the Figure . Of the 775 diabetic participants with gradable photographs at baseline and at follow-up, 404 diabetics were at risk of developing any retinopathy, 647 were at risk of developing macular edema, and 324 diabetics with DR at baseline were at risk for progression of DR.
4-Year Incidence of Diabetic Retinopathy and Macular Edema
Incidence in the First Eye
Diabetic retinopathy in the first eye ( Table 1 ) was observed in 28.2% of the diabetic participants. Age-specific incidence ranged from 37.5% in the 40-to-49-year age group to 23.5% in the 70-or-more-year age group. There was an overall inverse relationship between age and DR incidence ( P = .01), with age group 40–49 having the highest incidence. There was a significant increase in incidence of DR with increasing duration of diabetes ( P = .001), increasing from 17.3% in the newly diagnosed to 41.9% in diabetics with 15 or more years duration.
| Baseline Characteristics | Incidence in 1st Eye a | Incidence in 2nd Eye b | Incidence in Either Eye c | |||
|---|---|---|---|---|---|---|
| n | % (95% CI) | N | % (95% CI) | n | % (95% CI) | |
| Age (years) | ||||||
| 40–49 | 96 | 37.5 (27.8, 47.2) | 25 | 76.0 (59.3, 92.7) | 121 | 45.5 (36.6, 54.3) |
| 50–59 | 146 | 30.1 (22.7, 37.6) | 53 | 64.2 (51.2, 77.1) | 199 | 39.2 (32.4, 46.0) |
| 60–69 | 111 | 19.8 (12.4, 27.2) | 30 | 30.0 (13.6, 46.4) | 141 | 22.0 (15.2, 28.8) |
| 70+ | 51 | 23.5 (11.9, 35.2) | 23 | 26.1 (8.1, 44.0) | 74 | 24.3 (14.6, 34.1) |
| P = .01 | P < .001 | P < .001 | ||||
| Overall | 404 | 28.2 (23.8, 32.6) | 131 | 51.9 (43.4, 60.5) | 535 | 34.0 (30.0, 38.0) |
| Age-standardized d | 30.0 (24.5, 35.6) | 57.4 (43.8, 71.1) | 36.4 (31.1, 41.7) | |||
| Duration of diabetes (years) | ||||||
| New e | 139 | 17.3 (11.0, 23.6) | 28 | 35.7 (18.0, 53.5) | 167 | 20.4 (14.3, 26.5) |
| 1–4 | 124 | 27.4 (19.6, 35.3) | 34 | 58.8 (42.3, 75.4) | 158 | 34.2 (26.8, 41.6) |
| 5–9 | 67 | 31.3 (20.2, 42.5) | 31 | 58.1 (40.7, 75.4) | 98 | 39.8 (30.1, 49.5) |
| 10–14 | 43 | 51.2 (36.2, 66.1) | 26 | 61.5 (42.8, 80.2) | 69 | 55.1 (43.3, 66.8) |
| ≥15 | 31 | 41.9 (24.6, 59.3) | 12 | 33.3 (6.7, 60.0) | 43 | 39.5 (24.9, 54.2) |
| P < .001 | P = .51 | P < .001 | ||||
| Overall | 404 | 28.2 (23.8, 32.6) | 131 | 51.9 (43.4, 60.5) | 535 | 34.0 (30.0, 38.0) |
a At-risk cohort for incidence in the 1st eye: Both eyes did not have evidence of any diabetic retinopathy at baseline (severity level 10/10) and were at risk of developing DR in either or both eyes at follow-up (severity level >20/≤20 or >20/>20).
b At-risk cohort for incidence in 2nd eye: Only 1 eye, which did not have evidence of any DR at baseline (severity level 10), was at risk of developing DR at follow-up. The contralateral eye had some evidence of DR at baseline (severity level >20), or was ungradable.
c The at-risk cohort for incidence in either eye combines columns 1 (both eyes at risk) and 2 (1 eye at risk) to determine incidence of any DR in either eye.
d Age-standardized to the LALES population.
e Refers to persons who were newly diagnosed with diabetes at the time of baseline examination.
Incidence for ME (without CSME) in the first eye was 5.0% ( Table 2 ). No age-related association was observed ( P = .34). However, there was a significant increasing trend in incidence with increasing duration of diabetes ( P = .004). Duration-specific incidence ranged from 3.0% for new cases of diabetes to 11.9% for persons with 15 or more years of diabetes. Incidence in the first eye for CSME was 6.3% ( Table 3 ). Incidence did not significantly increase with age ( P = .35), but there was a significant positive association between duration of diabetes and CSME ( P = .01) ( Table 3 ). Duration-specific incidence of CSME ranged from 1.8% for newly diagnosed cases of diabetes to 6.0% for persons who had had diabetes for 15 or more years.
| Baseline Characteristics | Incidence in 1st Eye a | Incidence in 2nd Eye b | Incidence in Either Eye c | |||
|---|---|---|---|---|---|---|
| n | % (95% CI) | N | % (95% CI) | n | % (95% CI) | |
| Age (years) | ||||||
| 40–49 | 151 | 6.6 (2.7, 10.6) | 8 | 37.5 (4.0, 71.1) | 159 | 8.2 (3.9, 12.4) |
| 50–59 | 242 | 5.4 (2.5, 8.2) | 21 | 9.5 (0.0, 22.1) | 263 | 5.7 (2.9, 8.5) |
| 60–69 | 174 | 2.3 (0.1, 4.5) | 10 | — f | 184 | 2.2 (0.1, 4.3) |
| 70+ | 80 | 6.3 (1.0, 11.6) | 13 | 7.7 (0.0, 22.2) | 93 | 6.5 (1.5, 11.4) |
| P = .34 | P = .07 | P = .14 | ||||
| Overall | 647 | 5.0 (3.3, 6.6) | 52 | 11.5 (2.9, 20.2) | 699 | 5.4 (3.8, 7.1) |
| Age-standardized d | 5.3 (3.5, 7.1) | 17.8 (3.6, 32.0) | 6.0 (4.1, 7.9) | |||
| Duration of diabetes (years) | ||||||
| New e | 166 | 3.0 (0.4, 5.6) | 11 | — f | 177 | 2.8 (0.4, 5.3) |
| 1–4 | 168 | 4.2 (1.1, 7.2) | 8 | 25.0 (0.0, 55.0) | 176 | 5.1 (1.9, 8.4) |
| 5–9 | 130 | 2.3 (0.0, 4.9) | 10 | 10.0 (0.0, 28.6) | 140 | 2.9 (0.1, 5.6) |
| 10–14 | 99 | 7.1 (2.0, 12.1) | 8 | 25.0 (0.0, 55.0) | 107 | 8.4 (3.2, 13.7) |
| ≥15 | 84 | 11.9 (5.0, 18.8) | 15 | 6.7 (0.0, 19.3) | 99 | 11.1 (4.9, 17.3) |
| P = .004 | P = .76 | P = .003 | ||||
| Overall | 647 | 5.0 (3.3, 6.6) | 52 | 11.5 (2.9, 20.2) | 699 | 5.4 (3.8, 7.1) |
a At-risk cohort for incidence in the 1st eye: Both eyes did not have evidence of any macular edema (ME) and had not been previously treated with focal photocoagulation at baseline and were at risk of developing lesions characteristic of ME but not clinically significant macular edema (CSME) in either or both eyes at follow-up.
b At-risk cohort for incidence in the 2nd eye: Only 1 eye, which did not have any evidence of ME and had not been previously treated with focal photocoagulation at baseline, was at risk of developing lesions characteristic of ME but not CSME at follow-up. The contralateral eye had some evidence of ME, had been previously treated with focal photocoagulation at baseline, or was ungradable.
c The at-risk cohort for incidence in either eye combines columns 1 (no ME in both eyes) and 2 (no ME in 1 eye) to determine incidence of ME without CSME in either eye.
d Age-standardized to the LALES population.
e Refers to persons who were newly diagnosed with diabetes at the time of baseline examination.
| Baseline Characteristics | Incidence in 1st Eye a | Incidence in 2nd Eye b | Incidence in Either Eye c | |||
|---|---|---|---|---|---|---|
| n | % (95% CI) | N | % (95% CI) | n | % (95% CI) | |
| Age (years) | ||||||
| 40–49 | 151 | 6.6 (2.7, 10.6) | 8 | 25.0 (0.0, 55.0) | 159 | 7.6 (3.4, 11.7) |
| 50–59 | 242 | 7.9 (4.5, 11.2) | 21 | 14.3 (0.0, 29.3) | 263 | 8.4 (5.0, 11.7) |
| 60–69 | 174 | 4.6 (1.5, 7.7) | 10 | 10.0 (0.0, 28.6) | 184 | 4.9 (1.8, 8.0) |
| 70–79 | 80 | 5.0 (0.2, 9.8) | 13 | 23.1 (0.1, 46.0) | 93 | 7.5 (2.2, 12.9) |
| P = .35 | P = .96 | P = .53 | ||||
| Overall | 647 | 6.3 (4.5, 8.2) | 52 | 17.3 (7.0, 27.6) | 699 | 7.2 (5.2, 9.1) |
| Age-standardized d | 6.4 (4.5, 8.4) | 18.3 (6.4, 30.3) | 7.3 (5.2, 9.3) | |||
| Duration of diabetes (years) | ||||||
| New e | 166 | 1.8 (0.0, 3.8) | 11 | 9.1 (0.0, 26.1) | 177 | 2.3 (0.1, 4.5) |
| 1–4 | 168 | 5.4 (2.0, 8.8) | 8 | — f | 176 | 5.1 (1.9, 8.4) |
| 5–9 | 130 | 10.0 (4.8, 15.2) | 10 | 30.0 (1.6, 58.4) | 140 | 11.4 (6.2, 16.7) |
| 10–14 | 99 | 11.1 (4.9, 17.3) | 8 | 12.5 (0.0, 35.4) | 107 | 11.2 (5.2, 17.2) |
| ≥15 | 84 | 6.0 (0.9, 11.0) | 15 | 26.7 (4.3, 49.1) | 99 | 9.1 (3.4, 14.8) |
| P = .01 | P = .17 | P = .002 | ||||
| Overall | 647 | 6.3 (4.5, 8.2) | 52 | 17.3 (7.0, 27.6) | 699 | 7.2 (5.2, 9.1) |
a At-risk cohort for incidence in the 1st eye: Both eyes did not have evidence of any macular edema (ME) and had not been previously treated with focal photocoagulation at baseline, and were at risk of developing lesions characteristic of clinically significant macular edema (CSME) or had been treated with focal and/or grid photocoagulation in either or both eyes by the time of the follow-up examination.
b At-risk cohort for incidence in the 2nd eye: Only 1 eye, which did not have evidence of any ME and had not been previously treated with photocoagulation at baseline, was at risk of developing lesions characteristic of CSME or had been treated with focal and/or grid photocoagulation in either or both eyes by the time of the follow-up examination. The contralateral eye had some evidence of CSME, had been previously treated with focal photocoagulation at baseline, or was ungradable.
c The at-risk cohort for incidence in either eye combines columns 1 (no ME or photocoagulation signs in both eyes) and 2 (no ME or without CSME in either eye).
d Age-standardized to the LALES population.
e Refers to persons who were newly diagnosed with diabetes at the time of baseline examination.
Incidence in the Second Eye
Incidence of DR in the second eye was higher than in the first eye (51.9% vs 28.2%, Table 1 ). Incidence of DR decreased with increasing age, from 76.0% (40–49 years) to 26.1% (70+ years) ( P < .001). No pattern was observed with duration of diabetes and incidence of DR ( P = .51). Incidence of ME in the second eye was 11.5%, double that observed in the first eye (5.0%, Table 2 ). Increasing age was marginally associated with ME ( P = .07), but longer duration of diabetes was not associated with ME ( P = .76). Clinically significant macular edema in the second eye was observed in 17.3% of participants ( Table 3 ). Age-specific estimates ranged from 25.0% to 23.1% for 40–49 years and 70+ years, respectively, with no significant pattern ( P = .96). Duration of diabetes was not associated with incidence in the second eye ( P = .17).
Incidence in Either Eye
The overall incidence of DR in either eye was 34.0% ( Table 1 ). Age-specific incidence of DR in this group decreased significantly with age ( P < .001). Incidence ranged from 45.5% in participants 40–49 years old to 24.3% in those 70 or more years old ( P < .001). Duration-specific incidence ranged from 20.4% (0 years) to 55.1% (10-14 years), then dropped to 39.5% in those who had had diabetes for 15 or more years ( P < .001). The overall incidence of ME in either eye was 5.4% ( Table 2 ). There was no trend in incidence across age groups ( P = .14). Incidence of ME increased with duration of diabetes from 2.8% (0 years) to 11.1% (15+ years) ( P = .003). Clinically significant macular edema in either eye was observed in 7.2% ( Table 3 ). Age-specific estimates were not significantly associated with CSME ( P = .53). Duration-specific incidence ranged from 2.3% (0 years) to 9.1% (15+ years) ( P = .002).
Incidence of Diabetic Retinopathy and Treatment
When we examined the association of DR with treatment for diabetes (results not shown), we found a significantly higher incidence of DR in people who received no treatment for diabetes (33.3%, 92/276) compared to those who received treatment (17.1%, 22/128) ( P = .008). Any treatment included insulin, pills, diet, natural remedy, and other treatments.
4-Year Progression and Improvement of Diabetic Retinopathy
Progression of any DR was noted in 38.9% of diabetics with DR at baseline ( Table 4 ). When results were stratified by age group, higher incidence of DR was observed in younger age groups. Incidence of DR ranged from 58.2% for those 40–49 years of age to 25.0% to those 70+ years of age ( P < .001). Duration of diabetes was not significantly associated with progression ( P = .17). Among diabetics with NPDR at baseline, 5.3% ( Table 4 ) had developed PDR at follow-up. Age-specific estimates ranged from 4.5% for those aged 40–49 to 4.2% for participants 70+ years. No significant pattern was found ( P = .61). Duration-specific estimates ranged from 2.8% for those with 0 years to 8.3% for those with 15+ years of diabetes ( P = .08). Progression of NPDR to PDR with high-risk characteristics occurred in 1.9% of diabetics ( Table 4 ). Age-specific and duration-specific estimates were too small to test for differences since some strata reported no progression.


