17
Speech Perception by Adults with Multichannel Cochlear Implants
Michael F. Dorman and Anthony J. Spahr
This chapter reviews the speech perception abilities of patients fit with the current generation of multichannel cochlear implants. It describes selected acoustic cues for speech perception; reviews errors in phonetic identification made by patients; describes the signal processing strategies that can encode the acoustic cues; reviews the levels of speech recognition achieved by normal-hearing subjects listening to speech processed by the signal processing strategies, focusing on the issue of how many channels of stimulation are necessary to transmit speech in quiet and in noise; describes the performance of average and above-average patients on tests of speech, voice, and music recognition; and compares patient performance with the potential level of performance that could be achieved if all of the information delivered to the electrode array were received by the patient.
♦ The Speech Signal
Division of Information in the Speech Signal
It is convenient to divide information in the speech signal into two categories. In one category is information that exists in the amplitude envelope of the signal. This information could be coded by stimulation delivered to a single electrode. In the other category is information about the identity of a sound that exists in the frequency domain above several hundred Hertz. This information must be coded by the place of stimulation provided by multiple, intracochlear electrodes.
Rosen (1992) divides information in the amplitude envelope into envelope cues, periodicity cues, and fine, temporal-structure cues. As shown in Fig. 17–1 (top), the very low-frequency envelope (2–50 Hz) of a signal can, but does not always, provide information about the number of word-sized units in the signal. The envelope, in the best case, can also provide information about the number of phoneme-sized elements in the signal (e.g., in “Sam”).
As shown in Fig. 17–2 the envelope of a signal can provide information about the manner of consonant articulation; that is, whether a signal is from the category stop consonant, semivowel, nasal, fricative, affricate, or vowel. In a vowel-consonant-vowel environment stop consonants (e.g., /d/ and /t/) are characterized by a period of silence in the signal. Semivowels and nasals (e.g., /l/ and /m/) are characterized by periodic energy greater than that for a stop but less than that for a vowel. The acoustic signature of fricatives (e.g., /s/ and /f/) is aperiodic energy or “noise.” For /s/ and “sh,” the level of the noise relative to the accompanying vowel can be 20 dB higher than for /f/ and “th.” In this instance, an envelope cue can provide partial information about place of articulation. Affricates (e.g., “ch”) are fricatives following a stop consonant and are characterized by a period of silence followed by a brief fricative noise with a rapid onset.
Periodicity cues provide information about the voicing status of a segment and about sentence intonation. As shown in Fig. 17–2, the acoustic realization of voice pitch is a series of high-amplitude modulations of the speech waveform. The interval between the peaks specifies the pitch period. Because voice pitch can vary over a large range (e.g., 80 Hz for a deep male voice and 300 Hz for a infant cry), the pitch period can vary, for these examples, between 12.5 milliseconds and 3.3 milliseconds. Voiced sounds, such as /d/, /l/, and /n/, are periodic. Voiceless sounds, such as /t/, /s/, and “ch,” are noise-excited and aperiodic. The voicing characteristic of stop consonants (e.g., /d/ versus /t/) in syllable-initial position is signaled by distinctive time/amplitude envelopes, related to differences in voice-onset time (VOT) and the presence or absence of aspiration before the onset of the vowel. The voicing status of fricatives is signaled by a different set of cues—the presence or absence of voicing during the production of the fricative noise [compared in Fig. 17–2, lines 1 and 2 (/ada/ vs. /ata/) and lines 4 and 5 /asa/ vs. /aza/].
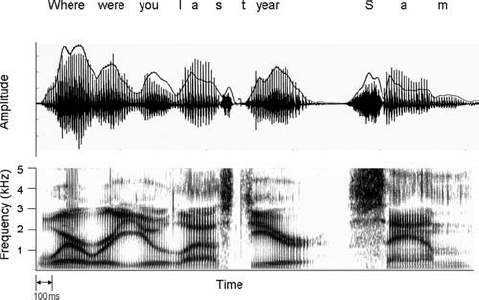
Figure 17–1 Two representations of the sentence, “Where were you last year, Sam?” At the top is the time waveform. The speech envelope is indicated by the solid black line. At the bottom is a spectrogram showing the frequencies that signal each of the phonetic elements in the sentence. Darkness specifies signal intensity.
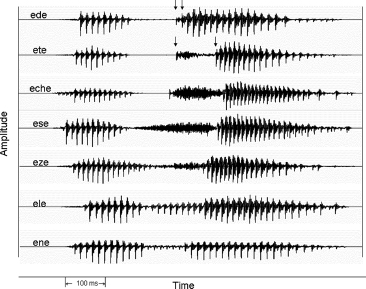
Figure 17–2 Amplitude envelopes for vowel-consonant-vowel syllables. For /ede/ and /ete/ the first arrow indicates the burst and the second arrow indicates the onset of voicing. The interval between arrows is the voice-onset time (VOT).
Fine, temporal structure cues, realized as the intervals between the low-amplitude fluctuations and between the high-amplitude voicing pulses in Fig. 17–2, could, for implant patients, provide information about signal frequency, at least in the domain of the first formant of the speech signal (e.g., 300 to 700 Hz for a male voice).
How might time/amplitude cues be useful to cochlear implant patients? Zue (1985) reports that if all the words in a 126,000-word vocabulary are defined in terms of six envelope/periodicity cues (vowel, strong fricative, weak fricative, nasal, semivowel, and stop), then for a given sequence of features only 2.4 words, on average, are possible word candidates. Thus, information in the time/amplitude envelope—information that could be conveyed by stimulation of a single electrode—could allow a listener to significantly restrict a set of possible word candidates.
If the correct word is to be identified from a set of possible word candidates, then information must be available from the frequency domain above several hundred hertz because the cues that specify place of articulation reside in that frequency domain. As shown in the spectrogram (Fig. 17–1, bottom) of the utterance, “Where were you last year, Sam?” speech is composed of frequencies that can range from ˜300 Hz, the first formant for /u/, to 4 to 5 kHz, the frequencies that signal the presence of “s” in “Sam.” The upper range of frequencies in female and children’s speech can be, for “s,” as high as 7 to 9 kHz.
Fig. 17–1 illustrates that, in the frequency domain, the sounds of speech are characterized by multiple concentrations of energy, or formants. To identify a vowel sound, an implant must be able to resolve, and then specify, where concentrations of energy occur in the frequency domain. The vowel “ou” in “you” is characterized by energy at 301 and 980 Hz. The vowel “a” in “last” has concentrations of energy at 592 and 1357 Hz. In the case of vowel sounds that are very similar, such as the vowels in “bit” and “bet,” an implant must be able to resolve, at the level of the input filters, differences in formant frequencies of 100 to 200 Hz. These differences in input frequency must then be encoded by the relative depth, or position, of an electrode in the cochlea, or by the pattern of activity among adjacent electrodes in the cochlea.
Because vocal tract shapes change nearly continuously during the production of speech, frequencies of the speech signal will change from moment to moment. For example, as shown in Fig. 17–1, the “y” in “you” is characterized by a falling second formant that changes in frequency over a period of ˜135 milliseconds. Other sounds change more quickly; for example, the formant frequencies in “b,” “d,” and “g” (not shown in Fig. 17–1) change over a period of 10 to 30 milliseconds. Thus, an implant must be able to resolve the frequency of multiple formants at a given moment in time and must be able to resolve rapid changes in formant frequencies over time. The duration of changes in formant transitions per se can be a cue to consonant manner as in the case of stops (10-to 30-millisecond duration) vs. semivowels (80-to 120-millisecond duration) (Liberman et al, 1956).
The stop consonant place of articulation is specified by the onset frequency and direction of change of brief, second, and third formant transitions and the frequency of the accompanying brief release burst (Cooper et al, 1952). Release bursts can differ in center frequency by as much as 2 kHz. The perceptual value of release bursts varies greatly with the vowel context in which the stop is articulated.
Semivowel—/wrlj/—place of articulation is signaled by changes in the second and third formant transitions (O’Connor et al, 1957). In /r/ vs. /l/ the third formant transition is of special importance. Formant duration is longer for semivowels than for stops.
Fricative place of articulation is specified by both the center frequency of the long-duration fricative noise and by the formant transitions that follow the noise (Harris, 1958). When the noise signatures are very different, as in /s/ and “sh,” then formant transitions play a relatively minor role in perception. When noise signatures are similar, as in the case of /f/ and “th,” then formant transitions (and amplitude envelope cues) play a major role in perception.
Implications for Signal Processor Design
Signal processors need to be able to encode information in both the envelope and in the frequency domain. If we assume, following Wilson (1997), that pulse rate in a implant signal processor must be four to five times the highest frequency to be transmitted, then pulse rates as low as 250 Hz would preserve envelope information. The relatively large differences in envelope shape across manner categories and stop voicing should make consonant manner of articulation and stop voicing relatively well identified by patients fit with modern cochlear implants.
If temporal fine structure cues in the domain of voice pitch are to be faithfully preserved, then pulse rates of 1 kHz (5 × 200 Hz) per channel may be necessary. If first formant frequencies are to be encoded by temporal, fine-structure information, then pulse rates of 2500 to 3500 pulses per second (pps) may be necessary.
Providing sufficient coding to resolve place of articulation, especially for minimal pairs such as the vowels in “bit” and “bet” or for stop consonant and nasal place of articulation, could require a large number of input filters and output channels. We should suppose that the more input filters and the more electrodes, the better an implant would function.
♦ Strategies to Transmit Speech via a Cochlear Implant
Rubinstein (see Chapter 4) and Wilson (2000, 2006) provide detailed accounts of current signal processing strategies for cochlear implants. (For other reviews of signal processing strategies see, for example, Brown et al, 2003; Clark, 2000; David et al, 2003; Loizou, 1998, 1999; Wilson, 2000, 2004; Wouters et al, 1998.)
Current strategies to transmit information in the speech signal to an implant patient are variants or combinations of two designs. In one strategy, the n-of-m strategy, the signal is divided into m channels, the n channels with the largest energy are determined, and the electrodes associated with those channels are stimulated. Wilson et al (1988) described this strategy in a generic form for cochlear implants, and it is implemented, or can be implemented, on most modern cochlear implants (Arndt et al, 1999; Kiefer et al, 2001; Lawson et al, 1996; McDermott et al, 1992; Vandali et al, 2000; Ziese et al, 2000). The n-of-m strategy is an excellent way to transmit speech because only the peaks in the spectrum, or the formant frequencies, are transmitted, and as the formant frequencies change so also do the electrodes being stimulated. The change in location of stimulation mimics the normal change in location of spectral peaks along the basilar membrane. Experiments with normal-hearing listeners dating to the late 1940s and early 1950s have shown that speech can be transmitted with a high level of intelligibility if only information about the location of the formant peaks is transmitted (see, for example, the first experiments on the pattern playback speech synthesizer by Cooper et al, 1950, and experiments on peak-picking vocoders by Peterson and Cooper, 1957, as cited in Flanagan, 1972).
The other strategy to transmit speech by means of an implant is to divide the signal into frequency bands or channels and to transmit information about the energy in all of the bands at each processor update cycle. This strategy (and its variants, see Battmer et al, 1999; Firszt, 2004; Kessler, 1999; Koch et al, 2004; Loizou et al, 2003; Osberger and Fisher, 2000; Wilson et al, 1991; Zimmerman-Phillips and Murad, 1999) can be termed a fixed-channel strategy, in contrast to a channel-picking, or n-of-m strategy. Experiments dating to Dudley (1939) have shown that normal-hearing individuals can achieve a high level of speech understanding when speech is transmitted by a relatively small number (7 to 10) of fixed channels (e.g., Halsey and Swaffield, 1948; Hill et al, 1968).
♦ The Potential of n-of-m and Fixed-Channel Signal-Coding Strategies
Several research groups have performed experiments in which speech signals were processed by n-of-m and fixed-channel strategies and were presented to normal-hearing listeners for identification. These experiments differed from the earlier experiments cited above (e.g., Halsey and Swaffield, 1948; Hill et al, 1968) in terms of the motivation for the experiments (the earlier experiments were designed to principally investigate sound quality for speech transmission systems) and in the details of the implementations of the signal processors (in the recent experiments signal processing has been based on cochlear-implant signal processors, instead of speech transmission systems). The experiments have proved to be useful on at least three grounds. First, by presenting signals acoustically to normal-hearing individuals, we can establish how well implant patients would perform if electrode arrays were able to reproduce, by artificial electrical stimulation, the stimulation produced by acoustic signals. These data can serve as a baseline to assess how near or how far away we are from re-creating, with artificial electrical stimulation, the stimulation provided by acoustic stimulation of the cochlea. Second, experiments with normal-hearing listeners allow factors, normally confounded in implant patients, to be examined in isolation. For example, it is difficult to assess the effects of depth of electrode insertion on speech understanding because in patients with deep insertions there may be no viable neural elements near the electrode, whereas in patients with shallow insertions there may be viable neural elements. Of course, patients differ in many other ways, all of which are uncontrollable in a given experiment. Third, the experiments indicate how many channels are necessary to achieve a high level of speech understanding for both n-of-m and fixed-channel systems, a question that is central to the design of cochlear implants.
Signal Processing
In experiments with fixed-channel processors, signals are first processed through a pre-emphasis filter (e.g., low-pass below 1200 Hz,–6 dB per octave) and then band-passed into m logarithmic frequency bands using, for example, sixth-order Butterworth filters. The envelope of the signal is extracted by full-wave rectification, and low-pass filtering (e.g., second-order Butterworth with a 400-Hz cutoff frequency). Two types of outputs have been used. In some experiments, sinusoids are generated with amplitudes equal to the root-mean-square (rms) energy of the envelopes (computed every 4 milliseconds, for example) and frequencies equal to the center frequencies of the bandpass filters. In other experiments noise bands the width of the input filters are generated. The sinusoids or noise bands are finally summed and presented to listeners at a comfortable level. Signal processing for n-of-m processors is similar, in broad measure, to that for fixed-channel processors. However, instead of outputting the signals in each m channel, an algorithm chooses the n channels with the highest energy and outputs those channels.
Before the data for normal-hearing listeners are described, it is important to note that the normal-hearing listeners in these experiments have had, most generally, only very limited experience listening to signals processed into channels. Thus, the levels of performance obtained by the listeners are a conservative estimate of the levels of performance they might achieve if they had not hours but years of experience with the signals (as do implant patients).
Recognition in Quiet with Fixed-Channel and n-of-m Processors
The number of channels necessary to reach maximum performance varies as a function of test material and signal processing strategy. For fixed-channel processors, Dorman et al (2002b) report that Hearing in Noise Test (HINT) sentences (Nilsson et al, 1994) could be identified with 90% accuracy using four channels of stimulation (see the pioneering study of Shannon et al, 1995; see also Dorman et al, 1997; Friesen et al, 2001). Consonants could be identified with greater than 90% accuracy with six channels of stimulation, and multitalker vowels required eight channels to reach 90% intelligibility. Dorman et al (2002a) report that between eight and 12 channels of stimulation are necessary to provide 90% intelligibility for monosyllabic words (see also Friesen et al, 2001). These results are reassuringly similar to those reported by researchers using different methods nearly a half century ago (e.g., Halsey and Swaffield, 1948).
For n-of-m processors, Dorman et al (2002a) report that a 3-of-20 processor allowed 90% correct recognition of vowels, consonants, and sentences. Dorman et al (2000) report that a 6-of-20 processor allowed a mean score of 90% correct for monosyllabic words. The results of these experiments are consistent with the much older literature on “peak-picking” channel vocoders (e.g., Peterson and Cooper, 1957) and demonstrate that a very high level of speech intelligibility can be achieved when picking only a small handful of high-amplitude channels from a set of 16 to 20 channels.
Recognition in Noise with Fixed-Channel and n-of-m Processors
The number of channels necessary to reach maximum performance in noise depends on the nature of the test material and the signal-to-noise ratio (Dorman et al, 1998, 2002a; Friesen et al, 2001; Fu et al, 1998). For example, 10 fixed channels allow 70% correct recognition of multitalker vowels at–2 dB signal-to-noise ratio (SNR); allow 70% correct recognition of consonants at +4 dB SNR; and allow 70% correct recognition of HINT sentences at 0 dB SNR (Dorman et al, 2002a). As the signal-to-noise level becomes poorer, the number of channels necessary to reach asymptotic performance increases. Dorman et al (1998) report that at +2 dB SNR, performance on sentences reached asymptote (85% correct) with 12 channels of stimulation. At–2 dB SNR, performance reached asymptote (63% correct) with 20 channels of stimulation. Results with n-of-m processors mirror the results for fixed-channel processors. Increasing the value of both m and n results in better performance (Kendall et al, 1997; Loizou et al, 2000). Dorman et al (2002a) report equal levels of performance (near 70% correct) for a 10 fixed-channel processor and a 9-of-20 processor when sentences were presented at 0 dB SNR.
One of the important findings from the literature reviewed above is that processors that allow scores equal to that of unprocessed speech in quiet do not allow scores equal to unprocessed speech in noise. For example, Fu et al (1998) report that a 16-band processor, which allowed scores similar to those for unprocessed speech in quiet, allowed much poorer scores than unprocessed speech at +12 to 0 dB SNR. Qin and Oxenham (2003) compared the speech reception threshold in noise for unprocessed speech and for speech processed through 4, 8, and 24 channels. Although the 24-channel processor provided near-normal resolution of formant peaks in quiet, the speech reception threshold for speech in noise was as much as 10 dB poorer than for unprocessed speech.
The poor performance of fixed-channel and channel-picking processors in noise can be exacerbated when the noise is a competing speech signal. In most real-world environments, noise changes over time, that is, the noise is temporally modulated. Normal-hearing subjects listening to speech in noise benefit from listening during “dips” in modulated noise (Bacon et al, 1998; Gustafsson and Arlinger, 1994). In contrast, normal-hearing subjects listening to speech coded into as many as 24 channels do not benefit from dips in a temporally modulated masker, especially if the masker is a single talker (Nelson and Jin, 2004; Qin and Oxenham, 2003; Stickney et al, 2004).
Summary
The studies reviewed above suggest that if cochlear implants could provide 12 channels of stimulation, then patients would enjoy near perfect recognition of speech in quiet. As few as four channels would allow a high level of performance for predictable sentences. This observation is critical because most conversations are relentlessly predictable. Predictability, in an important sense, allows the current generation of implants to be very effective for a very large number of patients. To understand a conversation in a level of noise commonly found in the workplace, an implant would need more channels—the number needed depends on the level and type of noise. Even a very large number of channels (e.g., 24) may fail to allow normal recognition of speech when the noise is temporally and spectrally modulated.
♦ Speech Recognition by Adult Cochlear-Implant Patients
In the previous section the potential of signal processing schemes for cochlear implants was documented. In this section the performance of postlingually deafened patients fit with cochlear implants is described.
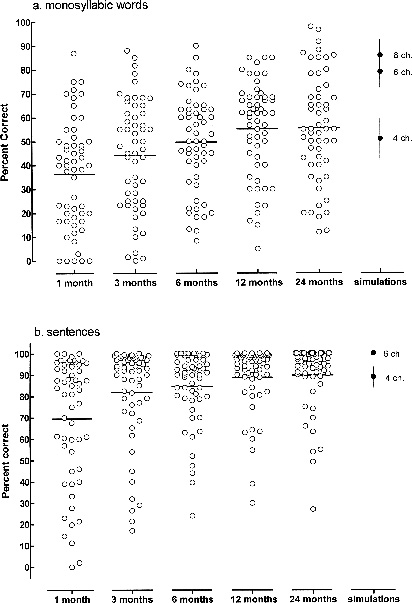
Fig. 17–3 shows monosyllabic word recognition and sentence recognition for 54 patients fit with an eight-channel cochlear implant. The data are a superset of the data reported by Helms et al (1997) and are replotted from Wilson (2000, 2006). Observations were made of patient performance at 1, 3, 6, 12, and 24 months postfitting. At most measurement intervals word scores ranged from near 0% correct to near 90% correct. Mean scores increased from 37% correct at 1 month to 55% at 12 months. The mean score at 24 months did not differ from the mean score at 12 months. The number of patients with scores greater than 80% correct increased at the 24-month interval. For sentences, average performance was high (69% correct) following 1 month of experience. Performance was constrained by ceiling effects at subsequent test intervals. At 24 months the mean score was 90% correct.
The level of performance shown in Fig. 17–3 for an implant with eight electrodes appears to be representative of the performance allowed by devices with more electrodes and different processing schemes. Wilson (2006) reports similar mean scores, near 55% correct, on CNC words for patients fit with devices with eight to 16 fixed channels and for a device that employs channel-picking with 20 or more input channels (see David et al, 2003; Koch et al, 2004).
Performance of the “Average” Patient
A common yardstick for performance is the performance of the “average” patient. In Fig. 17–3, the average score following 12 to 24 months of implant use was near 55% correct on a test of monosyllabic word recognition. In Table 17–1, scores are shown for 20 average patients (mean CNC score = 58% correct) and 21 above-average patients (mean CNC score = 80% correct) on a battery of tests of speech, voice, and music recognition. The data were collected in the context of a comparative study of cochlear implant performance (Spahr and Dorman, 2004). In the average group, 12 patients used a device with a 16-channel, high-rate, continuous interleaved sampling (CIS) processor, and eight used an implant with a lower-rate, 12-channel CIS processor. In the above-average group, 12 patients used a 16-channel CIS processor and nine used a 12-channel CIS processor.
The mean age of the patients in the average group was 58 years. The patients had been profoundly deaf for an average period of 18 years before implantation. Scores on the clearly articulated City University of New York (CUNY) sentences (Boothroyd et al, 1985) were at the ceiling (97% correct) of performance. The sentence data in Fig. 17–3 show a similar outcome for an unselected set of patients. Thus, the average implant patient, when listening to the average, predictable conversation in quiet, should be able to communicate with relative ease. However, scores from sentences that were spoken by multiple talkers in a more normal, casual speaking style (the AzBio sentences) averaged only 70% correct. This outcome suggests more difficulty understanding speech in quiet than suggested from experiments using the CUNY or HINT sentences. At +10 dB SNR, performance on the CUNY sentences fell to 70% correct. At +10 dB SNR performance on the AzBio sentences fell to 42% correct. At +5 dB SNR, a common level in many work environments, performance on the AzBio sentences was only 27% correct. The difference in performance for casually spoken sentences in quiet and in noise (43%) highlights the difficulty faced by the average implant patient when attempting to understand speech presented against a background of noise.
To assess the recognition of voice pitch/voice quality, subjects were presented with pairs of words produced by the same talker or different talkers. The words in the pairs always differed, for example, “ball” from one talker and “brush” from the other talker. When one talker was male and the other female, patients were highly accurate (mean score = 93% correct) in judgments of same or different speaker. However, when both speakers were the same gender, performance was only slightly better than chance (65% correct).
To assess the recognition of melodies, each subject selected five familiar melodies from a list of 33 melodies. Each melody consisted of 16 equal-duration notes and was synthesized with MIDI software that used samples of a grand piano. The frequencies of the notes ranged from 277 to 622 Hz. The melodies were created without distinctive rhythmic information. Patient performance on this very simple task was very poor (33% correct).