Purpose
To determine the intrasession repeatability of spectral-domain OCT (SDOCT)-derived macular retinal and choroidal metrics in patients with neovascular age-related macular degeneration (nAMD) in the Distance of Choroid Study (DOCS).
Design
Validity and reliability analysis.
Methods
Enrolled patients underwent repeated SDOCT imaging using the Spectralis OCT (Heidelberg Engineering, Heidelberg, Germany). A single technician certified for clinical trials took 3 macular volume scans. Retinal thicknesses were calculated for each of the 9 Early Treatment Diabetic Retinopathy Study (ETDRS) macular subfields. Center point thickness and total macular volume were also included in the analysis. Manual subfoveal choroidal thickness measurements were made by a masked observer.
Results
A total of 40 eyes of 40 patients were included in this analysis (mean [± standard deviation] age: 74.1 [± 7.2] years, 60% male). The coefficient of repeatability (CR) of the central macular subfield was 30.6 μm (95% confidence interval [CI] 29.8–1.4 μm). The CR for the other macular subfields ranged from 7.0 μm to 38.2 μm. The CR for the total macular volume was 0.212 mm 3 (95% CI 0.206–0.217 mm 3 ) and the CR for the center point was 47.5 μm (95% CI 46.2–48.7 μm). Images were also reviewed for the presence of segmentation error in the central macular subfield, and after exclusion of these eyes the revised CR for this subfield was 13.7 μm (95% CI 13.3–14.1 μm). The intrasession CR of subfoveal choroidal thickness was 34.7 μm (95% CI 33.7–35.7 μm).
Conclusions
This study suggests that a change of greater than 31 μm in Spectralis SDOCT–derived retinal thickness measurement of the central macular subfield and 35 μm in subfoveal choroidal thickness is necessary to detect true clinical change associated with disease progression or improvement in nAMD with a revised figure of 14 μm for central macular retinal subfield thickness in the absence of segmentation error.
Optical coherence tomography (OCT) imaging is well established as an essential tool in the assessment of patients with macular diseases. This rapid, noninvasive imaging modality uses light to generate 3-dimensional images of macular structure based on the optical reflectivity of the tissue being studied. Recent improvements in OCT imaging have led to advances both in image acquisition and in image analysis to derive macular thickness measurements. The shift from time-domain OCT (TDOCT) to spectral-domain OCT (SDOCT) has delivered faster imaging, enabling more macular tissue to be imaged, and has permitted line scan averaging techniques leading to an improvement in the signal-to-noise ratio in images. The latest commercially available SDOCT devices also have new on-board software algorithms, which are able to derive retinal thickness values by automated identification of inner and outer retinal boundaries. Enhanced depth imaging OCT (EDI-OCT) enables visualization of deeper structures including the choroid, which in turn permits measurements of choroidal thickness. The Spectralis OCT (Heidelberg Engineering, Heidelberg, Germany) has features that may lead to enhanced repeatability of macular thickness measurements, including increased signal-to-noise ratio in images using real time and multiple B-scan averaging, potentially improving the accuracy and precision of inner and outer retinal boundary detection. This imaging system also has eye-tracking capability, permitting registration of serial images, potentially improving the repeatability of measurements.
Change in macular thickness is one of the criteria used to assess disease progression and the need for anti–vascular endothelial growth factor (anti-VEGF) injections in clinical trials and in clinical practice. Although changes in macular thickness may result from true clinical change, increases or decreases in thickness may alternatively reflect measurement variability. It is therefore vital to determine the repeatability of macular thickness measurements in eyes with neovascular age-related macular degeneration (nAMD) in order to distinguish measurement variability from true clinical change. Furthermore, estimates of macular thickness repeatability differ between normal eyes and those with macular disease. This is particularly important in eyes with nAMD, because choroidal neovascularization (CNV) often disrupts the organized structure of the retinal pigment epithelium (RPE), leading to potential errors in automated outer retinal boundary detection, with the potential therefore to reduce the accuracy and precision of macular thickness measurements.
The ability to visualize the choroid using OCT imaging has led to novel observations that changes in choroidal thickness may be associated with macular conditions including age-related choroidopathy and pachychoroid. Abnormality of choroidal circulation has been implicated in the development and severity of nAMD. Analysis of subfoveal choroidal thickness (SFCT) using EDI-OCT has revealed significant differences in choroidal thickness compared with age-matched controls. Furthermore, choroidal thickness measurements have been investigated as a possible baseline predictor of treatment response with antiangiogenic agents in nAMD. Several studies in nAMD have described variation in OCT-derived choroidal thickness measurements in response to treatment with antiangiogenic agents. There is therefore promise in the use of EDI-OCT choroidal thickness measurements as a possible marker of disease activity in nAMD, but this requires a thorough understanding of the measurement variability of choroidal thickness in nAMD.
Although there have been reports of the repeatability of macular thickness in normal eyes using SDOCT, to the best of our knowledge there have been no previous studies evaluating the repeatability of macular and choroidal thickness metrics in eyes with nAMD using the Spectralis OCT. The aim of this work was to estimate the repeatability of macular thickness metrics (both retinal and choroidal thickness) in eyes with nAMD using the Spectralis OCT.
Methods
This study analysis formed part of the Distance of Choroid Study (DOCS). This was a prospective cross-sectional study assessing the repeatability of thickness measurements of the posterior coat of the eye (sclera, choroid, and retina) in eyes with nAMD using a range of imaging modalities. All subjects provided informed written consent prior to study inclusion. The study was approved by the local research ethics committee (NRES Committee South East Coast–Surrey) and adhered to the tenets set forth in the Declaration of Helsinki.
Study Population
All subjects were identified from medical retina clinics at Moorfields Eye Hospital, London, United Kingdom. Subjects were considered eligible for the study if they were aged between 50 and 90 years and had evidence of subfoveal nAMD in at least 1 eye. If both eyes were potentially eligible, the worse-seeing eye was included in this study. In addition, the subject had to have had the ability to understand the nature of the study and to undergo the imaging tests (ocular ultrasound and OCT imaging).
Exclusion criteria included other causes of CNV, media opacity precluding an adequate fundus view, previous ocular surgery (other than cataract surgery), and other significant ocular comorbidity in the study eye. Patients with diabetes mellitus were also excluded from this study.
Spectral-domain Optical Coherence Tomography Imaging Protocol
After informed consent, the best-corrected visual acuity (BCVA) and medical history were noted from the patient record. Each patient underwent 3 consecutive Spectralis SDOCT scans in a single imaging session completed by a single clinical trials–certified technician. All SDOCT imaging was undertaken using a Spectralis OCT device (Heidelberg Engineering) that had been regularly serviced by manufacturer-authorized personnel. All subjects had pupil dilation prior to imaging using 2.5% phenylephrine hydrochloride and 1% tropicamide eye drops.
SDOCT imaging consisted of 3 macular volume scans centered on the fovea. The subject was allowed to sit back from the SDOCT device in between scans and the first scan was set as the baseline image. Each image consisted of a volume scan of 25-line horizontal line scans (512 A-scans per B scan) that covered 20 × 20 degrees centered on the macula using the automated retinal thickness: high speed (ART:HS) mode in enhanced depth imaging (EDI) mode. The successive scans were completed in follow-up mode by the technician, with the first Spectralis scan set as a reference image and the second and third images acquired with real-time image registration. Patients sat back from the device between each scan and rested for a minimum of 1 minute between each of the 3 scan sets.
Analyses of Macular and Choroidal Thickness
Retinal thickness measurements of the 9 ETDRS (Early Treatment Diabetic Retinopathy Study) macular subfields, center point thickness, and total macular volume were calculated using the on-board segmentation algorithm (Version 3.1; Heidelberg Engineering). The 9 macular sectoral subfields are of 1 mm (central A1), 3 mm (inner A2–A5), and 6 mm (outer A6–A9) diameter centered on the fovea.
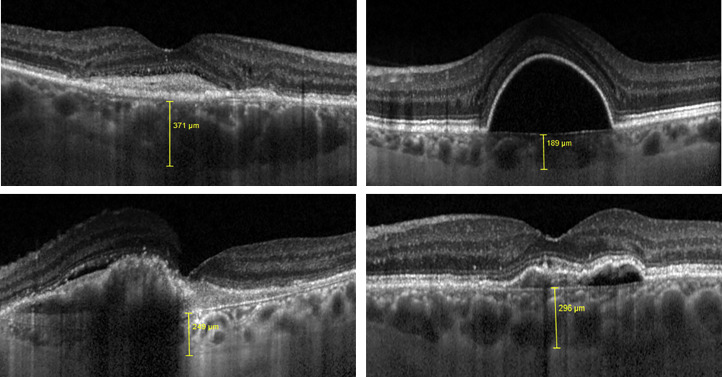
A masked observer performed manual SFCT thickness measurements. Measurements of SFCT on each EDI-OCT image were made using calipers within the proprietary software by measuring the distance between the outer surface of the Bruch membrane (or could be extrapolated during RPE detachment) to the outer choroidal surface ( Figure 1 ).
Manual Assessment of Segmentation Error
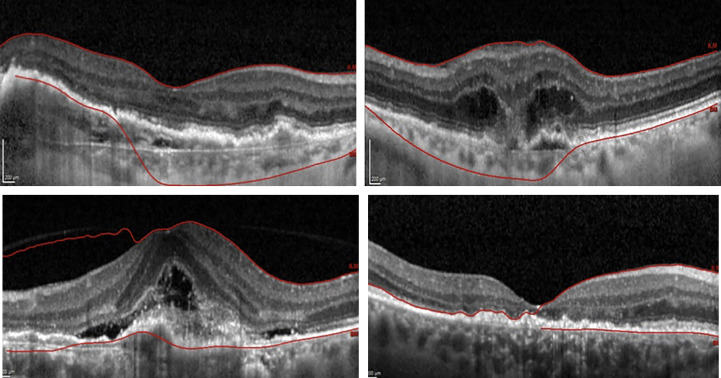
The on-board segmentation algorithm automatically defines the inner retinal boundary as the inner limiting membrane and the outer retinal boundary as the underside of the RPE/Bruch membrane complex. OCT images were visualized manually for the incidence of segmentation error (detection of instances in which the automated retinal boundary clearly deviated from the true anatomic inner or outer retinal boundary to an alternative hyperreflective interface over an area of 1 mm or greater of horizontally scanned retina; Figure 2 ). Patients were excluded if segmentation error of more than 1 mm was present in the central macular subfield (A1) in any of the 3 OCT images taken.
Statistical Analyses
Mean and standard deviation (SD) for macular subfield thicknesses, SFCT, center point thickness, and total macular volume were calculated using Microsoft Excel for Mac 2011 (Version 14.4.7; Microsoft Corporation, Redmond, Washington, USA). Repeatability was assessed using methods as described by Bland and Altman. Briefly, the standard deviation of each measure (eg, central macular thickness) was plotted against the mean of the 3 measurements to determine and exclude any relationship between variability and magnitude of the measure. The intrasubject standard deviation (S w ) was then calculated and the coefficient of repeatability (CR) was then calculated as 2x <SPAN role=presentation tabIndex=0 id=MathJax-Element-1-Frame class=MathJax style="POSITION: relative" data-mathml='√(2×Sw)’>√(2×Sw)√(2×Sw)
√ ( 2 × S w )
or 2.77 × S w . The width of the 95% confidence interval (CI) was 1.96 × S w /√ <SPAN role=presentation tabIndex=0 id=MathJax-Element-2-Frame class=MathJax style="POSITION: relative" data-mathml='2n(m−1)’>2n(m−1)2n(m−1)
2 n ( m − 1 )
, where n = number of subjects and m = the number of repeated images, as described in previously completed analyses of CR in OCT measurements. These analyses were carried out for each variable to deliver the intrasession CR (macular thickness subfields 1–9, center point thickness, and macular volume). Analyses of the repeatability of SFCT measurements were undertaken. The intrasession repeatability was determined by calculating the CR of the manual SFCT on 3 repeated images on all 39 eyes made by the observer.
Stay updated, free articles. Join our Telegram channel

Full access? Get Clinical Tree


