Purpose
To provide a review of commercially available spectral-domain optical coherence tomography (SD OCT) systems in clinical ophthalmology.
Design
Perspective.
Methods
Review of current manufacturer information, selected articles from the literature, and the authors’ clinical experience.
Results
Because the premise of SD OCT technology is the nonproprietary mathematical formula of Fourier transformation, 9 different SD OCT systems currently are or soon will be commercially available. Also demonstrated are Cirrus en face C-scan visualization of photoreceptor attenuation resulting from acute zonal occult outer retinopathy and Spectral OCT/scanning laser ophthalmoscopy microperimetric analysis of a macular caldera lesion resulting from North Carolina macular dystrophy.
Conclusions
Advances in high-resolution imaging of the anterior and posterior segment have revealed new in vivo details of anatomic, physiologic, and pathologic data for the practice of ophthalmology. Compared with time-domain OCT, SD OCT tends to derive increased retinal thickness and decreased nerve fiber layer thickness measurements. This is likely because of increased depth of resolution and greater volume of data acquired with each scan. Interdevice comparison is not practical because of differences in individual segment boundary algorithms. Improvements in photoreceptor inner segment–outer segment layer visualization should aid our understanding of visual dysfunction in a variety of retinal pathologic features. As the technology develops, SD OCT will continue to provide new insights about ocular structure and disease.
Optical coherence tomography (OCT) was introduced in 1991 as a noninvasive in vivo ophthalmic imaging technique and made the routine measurement of retinal thickness possible. In 2002, the time-domain OCT 3000 (Stratus OCT; Carl Zeiss Meditec, Dublin, California, USA) became available with an axial resolution of 10 μm and a scan velocity of 400 axial scans per second. It is the current gold standard for posterior segment retinal tomography. Since 2004, higher-resolution spectral-domain OCT (SD OCT) has entered clinical practice with reported resolutions of 1 to 5 μm as well as improved visualization of retinal morphologic and pathologic features.
SD OCT technology uses low-coherence interferometry to detect light echoes, relying on a spectrometer and high-speed camera and based on the mathematical premise of Fourier transformation. This eponym derives from the French mathematician Joseph Fourier, who described the decomposition of a periodic function into a sum of simple sinusoidal-based oscillating functions; interestingly, he is also credited for being the first scientist to describe the greenhouse gas effect. Because application of his formula has the effect of measuring all echoes of light simultaneously, as compared with sequentially in the case of time-domain OCT, SD OCT significantly increases the amount of data acquired in each session, resulting in a significant reduction of motion artifacts and an increased signal-to-noise ratio compared with time-domain OCT. Less interpolation between scans is required, making volumetric analysis and 3-dimensional (3D) imaging possible. Increased amounts of data allow image registration, which aids in improved visit-to-visit measurement reproducibility. Furthermore, several of the SD OCT devices incorporate overlay software that permits correlation of OCT images with photographic, angiographic, autofluorescent, and other studies. Because the basic premise of this technology is based on the Fourier mathematical formula rather than patented proprietary instrumentation, as is the case with time-domain OCT, 9 different posterior segment SD OCT systems are currently (or will be) commercially available ( Table ), as well as numerous reports from separate groups who have designed customized SD OCT devices and software. Although each device relies on the same underlying technology, the companies behind each commercial system have strived to identify their product as unique and as a worthwhile investment to improve data acquisition in clinical and research settings. This emerging technology has not come cheaply: the cost for each device ranges between $60 000 and 120 000, although it may be higher, depending on service options, software packages, and maintenance plans. It is also important to understand that the Food and Drug Administration (FDA) has granted approval (or approval is pending) for use of these devices as an aid in the detection and management of ocular diseases. Although certain devices have received approval for anterior segment imaging and measurement, currently no SD OCT device is FDA approved for quantification of any posterior structure or finding. This is a review of commercially available SD OCT systems, based on current manufacturer information, peer-reviewed publications, and expert opinion.
| System (Company) | Axial Resolution (μm) | A-Scans per Second | Advanced Features a |
|---|---|---|---|
| Cirrus HD-OCT (Carl Zeiss Meditec) | 5 | 27 000 | Fixation-independent scan adjustment; multilayer en face C-scan visualization; high-resolution anterior segment imaging |
| Spectralis (Heidelberg Engineering) | 7 | 40 000 | Point-to-point registration with eye tracking; Up to 6 diagnostic methods in 1 platform; digital resolution to 3.5 μm; improved choroidal visualization |
| RTVue-100 (Optovue) | 5 | 26 000 | 12-mm long macular scans can be overlapped; Point-to-point registration with eye tracking; drusen analysis and Doppler blood flow characterization; high-resolution anterior segment imaging |
| 3D-OCT 1000 | 6 | 18 000 | Nonmydriatic camera provides color fundus photographs |
| 3D-OCT 2000 b (Topcon) | Capable of exportation to common multimedia devices; able to import time-domain Stratus OCT images | ||
| Spectral OCT/SLO (OPKO/OTI) | 5 | 27 000 | Point-to-point registration with eye tracking; microperimetric macular analysis; high-resolution anterior segment imaging |
| SOCT Copernicus (Optopol) | 6 | 25 000 | Point-to-point registration with eye tracking; high-resolution anterior segment imaging; can separate and view all retinal layers; software allows intraretinal cyst volumetric analysis |
| SOCT Copernicus HR b (Canon/Optopol, Inc) | 3 | 50 000 | Highest resolution and fastest speed of available devices; multilingual interface; Doppler retinal blood flow analysis |
| SDOCT (Bioptigen) | 4 | 20 000 | Handheld head for pediatric patients or animal research; portability facilitates use in an operating room; Doppler retinal blood flow analysis |
| Retinascan RS-3000 b (Nidek) | 7 | 53 000 | Segmentation analysis of 6 distinct retinal layers |
a Based on a review of available data at the time this manuscript was prepared.
Cirrus HD-OCT and Visante
Cirrus OCT (Carl Zeiss Meditec) is an SD OCT platform that has a 5-μm axial resolution and scans at 27 000 A-scans per second. The system combines a small hardware footprint with advanced optics and a nonmydriatic camera. Device operation is facilitated by an on-screen iris viewer that allows mouse-driven alignment without the need for joystick control or much hardware movement, as is the case with its predecessor, the Stratus OCT. On-screen targeting software enables the operator to move the scan box within a 30 × 36-degree field of view without adjusting patient fixation. Although it does not have an actual tracking laser, the software uses a reconstituted image registration to scan over the same area when the same patient is followed up over time. Cirrus provides software analysis for both macular and optic nerve pathologic features ( Figure 1 ).
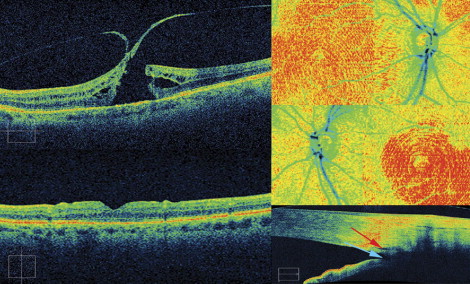
Users have the option of choosing a 512 × 128 macular cube, consisting of 128 horizontal scan lines consisting of 512 A-scans; a 200 × 200 macular cube, consisting of 200 horizontal scan lines comprising 200 A-scans, both 6 × 6 mm; or a 5-line raster, consisting of 4096 A-scans per 6-mm B-scan. There is also a 200 × 200 optic disc scan that can be used for optic nerve and retinal nerve fiber layer (NFL) analysis. In addition to average retinal thickness of 9 zones, including a 1-mm central zone, the Cirrus macula readout provides macular volume and average macular thickness, which reflect the 3D structure of the retina. A segmentation layer editing tool helps refine analysis results by allowing manual correction of segmentation errors and alignment artifacts, which have been reported to occur with the Stratus OCT software. This may be of particular importance at centers where clinical trials are carried out. Specific retinal layers can also be extracted and examined, and the selection of B-scans to be printed is customizable. This may aid identification and monitoring of specific disease details, such as choroidal striations in acute-stage Vogt-Koyanagi-Harada disease, resolution of a diffuse unilateral subacute neuroretinitis-associated subretinal nematode after laser photocoagulation, and bilateral accumulation of solid material in the retinal pigment epithelium (RPE) in early Best disease, despite normal electrooculography results. The development of single-station review allows side-by-side viewing of Stratus and Cirrus OCT results, although the measurements are not identical. Because of segmentation differences, namely the inclusion of the region from the photoreceptor inner segment–outer segment (IS/OS) junction to the RPE, Cirrus measures subfield thickness 43 to 61 μm greater that Stratus. However, the 2 OCT instruments cannot be used interchangeably for the measurement of macular thickness or volume. Although one report found a consistent Pearson correlation (0.92) between devices in healthy eyes, studies by our group and others reported highly variable correlation in eyes with retinal pathologic features. The current software for Cirrus does allow side-by-side viewing and macular change analysis over several consecutive examinations to highlight changes, for example, after an intravitreal injection of an anti–vascular endothelial growth factor agent. The current software also includes a unique pigmented epithelial detachment mapping program for following up patients with large deposits of drusen.
For glaucoma and optic nerve studies, an optic disc registration algorithm attempts to center the 1.73-mm radius NFL temporal-superior-nasal-inferior-temporal circle on the disc automatically. A deviation map, overlaid on an OCT fundus image, illustrates where the NFL thickness deviates from a normative database of approximately 300 patients. Preclinical studies provided by Carl Zeiss Meditec demonstrated no significant intervisit variance and excellent repeatability in healthy volunteers (data on file, copyright 2008, Carl Zeiss Meditec). A summary tool allows tracking of NFL changes over time, with coefficient of variation and age-matched control analysis.
In a recent article, average NFL thickness as determined by Cirrus and Stratus was correlated (Pearson r = 0.94; P < .001), but was significantly lower with Cirrus (Stratus, 98.0 ± 18.0 μm; Cirrus, 85.6 ± 14.6 μm; P < .001). This might have been the result of different signal strengths, image segmentation algorithms, or scan acquisition, registration, data processing, and analysis software. Additionally, Cirrus classified a significantly higher percentage of NFL scans as abnormal (Stratus, 12.9%; Cirrus, 23.3%; P < .001) and demonstrated higher sensitivity and specificity (63.6% and 100%, respectively) than Stratus OCT (40.0% and 96.7%, respectively) based on each of their normative databanks of average NFL thicknesses. Although SD OCT is promising for the early detection of glaucoma, intramachine differences preclude direct comparison of NFL measurements between Cirrus and Stratus OCT.
A unique aspect of the Cirrus software is the ability to visualize specific layers of interest in an en face C-scan area overview, for example, the IS/OS junction–RPE layer, which effectively may allow 2-dimensional or 3D visualization of the photoreceptors in healthy eyes and photoreceptor attenuation in certain pathologic features. Although individual layer en face segmentation is a function of several systems, we have been able to demonstrate specific en face IS/OS boundary attenuation in a patient with acute zonal occult outer retinopathy using the Cirrus system (Kiernan et al, unpublished data, 2009; Figure 1 ). As SD OCT technology evolves, evaluation of the IS/OS junction likely will become one of the most important parts of OCT image analysis, especially as it relates to potential visual function in a variety of ocular pathologic features. One report described a statistically significant negative correlation (γ = 0.58; 95% confidence interval, 0.36 to 0.72; P < .01) between visual acuity and the area of photoreceptor defect, observed on the C-scan, although calculated by measuring individual Cirrus horizontal and vertical scans, after macular hole surgery. This method of outer segment visualization will continue to be the subject of future investigations.
Visante OCT is a separate time-domain system that provides high-resolution (18-μm axial resolution and scans at 2048 A-scans per second) anterior segment and corneal imaging and pachymetry mapping without the need for ocular anesthesia or fluid immersion. It is FDA approved as a noncontact high-resolution tomographic and biomicroscopic device indicated for the in vivo imaging and measurement of ocular structures in the anterior segment. It has provided relevant data for a wide variety of clinical and research applications, including assessment of laser in situ keratomileusis flap morphologic features and residual corneal bed thickness in the immediate postoperative period, as well as evaluation of wound closure after oblique 23-gauge sutureless sclerotomy posterior segment surgery. Visante OCT may provide a reference point for future research involving newer spectral-domain systems that incorporate anterior segment imaging. Of note, it has been reported that the anterior chamber and angle structures, including the Schwalbe line and trabecular meshwork, can be visualized in most eyes using a 60-diopter aspheric lens mounted over the Cirrus SD OCT imaging aperture. A more standardized approach should be possible with the recent release and FDA approval of Cirrus version 4.0 for imaging and measuring anterior ocular structures, enabling high-quality SD OCT anterior segment acquisition and analysis ( Figure 1 ). This allows a 512 × 128 cube scan over 4 × 4-mm or a 5-line raster, which is 3 mm in length, with adjustable rotation and spacing. A distinguishing feature between the Visante and the Cirrus anterior segment capabilities is the ability of the Visante to demonstrate a limbus-to-limbus axial cross-section simultaneously, whereas the spectral-domain anterior segment OCT units can capture only 1 angle at a time without a limbus-to-limbus scan in 1 image.
Spectralis
Spectralis (Heidelberg Engineering, Vista, California, USA) combines a scanning laser ophthalmoscope (SLO) with OCT to produce tracking laser tomography that has a 7-μm axial resolution and scans at 40 000 A-scans per second. One beam constantly images and tracks the fundus and acts as a reference, guiding the second beam of light precisely to position the cross-sectional OCT scan. This real-time eye tracking enables a highly repeatable alignment of OCT and fundus images that can be displayed either in grayscale or false color and allows acquisition of 1 to 100 B-scans at the same location, facilitating removal of speckle noise artifact ( Figure 2 ). This scanning precision results in very high repeatability and reproducibility with a very small measurable change (1.5 μm) and coefficient of variation (COV; 0.53%). Despite the best resolution of any available device, the Spectralis comes at the cost of time: data-dense scans require additional software processing to provide noise and speckle reduction, adding time to both the acquisition and review of every scan, especially if 3D visualization is enabled. To balance scan time with the acquisition of sufficient data, patients usually undergo only a limited number of horizontal or vertical raster sections for macular examination. Customizable volume cube, variable lined raster, or adjustable 6-line star-shaped scan patterns can be used to acquire data, although higher scanning density proportionally increases acquisition time. There is also a circular scan available for optic nerve head and glaucoma analysis. However, because of FDA regulations regarding nonhazardous class 1 laser exposure, there is 300-second time limit on the maximum period of time for which the tracking laser can be turned on for a single patient. After this, the tracking laser is interrupted for a waiting period for that particular patient. Although the actual risk of a class 1 laser does not pose any known safety hazard, users should bear this mandatory time limit in mind when using the laser-based tracking mode, especially because larger volume scans that are more compact with greater detail require more acquisition time. It is possible to exceed the maximum time limit if several different studies (i.e., fundus autofluorescence, fluorescein angiography [FA] or indocyanine green angiography, and OCT) are all carried out in the same session, potentially limiting the application of the tracking technology. In our experience, this time limit does not impede patient flow in the clinical setting.
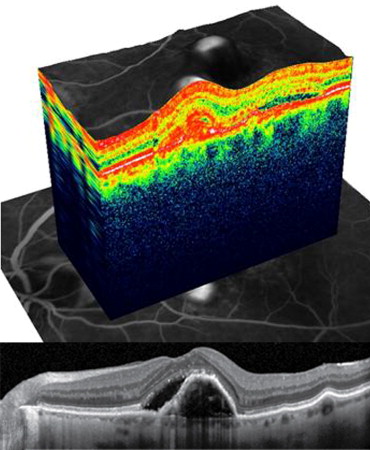
Normative macular thickness data are available for healthy patients. A prospective study gathering data from 50 healthy subjects, ranging in age from 20 to 84 years and of varied ethnicity, reported all Early Treatment Diabetic Retinopathy field thicknesses across 3 age stratifications. Mean central subfield thickness of all subjects was 270.2 ± 22.5 μm. There was no significant differences in retinal thickness corresponding with age or gender, although the retinal thickness of Asian (279.5 ± 27.4 μm) and white (272.7 ± 20.8 μm) subjects tended to be thicker than that of black subjects (256.5 ± 16.9 μm; P = .007).
Margolis and Spaide reported that choroidal thickness can be measured using Spectralis OCT with enhanced depth imaging, that is, by positioning the device close enough to the eye to acquire an inverted image within a 5- to 30-degree area centered at the fovea and then performing manual measurements from the outer border of the RPE to the inner scleral border. In 54 eyes with no significant observable ocular pathologic features, the subfoveal choroid was thickest (mean, 287 ± 76 μm) and grew thinner at more peripheral measurement points. Choroidal thickness demonstrated a negative correlation with age, decreasing approximately 16 μm per 10 years of life. In separate reports using the same technique, Spaide reported enhanced depth imaging of choroidal changes underneath a pigmented epithelial detachment in patients with exudative AMD, as well as describing a novel disease entity termed age-related chorioretinal atrophy .
The ability to visualize and quantify choroidal thickness is an intriguing area of ophthalmologic study that may be limited to SD OCT devices such as the Spectralis, which can overcome the technical limitations of imaging deeper structures such as analog-to-digital conversion, wavelength-dependent light scattering, and signal loss in the image path before Fourier transformation.
Up to 6 different acquisition modes (OCT, autofluorescence, red-free, infrared, FA, and indocyanine green angiography) are available, as well as wide-angle image acquisition (15 to 120 degrees, up to 150 degrees with a Staurenghi lens). Both the OCTPLUS (2 modes) and HRA (5 modes) are available separately, but can be upgraded to the HRA+OCT (6 modes) system. The anterior segment imaging mode also is a separate, upgradeable option. All of the Spectralis models also include NFL analysis software, although a normative NFL database currently is still being developed.
Spectralis
Spectralis (Heidelberg Engineering, Vista, California, USA) combines a scanning laser ophthalmoscope (SLO) with OCT to produce tracking laser tomography that has a 7-μm axial resolution and scans at 40 000 A-scans per second. One beam constantly images and tracks the fundus and acts as a reference, guiding the second beam of light precisely to position the cross-sectional OCT scan. This real-time eye tracking enables a highly repeatable alignment of OCT and fundus images that can be displayed either in grayscale or false color and allows acquisition of 1 to 100 B-scans at the same location, facilitating removal of speckle noise artifact ( Figure 2 ). This scanning precision results in very high repeatability and reproducibility with a very small measurable change (1.5 μm) and coefficient of variation (COV; 0.53%). Despite the best resolution of any available device, the Spectralis comes at the cost of time: data-dense scans require additional software processing to provide noise and speckle reduction, adding time to both the acquisition and review of every scan, especially if 3D visualization is enabled. To balance scan time with the acquisition of sufficient data, patients usually undergo only a limited number of horizontal or vertical raster sections for macular examination. Customizable volume cube, variable lined raster, or adjustable 6-line star-shaped scan patterns can be used to acquire data, although higher scanning density proportionally increases acquisition time. There is also a circular scan available for optic nerve head and glaucoma analysis. However, because of FDA regulations regarding nonhazardous class 1 laser exposure, there is 300-second time limit on the maximum period of time for which the tracking laser can be turned on for a single patient. After this, the tracking laser is interrupted for a waiting period for that particular patient. Although the actual risk of a class 1 laser does not pose any known safety hazard, users should bear this mandatory time limit in mind when using the laser-based tracking mode, especially because larger volume scans that are more compact with greater detail require more acquisition time. It is possible to exceed the maximum time limit if several different studies (i.e., fundus autofluorescence, fluorescein angiography [FA] or indocyanine green angiography, and OCT) are all carried out in the same session, potentially limiting the application of the tracking technology. In our experience, this time limit does not impede patient flow in the clinical setting.
Normative macular thickness data are available for healthy patients. A prospective study gathering data from 50 healthy subjects, ranging in age from 20 to 84 years and of varied ethnicity, reported all Early Treatment Diabetic Retinopathy field thicknesses across 3 age stratifications. Mean central subfield thickness of all subjects was 270.2 ± 22.5 μm. There was no significant differences in retinal thickness corresponding with age or gender, although the retinal thickness of Asian (279.5 ± 27.4 μm) and white (272.7 ± 20.8 μm) subjects tended to be thicker than that of black subjects (256.5 ± 16.9 μm; P = .007).
Margolis and Spaide reported that choroidal thickness can be measured using Spectralis OCT with enhanced depth imaging, that is, by positioning the device close enough to the eye to acquire an inverted image within a 5- to 30-degree area centered at the fovea and then performing manual measurements from the outer border of the RPE to the inner scleral border. In 54 eyes with no significant observable ocular pathologic features, the subfoveal choroid was thickest (mean, 287 ± 76 μm) and grew thinner at more peripheral measurement points. Choroidal thickness demonstrated a negative correlation with age, decreasing approximately 16 μm per 10 years of life. In separate reports using the same technique, Spaide reported enhanced depth imaging of choroidal changes underneath a pigmented epithelial detachment in patients with exudative AMD, as well as describing a novel disease entity termed age-related chorioretinal atrophy .
The ability to visualize and quantify choroidal thickness is an intriguing area of ophthalmologic study that may be limited to SD OCT devices such as the Spectralis, which can overcome the technical limitations of imaging deeper structures such as analog-to-digital conversion, wavelength-dependent light scattering, and signal loss in the image path before Fourier transformation.
Up to 6 different acquisition modes (OCT, autofluorescence, red-free, infrared, FA, and indocyanine green angiography) are available, as well as wide-angle image acquisition (15 to 120 degrees, up to 150 degrees with a Staurenghi lens). Both the OCTPLUS (2 modes) and HRA (5 modes) are available separately, but can be upgraded to the HRA+OCT (6 modes) system. The anterior segment imaging mode also is a separate, upgradeable option. All of the Spectralis models also include NFL analysis software, although a normative NFL database currently is still being developed.
Stay updated, free articles. Join our Telegram channel

Full access? Get Clinical Tree


