Purpose
To estimate the 6-year incidence of primary angle-closure (PAC) disease among adult population aged 40 years and older from rural and urban south India.
Design
Population-based longitudinal study.
Methods
A complete ophthalmologic examination, including applanation tonometry, gonioscopy, biometry, stereoscopic fundus examination, and automated perimetry was performed at both baseline and at the 6-year follow up at base hospital. Incident PAC disease was defined as the development of PAC disease during the 6-year follow-up in phakic subjects without PAC disease at baseline. Diagnosis was made using the International Society Geographical and Epidemiological Ophthalmology classification.
Results
The data were analyzed for 3350 subjects (mean age, 56.4 ± 8.9 years; 1547 males, 1803 females) for a diagnosis of PAC disease at baseline and at follow-up examinations. The incidence of PAC disease was identified in 134 subjects (6-year incidence rate, 4.0%; 95% confidence interval (CI), 3.3-4.7). Among the 134 subjects, 88 subjects (2.6%, 95% CI, 2.1-3.2) were primary angle-closure suspects; 37 subjects (1.1%, 95% CI, 0.7-1.5) had primary angle closure, and 9 subjects (0.3%, 95% CI, 0.1-0.4) had primary angle-closure glaucoma. There was an inverse relationship between the incidence of PAC disease and the cataract surgery rates. Significant risk factors for PAC disease on logistic regressions were higher intraocular pressure, increased lens thickness, shorter axial length, shallow anterior chamber depth, anteriorly positioned lens, and hyperopia.
Conclusions
The average incidence of PAC disease per year was 0.7%. All biometric parameters were found to be strong predictors for the incidence of PAC disease.
According to recent estimates, there are 60 million people with primary glaucoma. Of these, an estimated 11.2 million are likely to be from India. Population-based studies from Asia report that primary angle-closure glaucoma (PACG) contributes to a significant proportion of primary glaucoma. These studies showed that patients with PACG were more likely to present with blindness than those with primary open-angle glaucoma. Angle-closure glaucoma, therefore, is a public health problem in Asia, and various epidemiologic studies from the region have provided significant information about the prevalence of the disease and its risk factors. Information about the incidence of the disease is very limited. Incidence studies are valuable because they allow us to measure the true risk for developing new disease over a particular period of time. They also help in exploring associations between pre-existing factors at baseline and the development of the disease. We have reported the prevalence of PACG in a rural and in the urban cohort of southern India. In this article, we report the incidence of PACG derived from the 6-year follow-up examinations of the same population. We also report the risk factors associated with disease diagnosis.
Methods
The Chennai Glaucoma Study was a population-based study designed and conducted between 2001 and 2004 to gather information about the prevalence of glaucoma in rural and urban south India. The methodology and prevalence of the angle-closure disease were reported previously. In brief, the Chennai Glaucoma Study enumerated a cohort of 9600 subjects (rural:urban ratio 4800:4800) aged 40 years and older. Of them, 7774 participated in the study (rural:urban ratio 3924:3850). The study was extended as the Chennai Eye Disease Incidence Study (CEDIS) to find the incidence of eye disease in the same cohort 6 years after the baseline visit (between 2007 and 2010). Trained social workers re-enumerated the participants from both the rural and the urban study areas. Participants were invited to undergo a detailed examination at the hospital that was the study’s site. Written informed consent was obtained from all subjects who responded, and the study was performed in accordance with the tenets of the Declaration of Helsinki after approval from the Vision Research Foundation’s institutional review board. We re-examined surviving members of the cohort to determine the incidence and the progression of the eye diseases.
Clinical Examination
The examination protocol was similar to that followed for the baseline prevalence study. A detailed history pertaining to medical and ophthalmic problems was elicited. Any history of diabetes mellitus, hypertension or use of systemic or topical medication was recorded. Three ophthalmologists (glaucoma specialists) and three optometrists, who were trained for the study, performed the ophthalmic examinations. The optometrists tested visual acuity and refraction and visual fields and performed pachymetry, axial-length measurements and fundus photography; ophthalmologists carried out all other examinations.
The ophthalmic examination consisted of measuring the best-corrected visual acuity using logarithm of minimum angle of resolution (logMAR) 4-meter charts (Light House Low Vision Products, New York, NY, USA). The central corneal thickness was measured using the DGH 550 ultrasonic pachymeter (DGH Technology Inc, Exton, Pennsylvania, USA) prior to any contact procedure or pupillary dilation. External examination and pupillary evaluation were performed using a flashlight. Slit-lamp biomicroscopy was performed, and peripheral anterior chamber depth was graded according to the van Herick system. Intraocular pressure (IOP) was recorded using a Goldmann applanation tonometer (Zeiss AT 030 Applanation Tonometer, Carl Zeiss, Jena, Germany) under topical anesthesia using proparacaine 0.5% and fluorescein staining of the tear film. The right eye was measured first, and 2 measurements of IOP were taken per eye; if they differed by more than 2 mm Hg, a third measurement was taken. Gonioscopy was performed on all subjects in dim ambient illumination with a shortened slit that did not fall on the pupil. A 4-mirror Sussmann lens (Volk Optical Inc, Mentor, Ohio, USA) was used. The angle was graded according to the Shaffer system, and the peripheral iris contour, degree of trabecular meshwork pigmentation and other angle abnormalities were recorded. If all angle structures were not visible, indentation gonioscopy was performed to assess angle opening, and findings on indentation were recorded. Ocular biometry was performed using the Alcon ultrasonic biometer (Ocuscan, Alcon Laboratories Inc, Fort Worth, Texas, USA). The axial length (AL), anterior chamber depth (ACD) and lens thickness (LT) were measured. From these measurements, we calculated absolute lens position (ALP) and relative lens position. ALP was defined as ACD + (1/2LT) and relative lens position as ALP/AL. Laser iridotomy was performed in subjects with any form of primary-angle closure (PAC) disease after obtaining their consent.
All subjects with open angles on gonioscopy underwent pupillary dilation using 1% tropicamide and 5% phenylephrine. If phenylephrine was contraindicated, 1% homatropine was used. Subjects with PAC disease had dilation after laser iridotomy. The grading of lens opacification was done using the slit-lamp and the Lens Opacities Classification System II and III, with a minimum pupillary dilation of 6 mm. Lenticular opacities were graded by comparison with the standard set of photographs. Stereoscopic evaluation of the optic nerve head was performed using a + 78 diopter lens and the slit-lamp. The vertical and horizontal cup-to-disc ratios (CDRs) were measured and recorded. The presence of any notching, splinter hemorrhages or peripapillary atrophy was documented. A detailed retinal examination was performed using a binocular indirect ophthalmoscope and a + 20-diopter lens. All the subjects with PAC disease were advised to undergo threshold visual field testing using the Swedish Interactive Thresholding Algorithm (SITA) standard 24-2 program (Model 750, Humphrey Instruments, San Leandro, California, USA).
We also administered instruments for assessing the socioeconomic status, demographic and personal history (smoking and smokeless tobacco, alcohol consumption and diet). Body mass index (BMI) was calculated on the basis of the height and weight measurements of all participants.
Diagnostic Definitions
Glaucoma was defined according to the International Society Geographical and Epidemiologic Ophthalmology (ISGEO) classification. Glaucoma was classified according to 3 levels of evidence. In category 1, diagnosis was based on structural and functional evidence. It required CDR or CDR asymmetry equal to or greater than the 97.5th percentile for the normal population or a neuroretinal rim width reduced to 0.1 CDR (between 10 and 1 o’clock or 5 and 7 o’clock) with definite visual field defects consistent with glaucoma. Category 2 was based on advanced structural damage with unproven field loss. This included the subjects in whom visual fields could not be examined or were unreliable, with CDR or CDR asymmetry equal to or greater than the 99.5th percentile for the normal population. Last, category 3 consisted of persons with IOPs greater than the 99.5th percentile for the normal population and whose optic discs could not be examined because of media opacities.
The definitions of PAC disease were again based on definitions suggested by ISGEO, as follows : (1) primary-angle closure suspect (PACS): an eye in which the posterior trabecular meshwork was not seen for >180 degrees on gonioscopy; (2) PAC: an eye with PACS and peripheral anterior synechiae and/or elevated IOP without glaucomatous damage of the optic disc; (3) primary angle-closure glaucoma (PACG): PACS with evidence of glaucoma as defined by ISGEO.
Blindness was defined as a best corrected logMAR visual acuity of <2/40 (logMAR 1.3) and/or constriction of the visual field <10 degrees from fixation in the better eye. Hyperopia was defined as spherical equivalent greater than 0.50 diopters in a phakic eye. Diabetes mellitus and systemic hypertension were detected based on current use of antidiabetic or systemic antihypertensive medication. BMI was defined as weight in kilograms divided by the square of height in meters (kg/m 2 ). BMI categories were grouped as underweight (<18.5 kg/m 2 ); normal (18.5-25 kg/m 2 ); overweight (>25 kg/m 2 ); or obese (≥30.0 kg/m 2 ).
Statistical Analysis
All the collected data were entered into a central database and were rechecked for data-entry errors. The incidence of PAC disease was defined as the development of PAC disease during the follow-up in subjects without PAC disease at baseline. Statistical analysis was performed using SPSS v 15 (Cary, North Carolina, USA). Subjects were classified into 4 groups based on baseline age:–40-49 years, 50-59 years, 60-69 years, and 70 years and older. Comparison of variables between subjects with angle closure and controls was done using the t test for continuous variables and χ 2 test for categorical variables. Multivariate logistic regression was performed to analyze risk factors, such as age, sex, location of residence, IOP, biometric parameters, and BMI, for the incidence of angle-closure glaucoma after adjusting for age and sex. Statistical significance was assessed at P values less than 0.05 and odds for PAC disease were presented with 95% confidence interval (CI).
Results
The total number of subjects at the baseline prevalence study was 7774. Re-enumeration was possible for 6022 (rural:urban ratio, 3047:2975). Of these, 1752 (rural: urban ratio, 877:875) subjects could not be contacted in spite of 3 house visits, and 590 people were not alive. The number of eligible subjects was 5432; of them, 4421 (rural: urban ratio, 2510:1911) subjects were examined at the base hospital. The reasons for the nonparticipation were refusal (145, 2.7%); migration (804, 14.8%); and being bedridden (62, 1.1%). In comparison to participants, the nonparticipants were older (52.8 vs 56.4 years; P < 0.001); likely to be diabetic (11.6% vs 15.6%; P < 0.001); and having hypertension (13.3% vs 18.0%; P < 0.001). Nonparticipants had shallower anterior chamber depth by 0.05 mm and higher IOP by 0.32 mm Hg. Even though this difference was significant ( P < 0.001), it may not be clinically relevant. No difference was noted in axial length or lens thickness. Among the nonparticipants, 11% were operated on for cataracts, whereas 8% of participants underwent cataract surgery ( P < 0.001).
The response rate for this study was 81.3%. From the cohort of 4421, subjects with any form of angle-closure disease at the base line and subjects with bilateral aphakia or pseudophakia were excluded. For unilateral aphakia or pseudophakia, the fellow eye was included if it was still phakic. After the exclusions, the number of eligible subjects was 3350 (male:female ratio, 1547:1803; and rural:urban ratio, 1883:1467), and the mean age was 56.4 ± 8.9 years. There were more females than males in this study (male:female, rural, 869:1014; male:female, urban, 642:825). The baseline and follow-up characteristics are given in Table 1 .
| Parameter Studied | Complete Cohort (N = 7774) | Population Studied (N = 3350) | |
|---|---|---|---|
| Baseline | Follow-up at 6 years | ||
| Age (years) a (median) | 54.3 ± 10.6 (53) | 50.6 ± 8.9 (49) | 56.4 ± 8.9 (54) |
| Male:female (%) | 3472 (45.7): 4302 (53.4) | 1547 (46.2): 1803 (53.8) | 1547 (46.2): 1803 (53.8) |
| Rural:urban (%) | 3924 (50.5): 3850 (49.5) | 1883 (56.2):1467 (43.8) | 1883 (56.2): 1467 (43.8) |
| IOP (mm Hg) a (median) | 15.3 ± 4.3 (15) | 15.1 ± 3.7 (15) | 14.3± 3.7 (14) |
| VCDR a (median) | 0.4 ± 0.2 (0.4) | 0.4 ± 0.2 (0.4) | 0.4 ± 0.2 (0.4) |
| Axial length a (mm) (median) | 22.6 ± 0.9 (22.6) | 22.8 ± 0.9 (22.7) | 22.7 ± 0.9 (22.6) |
| Anterior chamber depth a (mm) (median) | 2.8 ± 0.4 (2.8) | 3.0 ± 0.3 (3.0) | 3.0 ± 0.3 (3.0) |
| Lens thickness a (mm) (median) | 4.4 ± 0.4 (4.4) | 4.4 ± 0.3 (4.3) | 4.5 ± 0.4 (4.5) |
| Absolute lens position a (mm) (median) | 5.0 ± 0.6 (5.0) | 5.1 ± 0.3 (5.1) | 5.2 ± 0.3 (5.2) |
| Relative lens position a (median) | 2.2 ± 0.2 (2.2) | 2.3 ± 0.1 (2.3) | 2.3 ± 0.1 (2.3) |
Table 2 provides details of the age- and gender-specific incidence of angle-closure disease. Of the subjects, 134 (male:female ratio, 62:72; rural:urban ratio, 82:52) were diagnosed with any form of PAC disease. The incidence was 4.0% (95% CI, 3.3-4.7; rural 2.5%, 95% CI, 1.8 to 3.2; urban 1.6%, 95% CI, 0.9-2.2). The incidence of the 3 subtypes of PAC disease was as follows: (1) PACS, 88 subjects (2.6%, 95% CI, 2.1-3.2; M:F, 36:52; rural:urban, 56:32); PAC, 37 subjects (1.1%, 95% CI, 0.7-1.5; M:F, 24:13; rural:urban, 21:16); and (3) PACG, 9 subjects (0.3%, 95% CI, 0.1-0.4; M:F, 2:7; rural:urban, 5:4). In the 9 subjects with PACG, the diagnosis was based on category 1 in 5 subjects, category 2 in 3 subjects, and category 3 in 1 subject. Three subjects had bilateral disease and none were blind. There was an inverse relationship between the incidence of PAC disease and the cataract surgery rates. ( Figure 1 ) The incidence of PAC disease peaked in the group 50 to 59 years of age and declined in those older than 60 years of age, whereas the cataract surgery rate increased exponentially after the age of 60 years.
| Age in years | Male | Female | Total | |||
|---|---|---|---|---|---|---|
| No. at Risk | No., Incidence (%) (95% CI) | No. at Risk | No., Incidence (%) (95% CI) | No at Risk | No., Incidence (%) (95% CI) | |
| 40-49 | 315 | 13, 4.1 (1.9-6.3) | 593 | 25, 4.2 (2.6-5.8) | 908 | 38, 4.2 (2.9-5.5) |
| 50-59 | 590 | 28, 4.8 (3.1-6.5) | 716 | 27, 3.8 (2.4-5.2) | 1306 | 55, 4.2 (3.1-5.3) |
| 60-69 | 400 | 14, 3.5 (1.7-5.3) | 377 | 13, 3.5 (1.6-5.4) | 777 | 27, 3.5 (2.2-4.8) |
| 70+ | 206 | 7, 3.4 (0.9-5.9) | 153 | 7, 4.6 (1.3-7.9) | 359 | 14, 3.9 (1.9-5.9) |
| Total | 1511 | 62, 4.1 (3.1-5.1) | 1839 | 72, 3.9 (3.0-4.8) | 3350 | 134, 4.0 (3.3-4.7) |
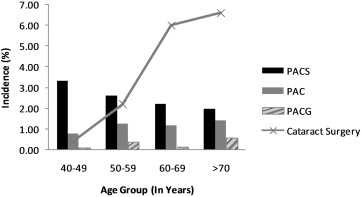
Table 3 provides a comparison of those with PAC disease with the rest of the cohort. After adjusting for age and sex ( Table 4 ), the significant risk factors for PAC disease on multiple logistic regressions were higher IOP, increased LT, shorter AL, shallow ACD, an anteriorly positioned lens, and hyperopia. We further analyzed these significant risk factors for PAC and PACG as 1 group and PACS as a separate group ( Table 5 ). In the PAC and PACG groups with biometric parameters, only axial length did not reach statistical significance, though there was a trend toward the shorter axial lengths. Hyperopia was not a risk factor for the PAC and PACG groups. In those with PACS, all biometric variables were associated with greater risk. Nuclear cataract was protective for development of PAC disease and PACS, but not for PAC and PACG. Figure 2 depicts the relationship between the actual 6-year incidence of PAC disease for various AL, ACD and LT measurements. The incidence of PAC disease increased dramatically in eyes shorter than 21 mm and in those with ACD less than 2.5 mm and lens thicknesses of more than 5.5 mm. The age- and sex-adjusted incidence of PAC disease in subjects 40 years of age and older in the Tamil Nadu population was 4.07% (95% CI, 4.0-4.1); it was 4.5% (95% CI, 4.5-4.6) in the rural population and 3.2% (95% CI, 3.1-3.2) in the urban population. Assuming a linear incidence of PAC disease, the annual incidence was 0.7%.
| Parameter Studied | Incident PAC Disease (n = 134) | No PAC Disease (n = 3216) | P value |
|---|---|---|---|
| Age a (years) | 55.9 ± 8.4 | 56.5 ± 8.9 | 0.45 |
| Male: Female (%) | 62 (46): 72 (54) | 1449 (45): 1767 (55) | 0.42 |
| IOP a (mm Hg) | 15.9 ± 4.1 | 14.2 ± 3.7 | <0.001 |
| Hyperopia | 55 | 983 | 0.008 |
| VCDR a | 0.4 ± 0.1 | 0.4 ± 0.2 | 0.28 |
| Axial length a (mm) | 22.3 ± 0.7 | 22.7 ± 0.9 | <0.001 |
| Anterior chamber depth a (mm) | 2.7 ± 0.3 | 3.0 ± 0.3 | <0.001 |
| Lens thickness a (mm) | 4.6 ± 0.4 | 4.5 ± 0.4 | <0.001 |
| Absolute lens position a (mm) | 5.1 ± 0.3 | 5.3 ± 0.3 | <0.001 |
| Relative lens position a | 2.2 ± 0.1 | 2.3 ± 0.1 | <0.001 |
| Nuclear cataract | |||
| No progression | 102 | 2066 | 0.001 |
| Progression | 32 | 1150 | |
| Body mass index (kg/m 2 ) | 22.0 ± 4.4 | 23.3 ± 13.2 | 0.29 |
| Parameter Studied | No. at Risk | Baseline OR (95% CI) | P value | No. at Risk | Follow-up OR (95% CI) | P value |
|---|---|---|---|---|---|---|
| Age (yrs) | ||||||
| 40-49 | 1740 | 1.00 | 908 | 1.00 | ||
| 50-59 | 960 | 0.9 (0.6-1.4) | 0.77 | 1306 | 1.0 (0.6-1.5) | 0.98 |
| 60-69 | 510 | 0.8 (0.5-1.4) | 0.44 | 777 | 0.8 (0.5-1.4) | 0.44 |
| 70+ | 140 | 0.5 (0.1-1.6) | 0.22 | 359 | 0.9 (0.5-1.7) | 0.80 |
| Male | 1511 | 1.00 | 1511 | 1.00 | ||
| Female | 1839 | 0.9 (0.7-1.3) | 0.66 | 1839 | 0.9 (0.7-1.4) | 0.88 |
| Urban | 1467 | 1.00 | 1467 | |||
| Rural | 1833 | 1.2 (0.9-1.8) | 0.26 | 1833 | 0.8 (0.6-1.2) | 0.25 |
| IOP | 3347 | 0.9 (0.9-1.0) | 0.54 | 3348 | 1.1 (1.0-1.1) | <0.001 |
| Axial length | 652 | 2.1 (1.2-3.6) | 0.007 | 3231 | 1.9 (1.5-2.5) | <0.001 |
| Anterior chamber depth | 652 | 18.2 (4.7-71.4) | <0.001 | 3231 | 14.9 (8.4-26.3) | <0.001 |
| Lens thickness | 652 | 6.9 (1.6-9.3) | 0.01 | 3231 | 4.5 (2.7-7.7) | <0.001 |
| Absolute lens position | 652 | 14.3 (3.3-∞) | <0.001 | 3231 | 12.5 (6.7-25) | <0.001 |
| Relative lens position | 652 | 33.3 (1.2-∞) | 0.03 | 3231 | 33.3 (10-100) | 0.03 |
| Nuclear cataract a | 3350 | 0.9 (0.5-1.5) | 0.68 | 3350 | 0.5 (0.3-0.8) | 0.005 |
| BMI (kg/m 2 ) | ||||||
| Normal | 903 | 1.00 | 1543 | 1.00 | ||
| Underweight | 203 | 1.2 (0.6-2.4) | 0.61 | 573 | 1.1 (0.7-1.7) | 0.77 |
| Overweight | 506 | 0.9 (0.5-1.5) | 0.71 | 711 | 0.8 (0.5-1.3) | 0.46 |
| Obese | 179 | 0.6 (0.2-1.6) | 0.29 | 225 | 0.5 (0.2-1.3) | 0.14 |
| Diabetes | ||||||
| Absent | 2919 | 1.00 | 2672 | 1.00 | ||
| Present | 426 | 0.7 (0.4-1.3) | 0.32 | 678 | 0.9 (0.6-1.4) | 0.69 |
| Hypertension | ||||||
| Absent | 2001 | 1.00 | 1882 | 1.00 | ||
| Present | 1344 | 0.9 (0.6-1.3) | 0.48 | 1468 | 0.9 (0.6-1.3) | 0.63 |
| Hyperopia | ||||||
| Absent | 2400 | 1.00 | 2312 | 1.00 | ||
| Present | 950 | 1.4 (1.0-2.1) | 0.06 | 1038 | 1.6 (1.1-2.3) | 0.01 |
Stay updated, free articles. Join our Telegram channel

Full access? Get Clinical Tree


