Purpose
To identify changes in short-wavelength automated perimetry patterns and parameters between the active and inactive states.
Design
Retrospective cohort study with age-matched, normal controls.
Methods
setting : Private tertiary referral center. study population : Seventy-five eyes of 38 patients with active birdshot retinochoroidopathy and 37 eyes of 37 historical normal controls. intervention : Thirty-seven patients received immunomodulatory therapy. A fluocinolone acetonide intravitreal implant (Retisert) was implanted in both eyes of 1 patient as an initial treatment. main outcome measures : Changes in short-wavelength automated perimetry total deviation scores, pattern deviation scores, mean deviation, and pattern standard deviation in the active phase and the remission state.
Results
Mean deviation ( P = .006), pattern standard deviation ( P = .001), total deviation score ( P = .002), and pattern deviation score ( P = .007) were significantly different from the active phase to the remission state. The length of time required to achieve remission did not significantly affect the changes in mean deviation (regression coefficient = 0.01; P = .92), pattern standard deviation (regression coefficient = 0.01; P = .87), total deviation score (regression coefficient = −0.1; P = .32), or pattern deviation score (regression coefficient = 0.1; P = .36) from the active phase to the remission state.
Conclusion
There was significant improvement in total deviation score, pattern deviation score, mean deviation, and pattern standard deviation on short-wavelength automated perimetry as patients achieved remission. Short-wavelength automated perimetry appears to be a useful and complementary modality in monitoring disease activity in birdshot retinochoroidopathy.
Birdshot retinochoroidopathy is an uncommon cause of posterior uveitis. It is characterized by multiple, distinctive, hypopigmented choroidal lesions and a chronic, progressive course of intraocular inflammation. It can affect the retina, choroid, and optic nerve. It has been reported to account for 0.6%–1.5% of patients referred to tertiary uveitis clinics and 6%–7.9% of patients with posterior uveitis. Typically, it affects peripheral vision more than central. As such, central vision is not a reliable marker for disease activity. Early diagnosis and appropriate treatment is important to halt the chronic, progressive loss of visual and retinal function.
Fluorescein angiography, indocyanine green angiography, electroretinography, and visual field testing have been found to be adjunctive methods to clinical examination for both diagnosis and disease monitoring. Visual field defects, some reversible with treatment, have been described in patients with birdshot retinochoroidopathy. However, visual field analysis is not consistently included in reports on birdshot retinochoroidopathy. Of the available reports on visual field testing in patients with birdshot retinochoroidopathy, the method and frequency of testing has been varied.
It has been our experience that Swedish interactive threshold algorithm short-wavelength automated perimetry (SITA-SWAP) visual field testing is more sensitive than standard automated perimetry. This additional sensitivity may be due to the increased incidence of color vision abnormalities (predominantly in the blue-yellow spectrum) found in birdshot retinochoroidopathy patients. We decided to analyze the SITA-SWAP patterns and parameters of our birdshot retinochoroidopathy patients both at baseline during the active state and after achieving remission. Our primary outcome was to identify changes in SITA-SWAP pattern scores and parameters between the active phase and remission state.
Methods
This was a single-center, retrospective cohort study with age-matched, normal controls. Patients were diagnosed with active birdshot retinochoroidopathy and were treated at Massachusetts Eye Research and Surgery Institution between January 2006 and January 2015. Approval for this study was obtained through the New England Institutional Review Board, which issued a waiver of informed consent based on standard operating procedures for retrospective chart reviews. This study was performed in accordance with the Declaration of Helsinki and was HIPAA compliant.
We included all patients with a clinical diagnosis of birdshot retinochoroidopathy with active disease at their first visit who, following treatment, subsequently achieved a remission of at least 6 months’ duration. At the initial visit, each patient had an extensive serologic evaluation to rule out other infectious and noninfectious causes of posterior uveitis. Human leukocyte antigen (HLA) analysis was performed for each patient. Fluorescein angiography, indocyanine green angiography, electroretinography, and SITA-SWAP testing were performed for every patient at baseline and every 6 months during the follow-up period. Active birdshot retinochoroidopathy was defined as a symptomatic patient with clinical evidence of bilateral low-grade anterior chamber reaction, low-grade vitritis, and characteristic fundus lesions in addition to characteristic hypofluorescent spots, vascular or optic nerve staining on fluorescein angiography, hypolucent spots on indocyanine green angiography, and a decrease in amplitude or an increase in implicit time on the 30-Hz flicker electroretinography. Remission was defined as a patient who was subjectively asymptomatic (allowing for stable floaters) with no clinical signs of intraocular inflammation, stable or improved findings on indocyanine green angiography, stable or improved 30-Hz flicker electroretinography amplitude and implicit time, and no signs of vascular or optic nerve inflammation on fluorescein angiography.
To avoid confounders in visual field parameters, we had strict exclusion criteria. We excluded patients with corneal opacity, significant cataract, and glaucoma. We also excluded patients with significant coexisting optic nerve, macular, or peripheral retinal disorders. We excluded those with systemic problems that might affect the retina and optic nerve, such as diabetes and hypertension. Finally, we excluded patients with unreliable visual fields. A visual field was defined as reliable when fixation losses were less than 33% and false-negative errors and false-positive errors were each less than 20%.
We collected demographic information including age, sex, and race for each patient. We also collected best-corrected visual acuity (BCVA) with related logarithm of the minimal angle of resolution (logMAR) in active phase, after achieving remission for 6 months, and at the last follow-up visit in remission. We examined each chart for subjective complaints that may suggest disease activity.
SITA-SWAP was performed on the Humphrey Visual Field Analyzer (Carl Zeiss Meditec, Inc, Dublin, California, USA) using a 24-2 protocol in the active phase and the remission state. We recorded SITA-SWAP parameters: total deviation pattern and score, pattern deviation pattern and score, mean deviation, and pattern standard deviation in the active phase, after 6 months in remission and at the latest follow-up visit in remission. The standardized visual field criteria used in the Optic Neuritis Treatment Trial (ONTT) protocol was used to evaluate SITA-SWAP visual field testing. Table 1 shows the classification of total deviation and pattern deviation patterns based on the ONTT and Gordon and associates’ study. We also examined the total deviation and pattern deviation plots point by point for the visual field defect (scotoma). The definition of a scotoma was based on studies by Alencar and associates and Liu and associates, who defined a scotoma as 3 or more significant ( P < .05) nonedge contiguous points, with at least 1 at the P < .01 level on the same side of the horizontal meridian. Each point was scored separately: points with P < .05 (score 1), P < .02 (score 2), P < .01 (score 3), and P < .005 (score 4). Total score of each plot was calculated by summation of all point scores in that plot. Changes in total deviation and pattern deviation scores in each eye from the active phase to the remission state were analyzed based on the total scores and were given a classification of stable (within 5 scores), improved (decreased >5 scores) or worsened (increased >5 scores). Changes in the mean deviation and pattern standard deviation from the active phase to the remission state were also recorded. The mean deviation and pattern standard deviation were considered stable when the change was within ±0.5 dB, improved when the change was more than +0.5 dB, and worsened when the change was less than −0.5 dB. The foveal threshold was turned off during visual field testing, since central vision and foveal threshold are typically normal until late in the course of disease and are thus not reliable markers for disease activity.
| Total deviation | |
| Diffuse visual loss | Points with P < 0.5% in 4 quadrants or points with P < 0.5% in 3 quadrants and 2 or more points with P < 1% in the fourth quadrant. |
| Central sparing | Three pericentral points with <5 dB change from normal. |
| Blind spot enlargement | ≥2 adjacent points with P < 0.5% or ≥3 adjacent points with P < 1% or ≥4 points with P < 2%. |
| No pattern | Not fitted to any of the above. |
| Pattern deviation | |
| Altitudinal | Defect affecting most of the 2 quadrants respecting the horizontal meridian. |
| Arcuate | Arc-like defect in the superior or inferior hemifield. |
| Central | Defect ≤6 degrees from fixation. |
| Cecocentral | Defect extending from the blind spot toward the fixation point. |
| Double arcuate | Arc-like defect in both the superior and inferior hemifield. |
| Hemianopic | Defect respects the vertical meridian. |
| Multiple foci | Scattered abnormalities in all 4 quadrants. |
| Nasal step | Defect in the nasal hemifield that respects the horizontal meridian. |
| Paracentral | Defect between 6 and 10 degrees from fixation. |
| Quadrant | Defect involving only 1 quadrant. |
| Three quadrant | Defect involving most of 3 quadrants. |
| Vertical step | Defect partially respect the vertical meridian. |
| No pattern | Not fitted to any of the above. |
Statistical Analysis
Descriptive analysis was done using SPSS 16.0 (SPSS Inc, Chicago, Illinois, USA). We used SPSS 16.0 (SPSS Inc) and R 3.1.2 (R development core team, University of Auckland, Auckland, New Zealand) for statistical analysis. We used unpaired 2-sample t tests to compare our patients (both eyes and the eye with better visual acuity) with historical normal controls. We also used paired 2-sample t tests to follow patients as they went from the active phase to the remission state. We used Fisher exact test to compare qualitative variables. Linear regression with generalized estimating equations (GEE) was used to model the relationship between the 2 variables considering the correlation between the 2 eyes of each patient. We considered a correlation coefficient less than 0.35 as weak, 0.36–0.65 as moderate, and over 0.66 as strong. We considered a P value equal to or less than .05 to be statistically significant.
Results
Seventy-five eyes of 38 patients met inclusion and exclusion criteria. Thirty-one eyes of 16 patients were excluded for glaucoma, visually significant cataract, diabetic retinopathy, and retinal detachment. The mean age of our patients at the first visit was 51.21 ± 9.48 (range 25–68) years. Of the 38 patients, 22 were female. Thirty-five patients were white, 1 patient was Hispanic, and 2 patients were not identified. HLA A-29 was positive in all but 1 patient. The mean duration of follow-up was 39.4 ± 15.5 (range 12–74) months. The control group consisted of 37 eyes of 37 normal controls with a mean age of 53.78 ± 8.99.
Common presenting symptoms included floaters 29/38 (76.3%), blurry vision 19/38 (50.0%), photopsias 10/38 (26.3%), nyctalopia 9/38 (23.6%), dyschromatopsia 2/38 (4%), and light sensitivity 1/38 (2.63%).
Mean BCVA was 20/25 (range 20/15–20/60) and mean logMAR was 0.1 ± 0.15 (range −0.1 to 0.5). Common features during the active phase included optic nerve swelling in 17 eyes (22.6%) in addition to low-grade anterior chamber reactions, low-grade vitritis, and characteristic fundus lesions. Indocyanine green angiography showed hypolucent spots at the level of the choroid in all patients. Fluorescein angiography showed vascular sheathing in 43 eyes (57.2%) and disc staining in 39 eyes (52%).
Thirty-seven patients started immunomodulatory therapy. A fluocinolone acetonide intravitreal implant (Retisert; Bausch and Lomb Incorporated, Rochester, New York) was implanted in both eyes of 1 patient as primary therapy. Of those on immunosuppressive therapy, 20 achieved remission with the first regimen employed. Seventeen patients required modification of primary treatment, 11 owing to side effects and 9 because of lack of response. Of these 17, 13 achieved remission with 1 modification and 2 with 2 modifications to immunosuppressive therapy. Two patients later required fluocinolone acetonide intravitreal implants bilaterally. The mean duration required to achieve remission after starting treatment was 14 ± 9.8 (range 5–44) months.
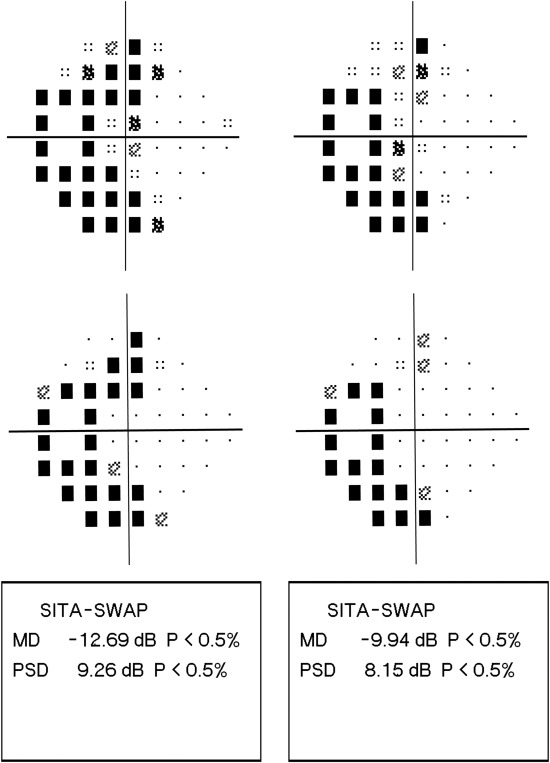
The Figure is an example of SITA-SWAP total deviation (Top left, Top right) and pattern deviation (Middle left, Middle right) patterns in the active phase and after 6 months in remission with their related scores. Total deviation and pattern deviation patterns of SITA-SWAP in the active phase and the remission state are highlighted in Table 2 . Seven eyes (9.3%) in the active phase and 6 eyes (8%) in the remission state showed both central sparing and blind spot enlargement in total deviation plot. Only 1 eye (1.3%) in the active phase showed a combination of arcuate and central scotoma in pattern deviation plot. All other eyes showed a single pattern of involvement in both total deviation and pattern deviation plots. The total deviation plots of those with active disease showed more fields with diffuse visual loss and fewer fields with central sparing than seen after remission was achieved. However, they were not significantly different ( P = .13; P = .07). Similarly, pattern deviation plots showed an increased number of 3 quadrant defects and arcuate scotoma in active state compared to inactive patients. Again, these changes were not significantly different ( P = .36; P = .15). Table 3 compares these patterns separately in right and left eyes and does not show a statistically significant difference. Total deviation and pattern deviation scores were also calculated in the active phase and after 6 months in remission. The average of total deviation scores in the active phase and the remission state were 60.24 ± 69.64 (range 0–208) and 29.13 ± 51.3 (range 0–206), respectively. The average of pattern deviation scores in the active phase and the remission state were 30.74 ± 26.95 (range 0–124) and 20.04 ± 21.9 (range 0–122), respectively. Total deviation score ( P = .002) and pattern deviation score ( P = .007) were significantly improved from the active phase to the remission state ( Table 4 ).
| Active-Phase Eyes (%) | Remission-Phase Eyes (%) | |
|---|---|---|
| Total deviation plot | ||
| Diffuse visual loss | 17 (22.7%) | 10 (13.3%) |
| Central sparing | 40 (53.3%) | 50 (66.7%) |
| Blind spot enlargement | 15 (20.0%) | 13 (17.3%) |
| No pattern | 10 (13.3%) | 8 (10.7%) |
| Pattern deviation plot | ||
| Arcuate | 9 (12.0%) | 4 (5.3%) |
| Altitudinal | 0 | 0 |
| Cecocentral | 0 | 0 |
| Quadrant | 2 (2.7%) | 2 (2.7%) |
| Double arcuate | 3 (4.0%) | 4 (5.3%) |
| Vertical step | 8 (10.7%) | 6 (8.0%) |
| Paracentral | 2 (2.7%) | 3 (4.0%) |
| Three quadrant | 10 (13.3%) | 4 (5.3%) |
| Nasal step | 0 | 0 |
| Central | 2 (2.6%) | 3 (4.0%) |
| Multiple foci | 8 (10.7%) | 7 (9.3%) |
| Hemianopic | 0 | 0 |
| No pattern | 32 (42.6%) | 42 (56.1%) |
| Right Eye (N = 38) | Left Eye (N = 37) | |||||
|---|---|---|---|---|---|---|
| Active State | Inactive State | P Value | Active State | Inactive State | P Value | |
| Total deviation plot | ||||||
| Diffuse visual loss | 8 (21.0%) | 5 (13.1%) | .43 | 9 (24.3%) | 5 (13.5%) | .37 |
| Central sparing | 21 (55.2%) | 27 (71.0%) | .23 | 19 (51.3%) | 23 (62.1%) | .48 |
| Pattern deviation plot | ||||||
| Arcuate | 5 (13.1%) | 2 (5.2%) | .43 | 4 (10.8%) | 2 (5.4%) | .42 |
| Three quadrant | 5 (13.1%) | 2 (5.2%) | .43 | 5 (13.5%) | 2 (5.4%) | .67 |
| Numeric Parameters | Active Phase | Remission Phase | P Value |
|---|---|---|---|
| Mean deviation (dB) | |||
| Range | −27.64 to +6.64 | −27.20 to +3.12 | |
| Mean ± SD | −6.30 ± 7.14 | −3.27 ± 5.95 | .006 |
| Pattern standard deviation (dB) | |||
| Range | 2.29–8.36 | 1.96–8.53 | |
| Mean ± SD | 4.31 ± 1.60 | 3.71 ± 1.4 | .001 |
| Total deviation score | |||
| Range | 0–208 | 0–206 | |
| Mean ± SD | 60.24 ± 69.64 | 29.13 ± 51.3 | .002 |
| Pattern deviation score | |||
| Range | 0–124 | 0–122 | |
| Mean ± SD | 30.74 ± 26.95 | 20.04 ± 21.9 | .007 |
SITA-SWAP numeric parameters in the active phase and after 6 months in remission are shown in the Figure (Bottom left and Bottom right). The average of mean deviations in the active phase and the remission state were −6.30 ± 7.14 (range −27.64 to 6.64) and −3.27 ± 5.95 (range −27.20 to 3.12), respectively. The average of pattern standard deviations in the active phase and the remission state were 4.31 ± 1.60 (range 2.29–8.36) and 3.71 ± 1.40 (range 1.96–8.53), respectively. We used a paired t test to compare mean deviation and pattern standard deviation in the active phase and the remission state for each eye. This showed a statistically significant improvement of mean deviation ( P = .006) and pattern standard deviation ( P = .001) ( Table 4 ).
Our patients were age-matched with 37 eyes of 37 healthy controls (53.78 ± 8.99) derived from a previously published study (average of mean deviation = −3.61; average of pattern standard deviation = 2.49) and compared the mean deviation and pattern standard deviation in these 2 groups. The average mean deviation in both eyes of our patients in the active phase was significantly different from that of normal controls ( P = .001). However, when in remission, mean deviation was no longer significantly different ( P = .36). The average pattern standard deviation in both eyes in the active phase and the remission state (mean = 3.71) was significantly different from normal controls ( P < .001). Mean deviation of the better eye in the active phase (−4.90) showed no significant difference compared to control group ( P = .2), yet pattern standard deviation of the better eye (3.56) was significantly different in the active phase ( P < .001) and the remission state ( P = .03).
Twenty-three patients had extended follow-up (46.2 ± 13.6 months) while in remission. In these patients, we compared mean deviation and pattern standard deviation from 6 months after remission to the most recent follow-up. There was not a statistically significant difference in mean deviation and pattern standard deviation between the initial 6 months of remission and the most recent testing ( P = .62; P = .43). We also compared total deviation and pattern deviation scores from 6 months after remission to the most recent follow-up. The difference was not statistically significant ( P = .91; P = .75).
Supplemental Figures 1–4 (Supplemental Material available at AJO.com ) show changes in total deviation score, pattern deviation score, mean deviation, and pattern standard deviation from the active phase to the remission state in each eye. We compared pattern deviation and total deviation scores in each eye from the active phase to the remission state based on definition of field defect and our definition of stability, progression, and improvement described in the methods. We also compared mean deviation and pattern standard deviation from active phase to remission state in each eye based on our definition of stability, progression, and improvement described in the methods. Table 5 and the Supplemental Table show the changes in these parameters from the active phase to the remission state in detail.
| SITA-SWAP Parameters | Improved Eye (%) | Stable Eye (%) | Worsened Eye (%) |
|---|---|---|---|
| Total deviation | 43 (57.3%) | 30 (40.0%) | 2 (2.7%) |
| Pattern deviation | 40 (53.3%) | 21 (28.0%) | 14 (18.7%) |
| Mean deviation | 60 (80.0%) | 12 (16.0%) | 3 (4.0%) |
| Pattern standard deviation | 37 (49.3%) | 29 (38.7%) | 9 (12.0%) |
We used linear regression with GEE to determine the relationship between time to achieve remission and change in mean deviation. We found no correlation (regression coefficient = 0.01; P = .92). The analysis was repeated for changes in the pattern standard deviation. This also found no correlation (regression coefficient = 0.01; P = .87). Linear regression with GEE did not demonstrate any correlation between change in total deviation scores and time to achieve remission (regression coefficient = −0.1; P = .32). Moreover, no correlation was found between change in pattern deviation scores and time to achieve remission (regression coefficient = 0.1; P = .36).
The correlation of mean deviation with logMAR visual acuity in the active phase was weak and negative (regression coefficient = −0.26; P < .001). There was no correlation between pattern standard deviation and logMAR visual acuity in the active phase (regression coefficient = +0.2; P = .06). The correlation between change in mean deviation and the changes in logMAR vision in the active and inactive phase was weak and negative (regression coefficient = −0.23; P = .008). The correlation between change in the pattern standard deviation and the changes in logMAR vision in the active and inactive phase was moderate and positive (regression analysis = +0.48; P = .001).
Results
Seventy-five eyes of 38 patients met inclusion and exclusion criteria. Thirty-one eyes of 16 patients were excluded for glaucoma, visually significant cataract, diabetic retinopathy, and retinal detachment. The mean age of our patients at the first visit was 51.21 ± 9.48 (range 25–68) years. Of the 38 patients, 22 were female. Thirty-five patients were white, 1 patient was Hispanic, and 2 patients were not identified. HLA A-29 was positive in all but 1 patient. The mean duration of follow-up was 39.4 ± 15.5 (range 12–74) months. The control group consisted of 37 eyes of 37 normal controls with a mean age of 53.78 ± 8.99.
Common presenting symptoms included floaters 29/38 (76.3%), blurry vision 19/38 (50.0%), photopsias 10/38 (26.3%), nyctalopia 9/38 (23.6%), dyschromatopsia 2/38 (4%), and light sensitivity 1/38 (2.63%).
Mean BCVA was 20/25 (range 20/15–20/60) and mean logMAR was 0.1 ± 0.15 (range −0.1 to 0.5). Common features during the active phase included optic nerve swelling in 17 eyes (22.6%) in addition to low-grade anterior chamber reactions, low-grade vitritis, and characteristic fundus lesions. Indocyanine green angiography showed hypolucent spots at the level of the choroid in all patients. Fluorescein angiography showed vascular sheathing in 43 eyes (57.2%) and disc staining in 39 eyes (52%).
Thirty-seven patients started immunomodulatory therapy. A fluocinolone acetonide intravitreal implant (Retisert; Bausch and Lomb Incorporated, Rochester, New York) was implanted in both eyes of 1 patient as primary therapy. Of those on immunosuppressive therapy, 20 achieved remission with the first regimen employed. Seventeen patients required modification of primary treatment, 11 owing to side effects and 9 because of lack of response. Of these 17, 13 achieved remission with 1 modification and 2 with 2 modifications to immunosuppressive therapy. Two patients later required fluocinolone acetonide intravitreal implants bilaterally. The mean duration required to achieve remission after starting treatment was 14 ± 9.8 (range 5–44) months.
The Figure is an example of SITA-SWAP total deviation (Top left, Top right) and pattern deviation (Middle left, Middle right) patterns in the active phase and after 6 months in remission with their related scores. Total deviation and pattern deviation patterns of SITA-SWAP in the active phase and the remission state are highlighted in Table 2 . Seven eyes (9.3%) in the active phase and 6 eyes (8%) in the remission state showed both central sparing and blind spot enlargement in total deviation plot. Only 1 eye (1.3%) in the active phase showed a combination of arcuate and central scotoma in pattern deviation plot. All other eyes showed a single pattern of involvement in both total deviation and pattern deviation plots. The total deviation plots of those with active disease showed more fields with diffuse visual loss and fewer fields with central sparing than seen after remission was achieved. However, they were not significantly different ( P = .13; P = .07). Similarly, pattern deviation plots showed an increased number of 3 quadrant defects and arcuate scotoma in active state compared to inactive patients. Again, these changes were not significantly different ( P = .36; P = .15). Table 3 compares these patterns separately in right and left eyes and does not show a statistically significant difference. Total deviation and pattern deviation scores were also calculated in the active phase and after 6 months in remission. The average of total deviation scores in the active phase and the remission state were 60.24 ± 69.64 (range 0–208) and 29.13 ± 51.3 (range 0–206), respectively. The average of pattern deviation scores in the active phase and the remission state were 30.74 ± 26.95 (range 0–124) and 20.04 ± 21.9 (range 0–122), respectively. Total deviation score ( P = .002) and pattern deviation score ( P = .007) were significantly improved from the active phase to the remission state ( Table 4 ).


