Purpose
To study the pathomorphology of serous retinal detachment (RD) associated with retinal vein occlusion by optical coherence tomography (OCT).
Design
Retrospective chart review.
Methods
Ninety-one eyes of 91 patients with macular edema associated with retinal vein occlusion had undergone a comprehensive ophthalmologic examination, including measurement by spectral-domain OCT.
Results
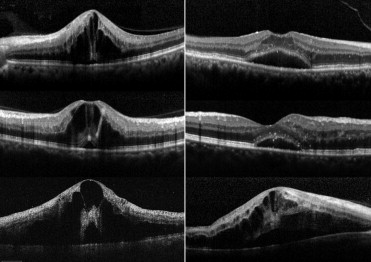
Eyes with macular edema associated with retinal vein occlusion typically showed foveal cystoid spaces and marked retinal swelling, especially in the outer retina. In addition, 76 eyes (83.5%) showed serous RD involving the fovea, which ranged in thickness from 64 μm to 871 μm (219.2 ± 161.6 μm). Fifty-two eyes showed a small pointed RD, with a small base. The point of the RD was always located beneath the fovea, where the outer surface of the swollen neurosensory retina seemed to be contracted inward, resulting in development of the pointed RD. Two eyes with no RD at the initial visit developed such a pointed RD during follow-up. In contrast, 24 eyes showed a more dome-shaped RD, with a large base, and in 18 eyes, a pointed RD seen at the initial visit changed into a dome-shaped RD during follow-up. In some cases, small outer retinal discontinuity was seen on the external surface of the swollen neurosensory retina.
Conclusions
In eyes with retinal vein occlusion, a small pointed RD initially developed just beneath the fovea, but subsequently changed into a dome-shaped RD. Based on the findings by OCT, we hypothesize that the foveal architecture, especially that of the Müller cell cone, is involved in the formation of serous RD.
Macular edema is just one of the many vision-threatening complications that may occur in eyes with retinal vein occlusion, but recent technologic advances in optical coherence tomography (OCT) have allowed more detailed observation of macular edema and have contributed to our understanding of the pathomorphology of this condition. With high resolution and increased acquisition speed, recent spectral-domain OCT showed that macular edema attributable to retinal vein occlusion is characterized by numerous cystoid spaces and marked retinal swelling, especially in the outer aspect. In that same report, by Yamaike and associates, eyes with retinal vein occlusion often showed large foveal cystoid spaces with accompanying small parafoveal cystoid spaces.
Severe retinal vein occlusion occasionally is accompanied by extensive serous retinal detachment (RD). Recent OCT examinations, however, revealed that macular serous RD is a common complication of retinal vein occlusion. Extensive leakage from capillaries that are affected by retinal vein occlusion may migrate to the subretinal space, where it results in serous RD. In addition, some eyes with distal branch retinal vein occlusion showed extensive serous RD beneath the fovea. In eyes with retinal vein occlusion, serous RD was typically located beneath the fovea, and the height of the RD was greatest in the fovea. Although Wise and Wangvivat previously reported that the macula has an exaggerated pathologic response to some retinal disorders, such as retinal vein occlusion, the reason why serous RD in eyes with retinal vein occlusion occurs predominantly beneath the fovea is unknown. In addition, while some reports showed a poor visual prognosis for eyes with serous RD associated with retinal vein occlusion, the effect of serous RD on visual prognosis remains unclear. In the study described herein, we evaluated sequential sections obtained with spectral-domain OCT of macular edema associated with retinal vein occlusion, in order to elucidate the pathophysiology of the serous RD seen in eyes with retinal vein occlusion and its association, if any, with visual function.
Patients and Methods
We retrospectively reviewed the medical records of 91 patients (91 eyes) with macular edema associated with retinal vein occlusion, who were examined at the Department of Ophthalmology, Kyoto University Hospital, from January 1, 2008 to January 31, 2009. In this study, 27 eyes of 27 patients with central retinal vein occlusion, 11 eyes of 11 patients with hemi-central retinal vein occlusion, and 53 eyes of 53 patients with branch retinal vein occlusion were examined. The inclusion criteria were eyes with a central macular thickness greater than 300 μm attributable to macular edema associated with retinal vein occlusion, and with a visual disturbance. The duration of symptoms was less than 6 months. In this study, pseudophakic eyes were included, but eyes that had undergone a prior vitrectomy or grid-pattern laser photocoagulation were excluded. Eyes with coexisting ocular disease (ie, epiretinal membrane, glaucoma, or proliferative diabetic retinopathy) were not recruited for this study. All patients had undergone a comprehensive ophthalmologic examination, including measurement of best-corrected visual acuity (VA) on a Landolt chart, determination of intraocular pressure, indirect ophthalmoscopy, slit-lamp biomicroscopy with a contact lens, and spectral-domain OCT (Spectralis HRA+OCT, Heidelberg Engineering, Heidelberg, Germany; Cirrus HD-OCT, Carl Zeiss, Dublin, California, USA).
In the current study, the macular region was examined in detail to evaluate morphologic changes of the retina and to evaluate the serous RD. Consecutive sections within the macular region were obtained in most cases with the Spectralis HRA+OCT by 1 of the authors, who is a retina specialist (A.S.). Vertical and horizontal line scans were also obtained; these were centered on the fovea. Using these OCT images, we performed 4 measurements: central macular thickness, total retinal thickness in the fovea, thickness of the neurosensory retina in the fovea, and thickness of the serous RD in the fovea. Central macular thickness was calculated as an averaged retinal thickness within a circle having a 500-μm radius centered on the fovea. Total retinal thickness was defined as the distance between the vitreoretinal interface and the retinal pigment epithelium. Total retinal thickness in the fovea and thickness of the neurosensory retina and of the serous RD in the fovea were measured just at the center of the fovea, with a caliper that was built into the software of the OCT machine. These measurements were performed by 1 of the authors (M.O.) in a masked fashion. Further, to assess the integrity of the outer foveal photoreceptor layer, the external limiting membrane (ELM) and the junction between inner and outer segments of the photoreceptors (IS/OS) beneath the fovea were examined on cross-sectional OCT scans. These evaluations of the ELM and IS/OS were performed on gray-scale OCT images.
Statistical analysis was performed using software designed for this purpose (StatView, version 4.5; SAS Institute, Cary, North Carolina, USA). For statistical analysis, the VA was converted to a logarithm of the minimal angle of resolution (logMAR). All values are presented as mean ± standard deviation. Bivariate relationships were analyzed using the Pearson correlation coefficient. Measurement values of 2 groups were compared using the Student t test; measurement values of 3 or more groups were compared using analysis of variance with the Bonferroni procedure. A P value < .05 was considered to be statistically significant.
Results
In the current study, 91 eyes of 91 patients with retinal vein occlusion (34 men and 57 women) were examined; ages ranged from 46 to 88 years (average, 66.3 ± 10.7 years) ( Table 1 ). Duration of symptoms ranged from 3 days to 6 months (average, 1.70 ± 1.86 months). At the initial visit, VA ranged from -0.18 to 1.70 in logMAR (average, 0.42 ± 0.39). For the treatment of macular edema, 40 eyes received intravitreal injections of bevacizumab, 10 underwent grid-pattern laser photocoagulation, and 2 received intravitreal or sub-Tenon injections of triamcinolone acetonide. The mean follow-up duration was 6.5 ± 6.7 months. At the final visit, VA ranged from -0.18 to 1.70 in logMAR (0.38 ± 0.39).
| BRVO n = 53 | CRVO n = 27 | Hemi-CRVO n = 11 | P Value | |
|---|---|---|---|---|
| Age (years) | 66.2 ± 11.1 | 67.8 ± 8.7 | 63.6 ± 13.4 | .5354 |
| Gender (M/F) | 16/37 | 15/12 | 5/6 | .0828 |
| Duration of symptoms (months) | 1.97 ± 1.95 | 1.45 ± 1.82 | 1.05 ± 1.35 | .2454 |
| Initial visual acuity (logMAR) | 0.39 ± 0.35 a | 0.57 ± 0.48 | 0.25 ± 0.20 a | .0414 |
| Total foveal thickness (μm) | 540.8 ± 173.9 b | 657.6 ± 176.9 | 543.0 ± 145.6 | .0177 |
| Foveal cystoid spaces (%) | 94.3 | 100 | 100 | .3289 |
| Serous retinal detachment (%) | 80.8 | 88.9 | 81.8 | .5408 |
| Perfusion status in FA c (perfused/ischemic) | 22/24 | 20/6 | 6/5 | .0544 |
a P < .05, compared with CRVO.
b P < .01, compared with CRVO.
c FA was not performed in 7 patients with BRVO and 1 patient with CRVO.
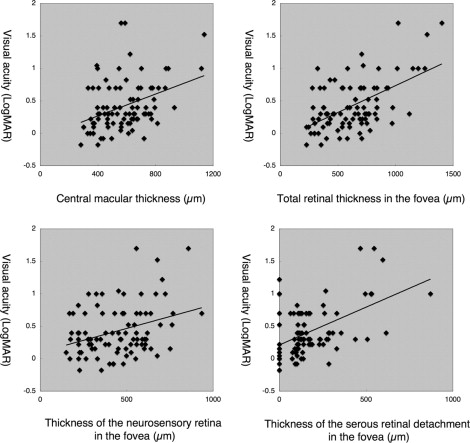
All 91 eyes showed marked macular edema associated with retinal vein occlusion; mean central macular thickness was 575.2 ± 177.9 μm. In our patients, OCT measurements showed that visual function was deteriorated, in parallel with the severity of the macular edema ( Figure 1 ). VA in logMAR fashion showed a correlation with central macular thickness (R = 0.38, P = .0002), total retinal thickness in the fovea (R = 0.55, P < .0001), thickness of the neurosensory retina in the fovea (R = 0.33, P = .0013), and thickness of the serous RD in the fovea (R = 0.50, P < .0001). In the current study, 15 eyes (16.5%) showed no serous RD at the initial visit, while the remaining 76 (83.5%) showed serous RD that involved the fovea. OCT examinations showed that RD was thickest beneath the fovea, with thickness of the RD in the fovea ranging from 64 μm to 871 μm (219.2 ± 161.6 μm). The mean total retinal thickness in the fovea of eyes with RD (658.4 ± 255.2 μm) was significantly greater than that in eyes without RD (462.5 ± 228.7 μm) ( P = .0070). However, the neurosensory retina in eyes with no RD (462.5 ± 228.7 μm) was as thick as that in eyes with RD (439.2 ± 167.1 μm) ( P = .6445).
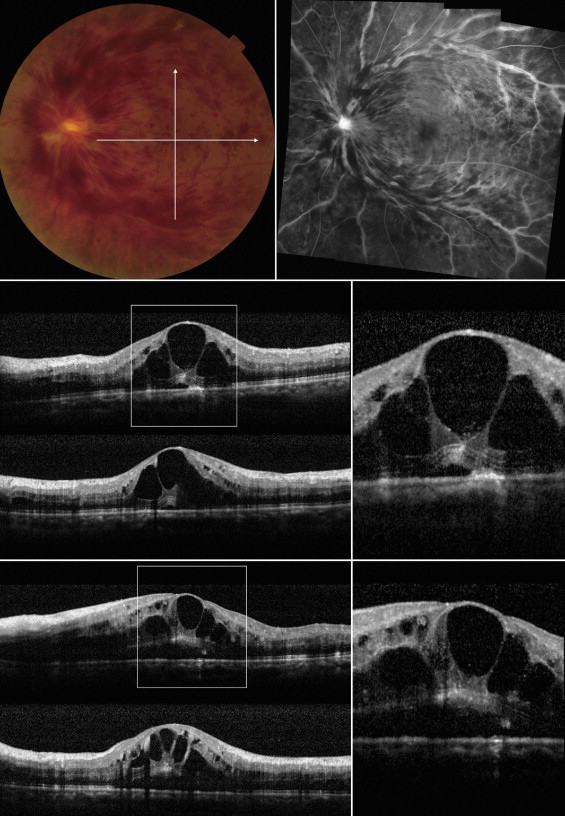
Although thick retinal hemorrhage often degraded the OCT images, eyes with macular edema associated with retinal vein occlusion typically showed foveal cystoid spaces and marked retinal swelling, especially in the outer retina. Of the 91 eyes, foveal cystoid spaces were seen in 88 eyes (96.7%) and marked swelling in the outer nuclear layer was seen in 79 eyes (86.8%). In the retina affected with retinal vein occlusion, the ELM and the IS/OS line were often seen at the bottom of the thickened outer nuclear layer, unless the thick overlying hemorrhage blocked the OCT beam (see Supplemental Figure 1 , available at AJO.com ). In addition, OCT examinations showed serous RD in the macular area of 76 eyes affected with retinal vein occlusion; most of these eyes showed a small pointed RD, with a small base ( Figure 2 , n = 52). The point of the serous RD was always located beneath the fovea, where the outer surface of the swollen neurosensory retina seemed to be contracted inward, resulting in development of the pointed RD. Two eyes of our patients with no RD at the initial visit developed a pointed RD during follow-up (see Supplemental Figure 2 , available at AJO.com ). In contrast, some eyes showed a dome-shaped RD, with a large base ( Figure 2 , n = 24). In 18 eyes in our study, a pointed RD at the initial visit converted to a dome-shaped RD during follow-up ( Figure 3 ). While most eyes with a pointed RD showed marked macular edema, swelling of the neurosensory retina appeared less prominent in eyes with dome-shaped RDs.
Retinal hemorrhage often made evaluation difficult in eyes with retinal vein occlusion. With precise sequential OCT examination, however, 9 of our patients showed small outer retinal discontinuities on the external surface of the swollen neurosensory retina ( Figure 4 ). Moreover, in 20 eyes, OCT examination showed highly reflective material (eg, retinal hemorrhage) that passed from the external surface of the neurosensory retina into the subretinal space ( Figure 5 ). After resolution of the swelling in the outer retina, a highly reflective line was detected in 12 eyes beneath the foveal cystoid space. This reflective line was almost vertical and seemed as a track of the passage, through which intraretinal fluid within the cystoid spaces had flowed into the subretinal space (see Supplemental Figure 3 , available at AJO.com ).
In eyes with a serous RD that was associated with retinal vein occlusion, the subfoveal structure of the outer retina between the foveal cystoid space and RD often seemed disorganized, and in many cases these patients had poor visual function. The ELM was detected beneath the fovea in eyes with RD as often as it was seen in eyes with no RD ( P = .8458). The rate of detection of the IS/OS line beneath the fovea in eyes with RD, however, was significantly lower than that in eyes with no RD ( P = .0303). In addition, 13 eyes with a dome-shaped RD showed a focal defect of the outer segment of the photoreceptors above the serous RD (see Supplemental Figure 4 , available at AJO.com ); in eyes in which this defect involved the fovea, VA was decreased.
Table 2 shows the clinical data of eyes with either a pointed or a dome-shaped RD. The mean foveal thickness was substantially greater in eyes with a pointed RD (673.3 ± 247.8 μm, P = .0054) or with a dome-shaped RD (626.2 ± 273.2 μm, P = .0515) than in eyes with no RD (462.5 ± 228.7 μm). Beneath the fovea, height of the RD was relatively greater in eyes with a dome-shaped RD (258.5 ± 198.6 μm) than in those with a pointed RD (201.1 ± 139.9 μm), although the difference was not statistically significant ( P = .1170). Whether or not a serous RD was seen, all eyes in the current study showed thickened neurosensory retina. The foveal neurosensory retina in eyes with a pointed RD (472.3 ± 158.9 μm) was as thick as that in eyes with no RD (462.5 ± 228.7 μm) ( P = .8488). However, the thickness of the neurosensory retina in eyes with a dome-shaped RD (367.7 ± 165.0 μm) was significantly less than that of eyes with a pointed RD ( P = .0165). Most of our patients showed decreased VA attributable to the macular edema associated with retinal vein occlusion, whether or not they showed a subfoveal RD. While eyes with no serous RD showed a tendency to have good initial VA, this difference was not statistically significant ( P = .2258).
| RD (−) n = 15 | RD (+) | P Value | ||
|---|---|---|---|---|
| Pointed n = 52 | Dome-Shaped n = 24 | |||
| Age (years) | 62.7 ± 13.3 | 66.1 ± 10.4 | 69.2 ± 9.4 | .1744 |
| Gender (M/F) | 7/8 | 15/37 | 12/12 | .1493 |
| BRVO/hemi-CRVO/CRVO | 10/2/3 | 27/6/19 | 16/3/5 | .6767 |
| Duration of symptoms (months) | 1.87 ± 1.79 | 1.51 ± 1.67 | 1.74 ± 1.46 | .7090 |
| Initial visual acuity (logMAR) | 0.31 ± 0.46 | 0.46 ± 0.40 | 0.42 ± 0.32 | .4523 |
| Final visual acuity (logMAR) | 0.29 ± 0.41 | 0.42 ± 0.38 | 0.34 ± 0.40 | .4460 |
| Total foveal thickness (μm) | 462.5 ± 228.7 b | 673.3 ± 247.8 | 626.2 ± 273.2 | .0203 |
| Thickness of neurosensory retina beneath the fovea (μm) | 462.5 ± 228.7 | 472.3 ± 158.9 | 367.7 ± 165.0 c | .0500 |
| Thickness of RD beneath the fovea (μm) | 0 b | 201.1 ± 139.9 | 258.5 ± 198.6 | <.0001 |
| Presence of foveal cystoid spaces (%) | 100.0 | 98.1 | 91.7 | .5884 |
| Detection of ELM under the fovea (%) | 73.3 | 65.4 | 66.7 | .8458 |
| Detection of IS/OS under the fovea (%) | 60.0 a | 32.7 | 25.0 | .0751 |
| Perfusion status in FA d (perfused/ischemic) | 6/7 | 29/19 | 13/9 | .6464 |
Stay updated, free articles. Join our Telegram channel

Full access? Get Clinical Tree


