Purpose
To examine the influence of a range of cardiovascular risk factors and ocular conditions on retinal vascular fractal dimension in the Singapore Malay Eye Study.
Design
Population-based cross-sectional study.
Methods
Fractal analysis of the retinal vessels is a method to quantify the global geometric complexity of the retinal vasculature. Retinal vascular fractal dimension (D f ) and caliber were measured from retinal photographs using a computer-assisted program. D f and arteriolar caliber were combined to form a retinal vascular optimality score (ranging from 0 to 3). Data on cardiovascular and ocular factors were collected from all participants based on a standardized protocol.
Results
Two thousand nine hundred thirteen (88.8% of 3280 participants) persons had retinal photographs of sufficient quality for the measurement. The mean D f was 1.405 (standard deviation, 0.046; interquartile range, 1.243 to 1.542). In the multiple linear regression analysis, after controlling for gender, serum glucose, intraocular pressure, anterior chamber depth, and retinal vascular caliber, smaller D f was associated independently with older age (standardized regression coefficient [sβ] = −0.311; P < .001), higher mean arterial blood pressure (sβ = −0.085; P < .001), a more myopic spherical equivalent (sβ = 0.152; P < .001), and presence of cataract (sβ = −0.107; P < .001). Retinal vascular optimality score was associated significantly with higher mean arterial blood pressure ( P > .001 for trend).
Conclusions
Age, blood pressure, refractive error, and lens opacity had significant influence on retinal vascular fractal measurements. A new score of retinal vascular optimality combining fractals and caliber showed strong association with blood pressure. Quantitative analysis of retinal vasculature therefore may provide additional information on microvascular architecture and optimality.
The human circulatory system has been thought to function according to an optimum design paradigm that allows sufficient blood distribution to tissue with the least amount of energy. Deviation from this optimal architecture therefore results in suboptimal and less efficient peripheral circulation and impaired circulatory transport. Based on this principle, new techniques to measure retinal vascular changes have provided new insights into circulatory diseases in the eye and elsewhere.
Fractal dimension (D f ) is a mathematical measure that quantifies complex geometric patterns in objects that are self-similar in their scaling patterns. Retinal vascular D f now has been used to describe and summarize the global structure of the retinal circulation quantitatively. Studies show that retinal vascular D f is associated with hypertension, diabetic retinopathy, chronic kidney disease, ) stroke, coronary heart disease mortality, nonarteritic anterior ischemic optic neuropathy, and cerebral autosomal dominant arteriopathy with subcortical infarcts and leukoencephalopathy. Nonetheless, there are no data on the distribution of retinal vascular D f in the general population and its relationship to cardiovascular and ocular factors. Understanding the influence of these factors on retinal vascular D f in an unselected population-based sample is important for this measurement to be applied to discriminate normal and pathologic states.
In this study, we described the distribution of retinal vascular D f and examined the effects of a range of cardiovascular and ocular conditions on retinal vascular D f in a population-based cohort. We further developed a score on the optimality of the retinal vasculature combining 2 measures—retinal vascular D f and retinal arteriolar caliber—and determined the association between this score and blood pressure.
Methods
Study Population
The Singapore Malay Eye Study is a population-based cross-sectional survey of eye diseases in urban Malay adults between 40 and 80 years of age residing in southwestern Singapore. Subjects were selected randomly and stratified by age (in 10-year age groups) from a computer-generated list provided by the Ministry of Home Affairs, Singapore. Between August 2004 and June 2006, 3280 (78.7%) of the 4168 eligible persons participated in the study. The methodology and objectives of the study has been described in detail elsewhere. Written informed consent was obtained from each participant, the study was conducted in accordance with the tenets of the Declaration of Helsinki, and ethical approval was obtained from the Singapore Eye Research Institute Institutional Review Board. Participants underwent a standardized interview, systemic and ocular examination, and laboratory investigations.
Measurement of Retinal Vascular Fractal Dimension
Digital fundus photography was undertaken using a 45-degree digital retinal camera (Canon CR-DGi with a 10D SLR digital camera backing; Canon, Tochigiken, Japan) after pupil dilation using tropicamide 1% and phenylephrine hydrochloride 2.5%. Two retinal images of each eye were obtained, one centered at the optic disc and another centered at the fovea. The spatial resolution of each image was 3072 × 2048 pixels, and the images were stored without compression before analysis.
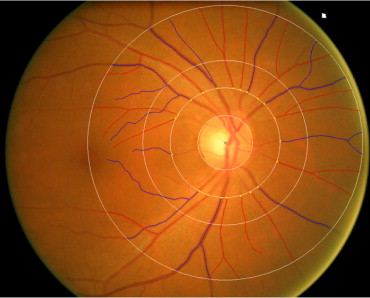
Of the 3280 participants, 3232 subjects (98.5%) underwent fundus photography; photographs from 2913 subjects (88.8%) were gradable in at least 1 eye. We used a semiautomated computer-assisted program (Singapore I Vessel Assessment, version 1.0; National University of Singapore, Singapore) to measure quantitatively a spectrum of retinal vascular parameters from digital photographs. Figure 1 shows an example of the computer-assisted program for measurement of retinal vascular parameters from a retinal fundus photograph. Trained graders, masked to participant characteristics, used the computer-assisted program to measure the parameters according to a standardized protocol. The measured area was standardized and defined within the region between 0.5 and 2.0 disc diameters away from the disc margin.
Fractal geometry can be used to a quantify branching pattern that exhibits the property of self-similarity. Similar to the bronchial tree, retinal vasculature is self-similar and has a fractal-like architecture. In this study, we used D f , which is a measure of a fractal structure characterizing the distribution of the a branching vascular system in 2-dimensional space, to quantify the branching pattern of the retinal blood vessels from retinal photographs. Retinal vascular D f was calculated from a skeletonized line tracing using the box-counting method, which divides each digital photograph into a series of squares for various side lengths, and the number of boxes is counted. D f is defined as the gradient of logarithms of the number of boxes and the size of the boxes. Larger values indicate a more complex branching pattern.
Retinal vascular caliber also was measured using the same program, which followed the standardized protocol used in the Atherosclerosis Risk in Communities Study. Based on the revised Knudtson-Parr-Hubbard formula, the retinal arteriolar and venular calibers were summarized as central retinal artery equivalent and central retinal vein equivalent, respectively.
Measurement of Cardiovascular Risk Factors
Systolic and diastolic blood pressures were measured using a digital automatic blood pressure monitor (Dinamap model Pro Series DP110X-RW, 100V2; GE Medical Systems Information Technologies, Inc, Milwaukee, Wisconsin, USA), after the subject was seated for at least 5 minutes. Blood pressure was measured twice, 5 minutes apart. A third measurement was made if the systolic blood pressure differed by more than 10 mm Hg or the diastolic differed by more than 5 mm Hg. The mean between the 2 closest readings was then taken as the blood pressure of that individual. Mean arterial blood pressure was calculated as two thirds of the diastolic plus one third of the systolic blood pressure. Pulse pressure was calculated as the difference between systolic and diastolic blood pressure. Hypertension was defined as systolic blood pressure of 140 mm Hg or more or diastolic blood pressure of 90 mm Hg or more at examination, a history of physician-diagnosed hypertension, use of antihypertensive medication, or both.
Nonfasting venous blood samples were analyzed at the National University Hospital Reference Laboratory for biochemical testing of serum total cholesterol, high-density lipoprotein cholesterol, low-density lipoprotein cholesterol, triglycerides, glycated hemoglobin, creatinine, and glucose. Diabetes mellitus was defined as random plasma glucose of 11.1 mmol/L or more, use of diabetic medication, or physician-diagnosed diabetes. Serum high-sensitivity C-reactive protein was measured in frozen plasma that had been stored at −80°C at the National University Hospital Reference Laboratory using an immunoturbidimetric assay (intra-assay precision, 0.6% to 1.3%; interassay precision, 2.3% to 3.1%) implemented on a Roche Integra 400 (Roche Diagnostics, Rotkreuz, Switzerland). The detection limit of this assay is 0.07 mg/L, and the coefficient variation is 2.9% at 6.3 mg/L and 3.9% at 108 mg/L mean value. Current smokers were defined as those currently smoking any number of cigarettes (i.e., current vs past or never smokers). Alcohol consumption was defined as those currently drinking alcoholic beverages daily or on some days (i.e., current vs past or never drinkers). Body mass index was calculated as body weight (in kilograms) divided by body height (in square meters).
Measurement of Ocular Factors
Intraocular pressure was measured with a Goldmann applanation tonometer (Haag-Streit, Bern, Switzerland) before pupil dilation. The refraction of each eye was measured using an autorefractor (Canon RK 5 Auto Ref-Keratometer; Canon). Spherical equivalent (SE) refraction was defined as sphere plus half the negative cylinder. Central corneal thickness was measured with an ultrasound pachymeter (Advent; Mentor O & O, Norwell, Massachusetts, USA); the mean of 5 measurements was used in the analysis. Axial length, anterior chamber depth, and corneal curvature were measured with a noncontact partial coherence laser interferometry (IOL Master version 3.01; Carl Zeiss Meditec AG, Jena, Germany); the mean of 5 measurements was used in the analysis.
Cataracts were assessed from lens photographs using the Wisconsin Cataract Grading System and were defined as nuclear cataract (≥4), cortical cataract (≥25%), or posterior subcapsular cataract (≥5%). Glaucoma was diagnosed and classified using the International Society of Geographical and Epidemiological Ophthalmology scheme, based on gonioscopy, optic disc characteristics, visual fields results, or a combination thereof. Retinopathy was graded from retinal photographs according to a modification of the Airlie House classification system as used in the Early Treatment Diabetic Retinopathy Study. The presence of retinopathy was defined as a severity level of 15 or more. Age-related macular degeneration (AMD) was graded from retinal photographs according to the Wisconsin Age-Related Maculopathy Grading System and was graded as present if early or late AMD signs were present, as previously described.
Statistical Analysis
Statistical analyses were performed using SPSS software version 17.0 (SPSS, Inc, Chicago, Illinois, USA). D f was analyzed as continuous variable (dependent variable). Analyses of covariance were used to estimate mean retinal vascular D f by presence versus absence of categorical variables (eg, diabetes) or quartiles of continuous variables (eg, blood pressure), adjusted for age and gender. Test of trend was determined by treating categorical risk factors as continuous ordinal variables.
In multiple regression analysis, we first included associated factors ( P < .1) from the initial models and also retinal vascular caliber to the model to examine the difference in retinal vascular D f , in the presence versus absence of a risk factor (dichotomous) or per-standard deviation change in risk factor (continuous; model 1). Second, we constructed another linear regression model to examine the difference in D f using stepwise regression with a backward selection procedure to include those independent variables that contributed significantly only at P < .1 in the model (model 2). We compared standardized regression coefficients (sβ), with a higher sβ value indicating stronger associations with retinal vascular D f .
Finally, we developed a new score, retinal vascular optimality score, combining retinal vascular D f and retinal arteriolar caliber measures, the 2 measures with the strongest associations with mean arterial blood pressure among various quantitative retinal vascular parameters. Because retinal vascular D f and retinal arteriolar caliber are associated inversely with blood pressure, we categorized the first quartile of the retinal measures as suboptimal and the second to fourth quartiles of the retinal measures as optimal. The proposed scoring system ranged from 0 to 3. A score of 0 was defined as suboptimal D f and retinal arteriolar caliber, a score of 1 was defined as suboptimal retinal arteriolar caliber and optimal D f ; a score of 2 was defined as optimal retinal arteriolar caliber and suboptimal D f , and a score of 3 was defined as optimal retinal arteriolar caliber and D f . We calculated the score for each subject. We then examined the relationship of the retinal vascular optimality score with mean arterial blood pressure by treating retinal vascular optimality score as a continuous ordinal variable.
Results
Table 1 shows the baseline characteristics of participants with and without gradable retinal photographs for D f measurement in the study population. Retinal photographs were gradable in 2913 of 3232 subjects. We excluded eyes with poor image quality, those without at least 6 large gradable arterioles or venules, or images without an adequate measured area (because of optical artifact) at the measured zone (n = 319). In the total cohort, the mean D f was 1.405 (standard deviation, 0.046); interquartile range was 1.243 to 1.542. The retinal vascular D f was fairly normally distributed in each age and gender group.
| Total (n = 3232) | Gradable Photographs (n = 2913) | Ungradable Photographs (n = 319) | P Value | |
|---|---|---|---|---|
| Age (years) | 58.56 ± 10.97 | 57.67 ± 10.68 | 66.63 ± 10.21 | <0.001 |
| Body mass index (kg/m 2 ) | 26.37 ± 5.10 | 26.44 ± 5.08 | 25.74 ± 5.21 | 0.021 |
| Systolic blood pressure (mm Hg) | 146.91 ± 23.65 | 145.91 ± 23.46 | 156.10 ± 23.41 | <0.001 |
| Diastolic blood pressure (mm Hg) | 79.69 ± 11.18 | 79.58 ± 11.15 | 80.74 ± 11.41 | 0.078 |
| Mean arterial blood pressure (mm Hg) | 102.10 ± 13.91 | 101.69 ± 13.87 | 105.86 ± 13.79 | <0.001 |
| Pulse pressure (mm Hg) | 67.22 ± 18.52 | 66.33 ± 18.27 | 75.36 ± 18.90 | <0.001 |
| Random blood glucose (mmol/L) | 6.80 ± 3.69 | 6.77 ± 3.64 | 7.09 ± 4.06 | 0.157 |
| HbA1c (%) | 6.80 ± 3.69 | 6.44 ± 1.54 | 6.59 ± 1.61 | 0.104 |
| Serum creatinine (mmol/L) | 93.42 ± 55.19 | 91.97 ± 50.25 | 107.18 ± 88.39 | <0.001 |
| Total cholesterol (mmol/L) | 5.63 ± 1.17 | 5.62 ± 1.16 | 5.72 ± 1.28 | 0.155 |
| HDL cholesterol (mmol/L) | 1.35 ± 0.33 | 1.35 ± 0.33 | 1.36 ± 0.35 | 0.702 |
| LDL cholesterol (mmol/L) | 3.55 ± 1.01 | 3.54 ± 1.00 | 3.58 ± 1.08 | 0.474 |
| Intraocular pressure (mmHg) | 15.36 ± 3.56 | 15.36 ± 3.51 | 15.34 ± 3.97 | 0.936 |
| Spherical equivalent (diopters) | −0.14 ± 2.16 | −0.03 ± 1.94 | −1.18 ± 3.47 | <0.001 |
| Axial length (mm) | 23.55 ± 1.06 | 23.53 ± 1.03 | 23.74 ± 1.30 | 0.004 |
| Anterior chamber depth (mm) | 3.10 ± 0.38 | 3.12 ± 0.38 | 2.96 ± 0.38 | <0.001 |
| Central corneal thickness (μm) | 541.32 ± 33.48 | 541.75 ± 33.38 | 537.35 ± 34.18 | 0.027 |
| Corneal curvature (mm) | 7.65 ± 0.25 | 7.65 ± 0.25 | 7.69 ± 0.27 | 0.021 |
| Male gender | 1558 (48.2) | 1393 (47.8) | 165 (51.7) | 0.185 |
| Hypertension | 2208 (68.3) | 1949 (66.9) | 259 (81.2) | <0.001 |
| Diabetes | 757 (24.2) | 667 (23.6) | 90 (30.0) | 0.013 |
| Current cigarette smoker | 657 (20.4) | 605 (20.8) | 52 (16.3) | 0.056 |
| Alcohol consumption | 52 (1.6) | 51 (1.8) | 1 (0.3) | 0.053 |
| Nuclear cataract | 446 (15.6) | 298 (11.5) | 148 (54.2) | <0.001 |
| Cortical cataract | 682 (24.8) | 568 (22.7) | 114 (45.8) | <0.001 |
| Posterior subcapsular cataract | 283 (10.3) | 191 (7.7) | 92 (35.4) | <0.001 |
| Glaucoma | 87 (2.7) | 72 (2.5) | 15 (4.7) | 0.019 |
| Retinopathy | 288 (8.9) | 262 (9.0) | 26 (8.3) | 0.681 |
| Age-related macular degeneration | 116 (3.6) | 107 (3.7) | 9 (2.8) | 0.437 |
Table 2 shows the associations of systemic cardiovascular risk factors with retinal vascular D f , after adjusting for age and gender. Smaller D f was related significantly to older age, diabetes, hypertension, elevated blood pressure levels (systolic, diastolic, and mean arterial), and increased glucose level. Other cardiovascular factors such as C-reactive protein level, cholesterol levels, and smoking were not significantly associated with D f .
| No. | Mean D f a | SE | P Value | |
|---|---|---|---|---|
| Age (years) | <.001 | |||
| 40 to 49 | 779 | 1.4240 | 0.0015 | |
| 50 to 59 | 913 | 1.4125 | 0.0014 | |
| 60 to 69 | 682 | 1.3959 | 0.0016 | |
| 70 to 80 | 539 | 1.3783 | 0.0018 | |
| Sex | .133 | |||
| Male | 1393 | 1.4066 | 0.0011 | |
| Female | 1520 | 1.4042 | 0.0011 | |
| Diabetes | .027 | |||
| No | 2163 | 1.4063 | 0.0009 | |
| Yes | 667 | 1.4020 | 0.0017 | |
| Hypertension | .024 | |||
| No | 963 | 1.4082 | 0.0015 | |
| Yes | 1949 | 1.4040 | 0.0010 | |
| Systolic blood pressure (mm Hg) | .002 | |||
| First quartile | 739 | 1.4095 | 0.0016 | |
| Second quartile | 741 | 1.4057 | 0.0016 | |
| Third quartile | 706 | 1.4045 | 0.0016 | |
| Fourth quartile | 723 | 1.4018 | 0.0017 | |
| Diastolic blood pressure (mm Hg) | <.001 | |||
| First quartile | 776 | 1.4082 | 0.0015 | |
| Second quartile | 693 | 1.4077 | 0.0016 | |
| Third quartile | 731 | 1.4049 | 0.0016 | |
| Fourth quartile | 709 | 1.4008 | 0.0016 | |
| Mean arterial blood pressure (mm Hg) | <.001 | |||
| First quartile | 717 | 1.4082 | 0.0016 | |
| Second quartile | 729 | 1.4090 | 0.0016 | |
| Third quartile | 741 | 1.4034 | 0.0016 | |
| Fourth quartile | 722 | 1.4011 | 0.0016 | |
| Pulse pressure (mm Hg) | .177 | |||
| First quartile | 767 | 1.4067 | 0.0017 | |
| Second quartile | 689 | 1.4056 | 0.0016 | |
| Third quartile | 728 | 1.4068 | 0.0016 | |
| Fourth quartile | 725 | 1.4025 | 0.0018 | |
| Body mass index (kg/m 2 ) | .268 | |||
| First quartile | 723 | 1.4034 | 0.0016 | |
| Second quartile | 724 | 1.4066 | 0.0016 | |
| Third quartile | 724 | 1.4052 | 0.0016 | |
| Fourth quartile | 723 | 1.4066 | 0.0016 | |
| Blood glucose (mmol/L) | .016 | |||
| First quartile | 765 | 1.4085 | 0.0016 | |
| Second quartile | 645 | 1.4058 | 0.0017 | |
| Third quartile | 714 | 1.4038 | 0.0016 | |
| Fourth quartile | 683 | 1.4034 | 0.0017 | |
| HbA1c (%) | .372 | |||
| First quartile | 830 | 1.4064 | 0.0015 | |
| Second quartile | 619 | 1.4051 | 0.0017 | |
| Third quartile | 726 | 1.4063 | 0.0016 | |
| Fourth quartile | 682 | 1.4039 | 0.0017 | |
| Total cholesterol (mmol/L) | .534 | |||
| First quartile | 716 | 1.4070 | 0.0016 | |
| Second quartile | 715 | 1.4050 | 0.0016 | |
| Third quartile | 715 | 1.4041 | 0.0016 | |
| Fourth quartile | 715 | 1.4058 | 0.0016 | |
| HDL cholesterol (mmol/L) | .691 | |||
| First quartile | 715 | 1.4062 | 0.0016 | |
| Second quartile | 707 | 1.4057 | 0.0016 | |
| Third quartile | 723 | 1.4045 | 0.0016 | |
| Fourth quartile | 716 | 1.4056 | 0.0017 | |
| LDL cholesterol (mmol/L) | .411 | |||
| First quartile | 718 | 1.4069 | 0.0016 | |
| Second quartile | 722 | 1.4051 | 0.0016 | |
| Third quartile | 716 | 1.4051 | 0.0016 | |
| Fourth quartile | 705 | 1.4049 | 0.0016 | |
| High-sensitivity C-reactive protein (mg/L) | .526 | |||
| First quartile | 730 | 1.4068 | 0.0016 | |
| Second quartile | 692 | 1.4049 | 0.0016 | |
| Third quartile | 659 | 1.4033 | 0.0017 | |
| Fourth quartile | 687 | 1.4058 | 0.0016 | |
| Current smoking | .164 | |||
| No | 2299 | 1.4068 | 0.0016 | |
| Yes | 605 | 1.4049 | 0.0016 | |
| History of stroke | .784 | |||
| No | 2841 | 1.4055 | 0.0008 | |
| Yes | 65 | 1.4040 | 0.0053 | |
| History of myocardial infarction | .345 | |||
| No | 2725 | 1.4052 | 0.0008 | |
| Yes | 179 | 1.4084 | 0.0033 |
a Adjusted for age and gender (gender adjusted for age, and age only adjusted for gender).
Table 3 shows the associations of ocular factors with retinal vascular D f . After adjusting for age and gender, smaller D f was related significantly to elevated intraocular pressure, more myopic SE, elongated axial length, increased anterior chamber depth, and cataracts. Other ocular factors such as central corneal thickness, glaucoma, and AMD were not significantly associated with D f .
| No. | Mean D f a | SE | P Value | |
|---|---|---|---|---|
| Intraocular pressure (mmHg) | .018 | |||
| First quartile | 847 | 1.4049 | 0.0015 | |
| Second quartile | 715 | 1.4090 | 0.0016 | |
| Third quartile | 803 | 1.4068 | 0.0015 | |
| Fourth quartile | 541 | 1.3998 | 0.0018 | |
| Spherical equivalent (diopters) | <.001 | |||
| First quartile | 770 | 1.3975 | 0.0015 | |
| Second quartile | 876 | 1.4071 | 0.0015 | |
| Third quartile | 631 | 1.4098 | 0.0017 | |
| Fourth quartile | 631 | 1.4085 | 0.0017 | |
| Axial length (mm) | .006 | |||
| First quartile | 653 | 1.4064 | 0.0017 | |
| Second quartile | 662 | 1.4125 | 0.0016 | |
| Third quartile | 638 | 1.4076 | 0.0017 | |
| Fourth quartile | 650 | 1.4010 | 0.0017 | |
| Anterior chamber depth (mm) | .033 | |||
| First quartile | 651 | 1.4083 | 0.0017 | |
| Second quartile | 655 | 1.4081 | 0.0016 | |
| Third quartile | 660 | 1.4084 | 0.0016 | |
| Fourth quartile | 639 | 1.4025 | 0.0017 | |
| Corneal curvature (mm) | .240 | |||
| First quartile | 637 | 1.4033 | 0.0017 | |
| Second quartile | 642 | 1.4098 | 0.0017 | |
| Third quartile | 641 | 1.4079 | 0.0016 | |
| Fourth quartile | 634 | 1.4069 | 0.0017 | |
| Central corneal thickness (mm) | .468 | |||
| First quartile | 739 | 1.4052 | 0.0016 | |
| Second quartile | 729 | 1.4069 | 0.0016 | |
| Third quartile | 749 | 1.4061 | 0.0016 | |
| Fourth quartile | 671 | 1.4037 | 0.0017 | |
| Nuclear cataract | <.001 | |||
| No | 2290 | 1.4087 | 0.0009 | |
| Yes | 298 | 1.3887 | 0.0027 | |
| Cortical cataract | .006 | |||
| No | 1935 | 1.4086 | 0.0010 | |
| Yes | 568 | 1.4024 | 0.0019 | |
| Posterior subcapsular cataract | .001 | |||
| No | 2301 | 1.4083 | 0.0009 | |
| Yes | 191 | 1.3975 | 0.0031 | |
| Any cataract | <.001 | |||
| No | 1661 | 1.4098 | 0.0011 | |
| Yes | 819 | 1.3982 | 0.0017 | |
| Glaucoma | .788 | |||
| No | 2841 | 1.4054 | 0.0008 | |
| Yes | 72 | 1.4067 | 0.0051 | |
| Retinopathy | .974 | |||
| No | 2648 | 1.4054 | 0.0008 | |
| Yes | 262 | 1.4053 | 0.0026 | |
| Age-related macular degeneration | .915 | |||
| No | 2806 | 1.4054 | 0.0008 | |
| Yes | 107 | 1.4050 | 0.0042 | |
| Central retinal artery equivalent | .106 | |||
| First quartile | 728 | 1.4002 | 0.0016 | |
| Second quartile | 729 | 1.4076 | 0.0016 | |
| Third quartile | 727 | 1.4109 | 0.0016 | |
| Fourth quartile | 729 | 1.4029 | 0.0016 | |
| Central retinal vein equivalent | .010 | |||
| First quartile | 728 | 1.4003 | 0.0016 | |
| Second quartile | 730 | 1.4062 | 0.0016 | |
| Third quartile | 727 | 1.4099 | 0.0016 | |
| Fourth quartile | 728 | 1.4051 | 0.0016 |
Stay updated, free articles. Join our Telegram channel

Full access? Get Clinical Tree


