8
Retinal Imaging: Optical Coherence Tomography
Andre J. Witkin  Jay S. Duker
  Elias Reichel
Optical coherence tomography (OCT) is a high-resolution cross-sectional imaging technique that has become a standard in ophthalmology. Initially developed as a research tool in 1991, it was soon recognized that OCT could be utilized to image the retina with an unprecedented spatial resolution of approximately 10 microns, allowing visualization of intraretinal layers as well as accurate measurement of retinal and intraretinal thicknesses. Since the development of commercial OCT models in 1996, advancements in software and equipment have allowed it to become a powerful clinical tool for the diagnosis and management of macular disease and glaucoma. OCT imaging systems can be used to take multiple images through a given point on the fundus, automatically measure retinal or intraretinal thicknesses, and, by combining images, create retinal thickness maps. The abilities to obtain high-resolution images and highly accurate retinal thickness measurements allow detailed analysis of retinal anatomy at consecutive visits, providing a useful assessment of the efficacy of treatments over time.
OPTICAL COHERENCE TOMOGRAPHY INSTRUMENTATION
The most widely used model to date has been the OCT3 or Stratus OCT, developed in 2002 by Carl Zeiss Meditec, Inc. This model has imaging software protocols used to scan the macula and optic nerve head. For macular applications, the most useful scanning modes are the retinal thickness mapping and fast retinal thickness mapping modes. These scanning modes acquire six linear images centered at the point of fixation, spaced 30 degrees apart and typically 6 mm in length. The retinal thickness mapping protocol obtains six high pixel density images acquired individually. Each image in this mode can be examined separately to assess macular anatomy, or the images can be combined and measured using the standard computer software to obtain a topographic thickness map of the macula. A second protocol, the fast retinal thickness mapping mode, acquires six lower pixel density OCT images at once, and is usually used to create a topographic map only. Individual images as well as topographic thickness maps have been shown to be useful in a variety of retinal diseases.
OCT is based on the principle of low-coherence interferometry. In this technique, the distances and sizes of different structures in the eye are determined by measuring the “echo” time it takes for light to be backscattered from different structures at various axial distances. This is analogous to A-mode ultrasound, in which the axial length of the eye is measured using sound rather than light (1, 2). When successive axial measurements at different transverse points are combined, a tomographic or cross-sectional image of tissue is obtained, similar to B-mode ultrasound. In StratusOCT, a normal 6 mm macular image is created using 512 A-lines. Further details of OCT principles and operation are beyond the scope of this text.
NORMAL RETINA
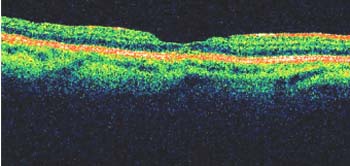
In order to detect abnormalities in OCT images, it is important for the clinician to be familiar with normal macular anatomy. The vitreoretinal interface is noted by the contrast between the nonreflective vitreous and the reflective surface of the retina. The foveal center demonstrates a characteristic depression in its contour. The retinal nerve fiber layer, inner plexiform layer, outer plexiform layer, photoreceptor layer, retinal pigment epithelium (RPE), and choroid all are well delineated (Fig. 8-1). The high contrast between the outer reflective layers and the outer nuclear layer in OCT images provides a clear boundary in the computation of retinal thicknesses using computer segmentation algorithms.
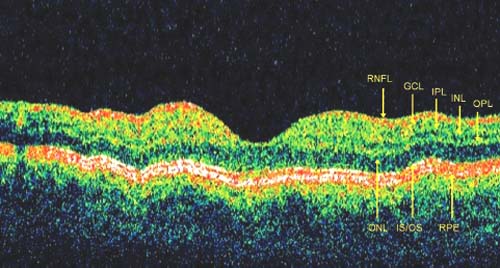
Figure 8-1. Optical coherence tomography image of the normal retina. Note the normal depression of the retinal contour at the fovea. Waviness of the image is due to slight axial motion of the patient during image capture (axial motion artifact). Retinal layers are labeled: RNFL, retinal nerve fiber layer; GCL, ganglion cell layer; IPL, inner plexiform layer; INL, inner nuclear layer; OPL, outer plexiform layer; ONL, outer nuclear layer; IS/OS, inner segment/outer segment junction; RPE, retinal pigment epithelium.
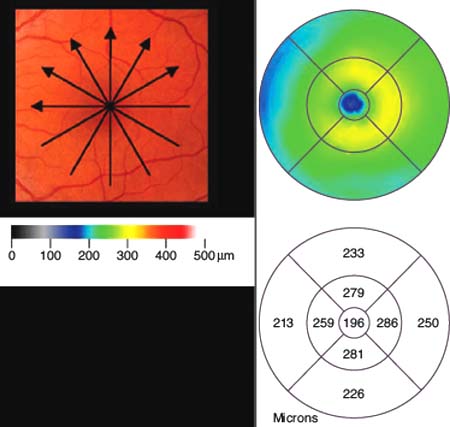
Figure 8-2. Example of a macular map created from six 6 mm optical coherence tomography (OCT) images through the macula. OCT software calculates a false color map as well as a numerical map with 9 thickness zones. The central foveal circle is the most accurate calculation, as it is a mean of 512 a-scans. Foveal thickness of this patient is 196 microns.
OCT offers an objective test for serial quantitative evaluations of retinal thickness (3). Macular mapping algorithms calculate a number of different thicknesses. Six radial scans are combined to create a retinal thickness map with nine zones, as well as a central foveal thickness measurement at the point of intersection of the six scans (Fig. 8-2). The central foveal circle on the macular map is calculated as a mean of 512 data points in the macular mapping protocol and 128 data points in the fast macular mapping protocol. This central foveal circle measurement is probably the most clinically relevant, as it includes the highest number of data points from six separate scans. Mean central foveal circle thickness measurements in normal subjects are around 212 ± 20 microns (4). Fast macular mapping thickness measurements have been found to be comparable to the regular mapping protocol, but individual cross-sectional images of 128 lines are much poorer quality than the 512-line scans obtained with the regular macular mapping protocol (5).
MACULAR EDEMA
Many retinal disease processes can result in an increase in macular thickness due to an accumulation of intraretinal fluid. This fluid widens the distance between the well-delineated anterior and posterior boundaries of the retina, which are easily detected using OCT thickness measurement software. Because of the high axial resolution of OCT, retinal thickness can be measured accurately and reproducibly to within 10 microns and followed serially. OCT has been shown to be a more sensitive method of detecting macular edema than dilated fundus examination using a 78-diopter lens (6) and has been shown to be equally effective as fluorescein angiography (FA) in detecting macular edema (7).
Macular edema typically has one of three appearances on OCT: diffuse retinal thickening, subretinal fluid, or cystoid macular edema. These three appearances are not mutually exclusive and are not pathognomonic of the underlying cause. Cystoid macular edema is characterized by fluid accumulation in intraretinal cystic spaces (Fig. 8-3A). OCT images demonstrate cystic areas of decreased reflectivity within the retina. The ability to quantify the extent of thickening is particularly useful in assessing the response to a variety of treatment modalities (Figs. 8-3A and 8-3B).
For example, in diabetes, OCT can be used to follow the clinical response to focal laser treatment for clinically significant macular edema. Intravitreal corticosteroid injections have also been used in the treatment of macular edema. OCT has been shown to be a sensitive method to measure changes in macular thickness following intravitreal triamcinolone treatment, and it may be useful in directing retreatment with intravitreal corticosteroids (8).
In exudative age-related macular degeneration (AMD), changes in macular thickness can be followed over time. OCT has been used to follow patient responses to photodynamic therapy and anti-vascular endothelial growth factor (anti-VEGF) therapy and to guide retreatment decisions, as the presence of increased macular thickness implies an actively leaking choroidal neovascularization (CNV) (9). Although FA remains the gold standard to diagnose patients with choroidal neovascularization, differentiating scar tissue from active CNV may be difficult on FA. By its ability to measure macular edema and thickness in a quick and noninvasive manner, OCT has become a standard in the management of previously diagnosed CNV in many clinics.
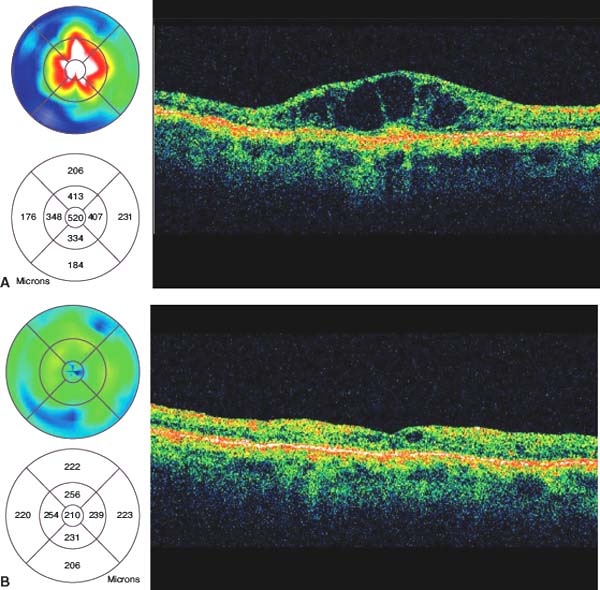
Figure 8-3. A: Example of an optical coherence tomography (OCT) image and macular map from a patient with cystoid macular edema. Note the optically clear zones of fluid within the neural retina. B: Optical coherence tomography (OCT) images from the same patient, 2 months after treatment with intravitreal kenalog. Note the drastic reduction in macular thickness as well as resolution of most of the cystic spaces within the retina.
CHOROIDAL NEOVASCULARIZATION
OCT is able to localize a choroidal neovascular membrane to the subretinal or sub-RPE space. Thus, OCT may have utility in defining surgically approachable membranes in AMD as well as from other causes of CNV. Figure 8-4 shows a choroidal neovascular membrane that has penetrated the RPE to lie primarily in the subretinal space. In exudative AMD, OCT may be able to distinguish between occult versus classic forms of CNV by identifying whether the lesion is subretinal or sub-RPE (10, 11). CNV membranes that are small and classic or primarily classic, such as in Figure 8-5, are typically the best candidates for submacular surgery (12). With the advent of anti-VEGF therapy, submacular surgery for CNV has become a less widely used form of therapy.
MACULAR HOLES
As OCT was developed for clinical use in ophthalmology, it was immediately recognized that the technology could be used to image the vitreomacular interface with exquisite detail. One of the earliest applications of OCT was in imaging macular holes. OCT is able to measure macular hole size and depth, identify epiretinal and posterior hyaloid membranes, and differentiate full-thickness holes from pseudoholes and lamellar holes, making it a useful classification and staging tool prior to surgery.
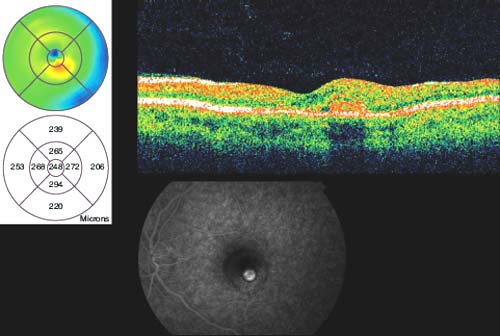
Figure 8-4. Example of a classic choroidal neovascular membrane. In the optical coherence tomography (OCT) image, there is a highly reflective neovascular lesion clearly seen above the retinal pigment epithelium.
Stay updated, free articles. Join our Telegram channel

Full access? Get Clinical Tree


