Purpose
To verify the association between retinal artery occlusion (RAO) and stroke with a large-scale nationwide study.
Design
Retrospective nationwide population-based administrative database study.
Methods
Data were collected from the Longitudinal Health Insurance Database 2000 (LHID2000), which contains claim data from 1 million randomly selected beneficiaries among Taiwan’s 23 million residents. The study cohort consisted of all patients with a diagnosis of RAO from January 1999 through December 2006 (n = 464). The control group consisted of randomly selected patients (n = 2748) matched with the study group by age, sex, date of index medical care, and comorbid hypertension. Patients were tracked from their index date for 3 years. The Kaplan-Meier method was used to compute the stroke-free survival rate. Cox proportional hazard regressions were used to compute the adjusted stroke-free survival rate after adjusting for possible confounding factors.
Results
Ninety-one RAO patients (19.61%) and 280 controls (10.05%) had a stroke ( P < .0001) during the 3-year follow-up period. Compared with the controls, the incidence rate ratios of stroke in RAO patients were 9.46 at 0-1 month, 5.57 at 1-6 months, and 2.16 at 0-3 years after RAO ( P < .0001). After adjusting for age, sex, and selected comorbid disorders, the hazard ratio of having a stroke for RAO patients was still 2.07 times higher than that of controls and 3.34 times higher in the ≤60-year-old subgroup.
Conclusions
RAO increases the risk for subsequent stroke. Early neurologic evaluation and secondary prevention for stroke are recommended for RAO patients.
The retinal circulation, which includes the central retinal artery and its branches, is the only blood supply to the inner retina. Acute occlusion of central or branch retinal arteries, termed retinal artery occlusion (RAO), may result in acute, painless monocular visual loss. RAO is analogous to a stroke of the eye caused by obstruction of the retinal arteries or nonobstructive hypoperfusion of the retina, and is recognized as an ophthalmic emergency with a poor visual prognosis.
Anatomically, the central retinal artery arises from the ophthalmic artery, the first intracranial branch of the internal carotid artery. The internal carotid artery provides the main blood supply to the brain. In other words, the retina and brain share the same arterial supply. The pathogenesis of RAO is primarily thromboemboli lodged in the lumen of retinal arterioles. Similarly, more than 80% of strokes are of the ischemic type caused by thromboemboli. In addition, atherosclerotic changes, inflammatory endarteritis, angiospasm, or hydrostatic arterial occlusion may occlude the retinal and cerebral blood flow. Other than the anatomic and pathogenic similarities, RAO and stroke have overlapping systemic risk factors, including hypertension, diabetes mellitus, and hyperlipidemia. Therefore, RAO is suspected to be an early warning for subsequent stroke. However, the conclusions of published studies are limited by the small number of patients or the absence of control comparisons. To obtain sufficient statistical power, a large-scale database to investigate the association of RAO and stroke is necessary. Therefore, we did a nationwide, case-control cohort study in Taiwan to investigate whether RAO increases the risk of developing stroke.
Methods
Database
Taiwan launched a single-payer National Health Insurance (NHI) program on March 1, 1995. The NHI offers comprehensive medical care coverage to all Taiwan residents. As of 2007, 22.60 million (>98%) of Taiwan’s 22.96 million legal residents (citizens and noncitizens) were enrolled in this program. The NHI Research Database (NHIRD) provides encrypted patient identification numbers, sex, date of birth, dates of admission and discharge, the ICD-9-CM (International Classification of Diseases, Ninth Revision, Clinical Modification) codes of diagnoses and procedures, details of prescriptions, and costs covered and paid for by the NHI. The Longitudinal Health Insurance Database 2000 (LHID2000), a sub-dataset of the NHIRD, contains all claim data (from 1996 to 2008) of 1 million beneficiaries who were randomly selected from the system in 2000. There was no significant difference in age, sex, or average insured payroll-related premiums between the sample group and all enrollees. The present study was approved by the National Health Research Institutes.
Selection of Patients and Variables
This cohort comparison study consisted of all patients (n = 464) diagnosed with RAO (ICD-9-CM codes 362. 31 [central retinal artery occlusion, CRAO], 362.32 [branch retinal artery occlusion, BRAO], and 362.33 [partial retinal artery occlusion, PRAO]), from ambulatory (including emergency) care or inpatient care, from January 1999 through December 2006. The controls (n = 2748, 6 patients for every RAO patient), patients not diagnosed with RAO, were randomly selected from the dataset. They were matched by sex, age, and date of index ambulatory care visit or hospitalization for RAO patients. The comorbid hypertension in these 2 cohorts was also matched, because hypertension is the most common disorder associated with RAO and is identified as one of the most significant risk factors for stroke. To ensure that the selected cases were new episodes, and to avoid the potentially confounding factors of chronicity, patients who had been diagnosed with RAO in ambulatory care before January 1999 or who had been previously diagnosed with any type of stroke (ICD-9-CM codes 430-438) were excluded.
Each patient was tracked from his or her index outpatient visit or hospitalization for 3 years to distinguish all patients who had developed any type of stroke, including ischemic (ICD-9-CM codes 433, 434, and 437), hemorrhagic (ICD-9-CM codes 430, 431, and 432), transient ischemic attack (TIA, ICD-9-CM code 435.9), and unspecified (ICD-9-CM code 436) strokes. Demographic data, such as sex and age, were recorded. We also recorded patients’ comorbid disorders, including hypertension (ICD-9-CM codes 401-405), diabetes mellitus (ICD-9-CM code 250), hyperlipidemia (ICD-9-CM code 272), and chronic renal disease (ICD-9-CM codes 580-588), because these are critical factors that affect the risk of stroke. We counted these comorbid conditions if the condition occurred either in the inpatient setting or in 2 or more ambulatory care claims coded 6 months before and after the index medical care date.
Statistical Analysis: SAS for Windows 9.2
(SAS Institute, Inc, Cary, North Carolina, USA) was used for this study. Descriptive statistical analyses using Pearson χ 2 tests were done to compare the characteristics of the 2 cohorts in terms of demographic characteristics, selected comorbid disorders, and the risk of developing stroke. The risk of stroke between RAO patients and controls was compared by estimating the incidence rate ratio with Poisson regression. Kaplan-Meier analysis was used to calculate the cumulative incidence rates of stroke between different age groups in the 2 cohorts, and the log-rank test was used to analyze the differences between the survival curves. Thereafter, separate Cox proportional hazard regressions were done to compute the stroke-free survival rate after adjusting for possible confounding factors. Significance was set at P < .05.
Results
Demographic Data
Between 1999 and 2006, 464 RAO patients and 2784 age-, sex-, and hypertension-matched controls were recruited, after excluding ineligible subjects. The mean age of the RAO patients was 60.14 (SD, 14.71) and of the controls was 60.16 (SD, 14.66). We subclassified these patients into 3 age groups: ≤60 years old, between 61 and 69 years old, and ≥70 years old. Pearson χ 2 tests revealed that there was no difference in the comorbidity of hyperlipidemia (10.34% vs 9.20%; P = .4313) after individual matching. However, RAO patients were more likely than controls to have the comorbidities of diabetes mellitus (22.47% vs 14.91%; P < .0001) and chronic renal disease (4.53% vs 2.59%; P = .0204) ( Table 1 ).
| Characteristic | RAO | Controls | P Value a |
|---|---|---|---|
| (n = 464) | (n = 2784) | ||
| n (%) | n (%) | ||
| Sex | |||
| Female | 199 (42.89) | 1194 (42.89) | >.9999 |
| Male | 265 (57.11) | 1590 (57.11) | |
| Age (y) | 60.14 ± 14.71 b | 60.16 ± 14.66 b | .9874 |
| ≤60 | 204 (43.97) | 1221 (43.86) | .9969 |
| 61-69 | 136 (29.31) | 821 (29.49) | |
| ≥70 | 124 (26.72) | 742 (26.65) | |
| Hypertension | |||
| Yes | 177 (38.15) | 1062 (38.15) | >.9999 |
| No | 287 (61.85) | 1722 (61.85) | |
| Diabetes | |||
| Yes | 104 (22.47) | 415 (14.91) | <.0001 |
| No | 360 (77.59) | 2369 (85.09) | |
| Hyperlipidemia | |||
| Yes | 48 (10.34) | 256 (9.20) | .4313 |
| No | 416 (89.66) | 2528 (90.80) | |
| Renal disease | |||
| Yes | 21 (4.53) | 72 (2.59) | .0204 |
| No | 443 (95.47) | 2712 (97.41) |
a P value was calculated based on the Pearson χ 2 test.
Incidence Rates of Stroke
Of the 3248 patients recruited, 371 (11.42%) had a stroke during the 3-year follow-up period: 91 of 464 RAO patients (19.61%) and 280 of 2784 control patients (10.05%) ( Table 2 ). The incidence rates of stroke were 7.80 and 3.61 per 100 person-years (PY) for the RAO and control groups, respectively, significantly higher for the RAO patients (incidence rate ratio [IRR] = 2.16; 95% confidence interval [CI] = 1.70-2.74, P < .0001) ( Table 2 ).
| Characteristic | RAO | Control | ||||||||
|---|---|---|---|---|---|---|---|---|---|---|
| N | Stroke, n (%) | PY | Rate a | N | Stroke n (%). | PY | Rate | IRR (95% CI) | P b | |
| Total stroke | 464 | 91 (19.61) | 1167.36 | 7.80 | 2784 | 280 (10.05) | 7756.46 | 3.61 | 2.16 (1.70-2.74) | <.0001 |
| Ischemia | 65 (71.43) | 173 (61.79) | .2878 c | |||||||
| Hemorrhage | 7 (7.69) | 21 (7.50) | ||||||||
| Unspecified | 9 (9.89) | 33 (11.79) | ||||||||
| TIA | 10 (10.99) | 53 (18.93) | ||||||||
| TIA incidence | 464 | 10 (2.16) | 2784 | 53 (1.90) | .8557 c | |||||
| Follow-up period | ||||||||||
| 0-1 mo | 464 | 23 (4.96) | 36.88 | 62.36 | 2784 | 15 (0.54) | 221.77 | 6.76 | 9.46 a (4.94-18.1) | <.0001 |
| 1-6 mo | 440 | 31 (7.05) | 173.66 | 17.85 | 2762 | 31 (1.30) | 1123.48 | 2.76 | 5.57 a (3.45-9.00) | <.0001 |
| 6-12 mo | 409 | 11 (2.69) | 205.09 | 5.44 | 2710 | 58 (2.14) | 1355.06 | 4.28 | 1.25 (0.66-2.39) | .4927 |
| 1-2 y | 397 | 14 (3.53) | 386.77 | 3.62 | 2635 | 92 (3.49) | 2581.21 | 3.56 | 1.04 (0.59-1.82) | .8963 |
| 2-3 y | 378 | 13 (3.44) | 365.10 | 3.57 | 2527 | 82 (3.24) | 2469.55 | 3.32 | 1.02 (0.56-1.89) | .9305 |
| Age | ||||||||||
| ≤60 | 204 | 28 (13.72) | 540.29 | 5.18 | 1221 | 55 (4.50) | 3543.79 | 1.55 | 3.34 (2.12-5.26) | <.0001 |
| 61-69 | 136 | 25 (18.38) | 343.38 | 7.28 | 821 | 103 (12.55) | 2276.78 | 4.52 | 1.61 (1.04-2.49) | .0328 |
| ≥70 | 124 | 38 (30.65) | 283.69 | 13.39 | 742 | 122 (16.44) | 1935.90 | 6.30 | 2.13 (1.48-3.06) | <.0001 |
| Sex | ||||||||||
| Male | 265 | 54 (20.38) | 660.82 | 8.17 | 1590 | 154 (9.69) | 4406.03 | 3.50 | 2.34 (1.71-3.19) | <.0001 |
| Female | 199 | 37 (18.59) | 506.55 | 7.30 | 1194 | 126 (10.55) | 3350.43 | 3.76 | 1.94 (1.35-2.80) | .0004 |
| Comorbidity | ||||||||||
| Hypertension | 177 | 40 (22.60) | 439.15 | 9.11 | 1062 | 152 (14.31) | 2873.64 | 5.29 | 1.72 (1.22-2.44) | .0022 |
| Diabetes | 104 | 24 (23.08) | 253.80 | 9.46 | 415 | 67 (16.14) | 1096.94 | 6.11 | 1.55 (0.97-2.47) | .0662 |
| Hyperlipidemia | 48 | 11 (22.92) | 121.08 | 9.08 | 256 | 29 (11.33) | 708.75 | 4.09 | 2.22 (1.11-4.44) | .0243 |
| Renal disease | 21 | 5 (23.81) | 48.83 | 10.24 | 72 | 14 (19.44) | 164.60 | 8.51 | 1.20 (0.43-3.34) | .7216 |
| None of above | 236 | 41 (17.37) | 598.93 | 7.07 | 1543 | 108 (7.00) | 4395.50 | 2.47 | 2.79 (1.94-3.99) | <.0001 |
b P value was calculated based on Poisson regression, except as noted.
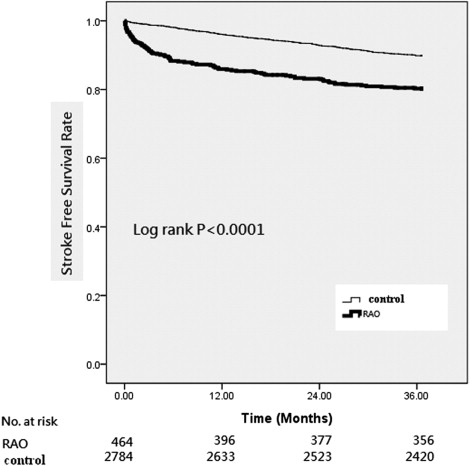
The risk of developing a stroke was particularly high in the first immediate month (IRR 9.46, 95% CI = 4.94-18.1, P < .0001) and 1 to 6 months (IRR 5.57, 95% CI = 3.45-9.00, P < .0001) after RAO occurred. Thereafter, the incidence rate was similar in both groups ( Table 2 ). Kaplan-Meier survival analyses for the stroke-free survival rate show that RAO patients had about a 20% higher accumulated incidence of stroke than did controls within 12 months ( Figure ). Log-rank tests consistently showed that RAO patients had significantly lower stroke-free survival rates than did controls for the total study population ( P < .0001) during the 3-year follow-up period ( Figure ).
Most of the strokes in both groups were ischemic: 65 of 91 strokes (71.43%) in the RAO group and 173 of 280 strokes (61.79%) in the control group; only 7 RAO group (7.69%) and 21 control group strokes (7.50%) were hemorrhagic. Besides, 10 of the 91 RAO strokes (11.00%) and 53 of the 280 control group strokes (18.93%) were TIA. The 3-year incidences of TIA were 2.16% and 1.90% for RAO and control patients, respectively; there was no significant difference (χ 2 test, P = .8557). However, there were 9 strokes (9.9%) in RAO and 33 strokes (11.8%) in the control group for which we were unable to classify the stroke type. There were no differences in the distribution of each stroke type between these 2 cohorts (χ 2 test, P = .2878) ( Table 2 ).
After the 2 cohorts had been categorized into different age groups, RAO patients ≥70 years old had the highest incidence rate ratio of stroke, 13.39 per 100 PY, during the 3-year follow-up period. They were followed by RAO patients 61 to 69 years old, who had an incidence rate ratio of 7.28 per 100 PY. All RAO age groups had higher incidence rate ratios than their control counterparts ( Table 2 ). RAO patients ≤60 years old in particular had an exceptionally higher (3.34 times higher) incidence rate ratio than their control counterparts did (IRR = 3.34, 95% CI = 2.12-5.26, P < .0001).
Male RAO patients had a stroke incidence rate ratio of 8.17 per 100 PY, whereas male controls had a rate ratio of only 3.50 per 100 PY (IRR = 2.34, 95% CI = 1.71-3.19, P < .0001). The difference was also significant between female RAO patients and female controls (IRR = 1.94, 95 % CI = 1.48-3.06, P = .0004).
RAO patients comorbid with hyperlipidemia (20.17 per 100 PY), diabetes mellitus (17.07 per 100 PY), and hypertension (12.54 per 100 PY) had significantly higher incidence rate ratios of stroke than did control patients comorbid with the same disease. However, RAO patients comorbid with renal disease, atherosclerosis, and atrial fibrillation did not have a significantly higher risk of stroke than controls did. RAO patients who did were not comorbid with the aforementioned disorders still had a 2.79 (95% CI = 1.94-3.99) times higher rate of stroke than control patients not having those disorders ( Table 2 ).
We then subcategorized RAO into CRAO and BRAO (including partial RAO). CRAO patients had a significantly higher stroke incidence than BRAO and control groups in the 3-year period ( Table 3 ). The IRR was 2.71 (95% CI = 1.81-4.06) for CRAO to their matched controls, 1.97 (95% CI = 1.47-2.64) for BRAO to their matched controls, and 1.95 (95% CI = 1.27-3.00) for CRAO to BRAO.
| Characteristic | CRAO vs Control | BRAO vs Control | CRAO vs BRAO | ||||||||||||
|---|---|---|---|---|---|---|---|---|---|---|---|---|---|---|---|
| N | Stroke, n (%) | N | Stroke, n (%) | IRR (95% CI) | N | Stroke, n (%) | N | Stroke, n (%). | IRR (95% CI) | N | Stroke, n (%). | N | Stroke, n (%) | IRR (95% CI) | |
| Total | 115 | 32 (27.8) | 690 | 88 (12.8) | 2.71 a (1.81-4.06) | 349 | 59 (16.9) | 2094 | 192 (9.17) | 1.97 a (1.47-2.64) | 115 | 32 (27.8) | 349 | 59 (16.9) | 1.95 a (1.27-3.00) |
| Ischemia | 24 (75.0) | 73 (56.8) | P = .2048 | 41 (69.5) | 123 (64.1) | P = .7478 | 24 (75.0) | 41 (69.5) | P = .9500 | ||||||
| Hemorrhage | 2 (6.2) | 8 (9.1) | 5 (8.5) | 13 (6.8) | 2 (6.2) | 5 (8.5) | |||||||||
| Unspecified | 3 (9.4) | 7 (8.0) | 6 (10.1) | 26 (13.5) | 3 (9.4) | 6 (10.1) | |||||||||
| TIA | 3 (9.4) | 23 (26.1) | 7 (11.9) | 30 (15.6) | 3 (9.4) | 7 (11.9) | |||||||||
| Age | |||||||||||||||
| ≤60 | 41 | 11 (26.8) | 246 | 14 (5.7) | 5.82 a (2.64-12.8) | 163 | 17 (10.4) | 975 | 41 (4.2) | 2.64 a (1.50-4.65) | 41 | 11 (26.8) | 163 | 17 (10.4) | 3.02 a (1.41-6.45) |
| 61-69 | 32 | 7 (21.9) | 198 | 27 (13.6) | 1.95 (0.85-4.47) | 104 | 18 (17.3) | 623 | 76 (12.2) | 1.51 (0.91-2.53) | 32 | 7 (21.9) | 104 | 18 (17.3) | 1.45 (0.61-3.47) |
| ≥70 | 42 | 14 (33.3) | 246 | 47 (19.1) | 2.21 a (1.22-4.02) | 82 | 24 (29.3) | 496 | 75 (15.1) | 2.10 a (1.33-3.32) | 42 | 14 (33.3) | 82 | 24 (29.3) | 1.34 (0.69-2.58) |
| Sex | |||||||||||||||
| Male | 65 | 20 (30.8) | 300 | 39 (13.0) | 3.24 a (1.92-5.44) | 200 | 34 (17.0) | 894 | 105 (8.8) | 2.06 a (1.40-3.02) | 65 | 20 (30.8) | 200 | 34 (17.0) | 2.30 a (1.33-4.00) |
| Female | 50 | 12 (24.0) | 390 | 49 (12.6) | 2.13 a (1.11-4.06) | 149 | 25 (16.8) | 1200 | 87 (9.7) | 1.87 a (1.20-2.92) | 50 | 12 (24.0) | 149 | 25 (16.8) | 1.55 (0.78-3.10) |
| Comorbidity | |||||||||||||||
| Hypertension | 44 | 13 (29.6) | 264 | 45 (17.1) | 2.12 a (1.14-3.93) | 133 | 27 (20.3) | 798 | 107 (13.4) | 1.60 a (1.05-2.43) | 44 | 13 (29.6) | 133 | 27 (20.3) | 1.73 (0.89-3.35) |
| Diabetes | 17 | 6 (35.3) | 105 | 21 (20.0) | 2.46 (0.99-6.10) | 87 | 18 (20.7) | 310 | 46 (14.8) | 1.45 (0.84-2.49) | 17 | 6 (35.3) | 87 | 18 (20.7) | 2.29 (0.91-5.76) |
| Hyperlipidemia | 11 | 4 (36.4) | 54 | 7 (13.0) | 3.88 a (1.14-13.3) | 37 | 7 (18.9) | 202 | 22 (10.9) | 1.80 (0.77-4.20) | 11 | 4 (36.4) | 37 | 7 (18.9) | 2.59 (0.75-8.84) |
| Renal disease | 7 | 1 (14.3) | 26 | 6 (23.1) | 0.61 (0.07-5.05) | 14 | 4 (28.6) | 46 | 8 (17.4) | 1.62 (0.48-5.37) | 7 | 1 (14.3) | 14 | 4 (28.6) | 0.51 (0.06-4.60) |
| None of above | 61 | 16 (26.2) | 384 | 33 (8.6) | 3.83 a (2.11-6.94) | 175 | 25 (14.3) | 1159 | 75 (6.5) | 2.39 a (1.52-3.76) | 61 | 16 (26.2) | 175 | 25 (14.3) | 2.15 a (1.15-4.03) |
Stay updated, free articles. Join our Telegram channel

Full access? Get Clinical Tree


