Purpose
To assess the reliability of manual choroidal thickness measurements by comparing different posterior boundary definitions of the choroidal-scleral junction on enhanced depth imaging optical coherence tomography (EDI-OCT).
Design
Reliability analysis.
Methods
Two graders marked the choroidal-scleral junction with segmentation software using different posterior boundaries: (1) the outer border of the choroidal vessel lumen, (2) the outer border of the choroid stroma, and (3) the inner border of the sclera, to measure the vascular choroidal thickness (VCT), stromal choroidal thickness (SCT), and total choroidal thickness (TCT), respectively. Measurements were taken at 0.5-mm intervals from 1.5 mm nasal to 1.5 mm temporal to the fovea, and averaged continuously across the central 3 mm of the macula. Intraclass correlation coefficient (ICC) and coefficient of reliability (CR) were compared to assess intergrader and intragrader reliability.
Results
Choroidal thickness measurements varied significantly with different posterior boundaries ( P < .001 for all). Intergrader ICCs were greater for SCT (0.959–0.980) than for TCT (0.928–0.963) and VCT (0.750–0.869), even in eyes where choroidal-scleral junction visibility was <75%. Intergrader CRs were lower for SCT (41.40–62.31) than for TCT (61.13–74.24) or VCT (72.44–115.11). ICCs and CRs showed greater reliability for averaged VCT, SCT, or TCT measurements than at individual locations. Intragrader ICCs and CRs were comparable to intergrader values.
Conclusions
Choroidal thickness measurements are more reproducible when measured to the border of the choroid stroma (SCT) than the vascular lumen (VCT) or sclera (TCT).
The choroidal vasculature is difficult to visualize on conventional spectral-domain optical coherence tomography (SD-OCT) owing to its posterior location and light scatter from the retinal pigment epithelium (RPE). Enhanced-depth imaging OCT (EDI-OCT) is an imaging technique that provides better visualization of the choroid by positioning the zero-delay line at a more posterior location. Since Spaide and associates’ description of the technique in 2008, more than 700 citations have been published in biomedical literature using EDI-OCT to measure choroidal thickness in various conditions. Choroidal thickness changes have been described in age-related choroidal atrophy, pachychoroid spectrum conditions like central serous chorioretinopathy, and choroidal inflammatory diseases including Vogt-Koyanagi-Harada syndrome. Choroidal thinning has also been implicated in age-related macular degeneration, diabetic retinopathy, and retinal vein occlusions and as a consequence of anti–vascular endothelial growth factor (anti-VEGF) therapy.
In contrast to retinal thickness measurements, however, there is a lack of widely available algorithms for measuring choroidal thickness, resulting in a variety of nonstandardized manual and automated methods for choroidal thickness measurements that are difficult to compare. Much of the difficulty in achieving reliable choroidal thickness measurements is attributable to the variable and often obscure appearance of the choroidal-scleral junction (CSJ) that determines the posterior boundary of the choroid. While some studies appear to use the border of the choroidal vascular lumen as the posterior boundary, others defined the border of the choroid stroma or sclera as the CSJ. In some individuals, there is also a hyporeflective band corresponding to the suprachoroidal layer, which may further contribute to variability in choroidal thickness measurements. We have shown previously that choroidal thickness measurements can vary significantly using different definitions of the CSJ as posterior boundaries, including (1) the inner border of the choroidal vessel lumen; (2) the outer border of the choroid stroma; and (3) the inner border of the sclera. The purpose of this study is to determine which of these posterior boundary definitions are most reproducible, to standardize the definition of the CSJ for measuring choroidal thickness, and to improve the reliability of choroidal thickness measurements in future clinical and research studies.
Methods
Subject and Eye Selection
A retrospective, cross-sectional analysis was performed on 91 normal eyes of 91 patients who underwent EDI-OCT imaging at the UC Davis Eye Center. This study was approved by the Institutional Review Board of University of California, Davis and was conducted in accordance with the tenets of the Declaration of Helsinki. Subjects were identified from a database search of all patients seen on the Vitreoretinal service at UC Davis between September 1, 2014, and October 31, 2015. Study eyes were selected if they had a normal ophthalmologic examination and EDI-OCT imaging, including (1) eyes evaluated for possible macular pathology, but in which no abnormalities were found; (2) eyes with mild vitreomacular interface abnormalities, such as epiretinal membranes or vitreomacular traction without distortion of the outer retina; and (3) contralateral eyes in cases of unilateral ocular pathologies that are not known to affect choroidal thickness, such as retinal tear or retinal detachment. Exclusion criteria for study eyes include any retinal or choroidal disease beyond mild vitreomacular interface abnormalities, history of vitreoretinal surgery, and myopia greater than −6 diopters (D) spherical equivalent. Only 1 eye from each subject was included for analysis. If both eyes qualified based on inclusion and exclusion criteria, the eye with the best-corrected visual acuity (BCVA) was selected. If BCVA was equal between the 2 eyes, the right eye was selected for patients with an even-number birth month and the left eye was selected for an odd-number birth month. For all study eyes, images were obtained from the subject’s first visit at which they had EDI-OCT imaging. Charts were also reviewed to collect demographic and clinical data, including age, sex, BCVA (logMAR), refractive error (D), intraocular pressure (mm Hg), and lens status (phakic, pseudophakic, or aphakic).
Choroidal Thickness Measurements
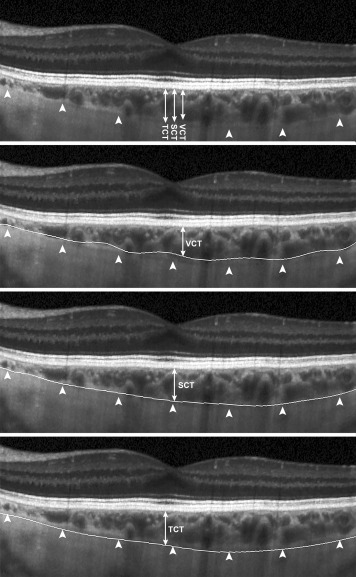
EDI-OCT images were obtained using the Spectralis SD-OCT unit (Heidelberg Engineering, Heidelberg, Germany), and were performed by trained ophthalmic photographers at the UC Davis Eye Center. A single 30-degree horizontal line scan (approximately 9 mm), centered on the fovea, taken in either high-speed EDI-mode (768 A-scans per B scan) or high-resolution EDI-mode (1536 A-scans per B-scan) was selected for analysis. Using the eye-tracking Automatic Real-Time (ART) mode in Spectralis, up to 100 frames were captured per image, with an average of 75.08 ± 23.38 frames per image. EDI-OCT images were exported from Heidelberg Eye Explorer software (version 1.8.6.0) to the Duke Optical Coherence Tomography Retinal Analysis Program (DOCTRAP, version 62.0), a custom image segmentation software designed using MATLAB (Mathworks) for semi-automated segmentation and CSJ tracing. For all choroidal thickness measurements, the inner boundary was automatically determined by DOCTRAP as the outer border of the hyperreflective line corresponding to the RPE/Bruch membrane complex, while the outer boundary was manually traced across the entire B-scan by 2 independent trained graders (Observer A [V.V.] and Observer B [E.M.]) using 3 different posterior boundaries: (1) the outer border of the choroidal vessel lumen, (2) the outer border of the choroid stroma, and (3) the inner border of the sclera, which were used to determine, respectively, the vascular choroidal thickness (VCT), stromal choroidal thickness (SCT), and total choroidal thickness (TCT), as previously described ( Figure 1 ). Based on these definitions, TCT is distinct from the SCT in eyes where the suprachoroidal layer is visible. DOCTRAP software was used to measure choroidal thickness at the fovea (subfoveal VCT, SCT, and TCT) and at 0.5-mm intervals up to 1.5 mm nasal and 1.5 mm temporal to the fovea. Choroidal thickness was also averaged continuously across the central 3 mm to provide an “averaged” VCT, SCT, and TCT. Choroidal thickness measurements from both graders (Observer A and Observer B) were compared to evaluate intergrader repeatability. One grader repeated the CSJ tracings 1 month later (Observer A and Observer A′) to determine intragrader reliability.
Visibility of the CSJ was also categorized independently by the 2 graders as clear (≥75% CSJ visibility) or unclear (<75% CSJ visibility). The presence of a visible suprachoroidal layer was also determined by the 2 graders. Any disagreements in CSJ visibility or suprachoroidal layer visibility were resolved by open arbitration, and by a senior grader (G.Y.) if an agreement could not be reached. Observers A and B were masked to the other’s measurements, and Observer A was masked to her previous measurements for her second session. All measurements were conducted at a 1:1 pixel ratio.
Statistical Analyses
One-way analysis of variance (ANOVA) with Bonferroni post-tests were used to compare mean choroidal thickness measurements using different posterior boundaries (VCT, SCT, and TCT). Paired t tests were used to compare choroidal thickness measurements between Observers A and B. Multivariate regression analysis was used to determine any independent association of choroidal thickness with age and refractive error. P < .05 was considered to be statistically significant.
Intergrader and intragrader repeatability of choroidal thickness measurements were assessed by intraclass correlation coefficient (ICC) and the Bland-Altman method. The coefficient of repeatability (CR) describes the smallest possible change in choroidal thickness measurements that represents a true change, and was calculated by multiplying the standard deviation of the differences between the 2 measurements by 1.96. The difference between 2 measurements is expected to be less than the CR for 95% of pairs of observations. The upper and lower 95% limits of agreement (LOA) are calculated by adding and subtracting the CR value from the mean difference, respectively. Statistical analyses were performed using STATA statistical software (version 13.0; StataCorp LP, College Station, Texas, USA). Bland-Altman plots and box plots were created with MedCalc for Windows, version 14.8.1 (MedCalc Software, Ostend, Belgium).
Results
Demographics and Clinical Characteristics
A total of 91 normal eyes from 91 subjects with no known retinal or choroidal diseases were included in the analysis. Mean age was 56.8 (range, 10–88 years), with mostly phakic eyes, and similar proportions of male vs female subjects and right vs left eyes ( Table 1 ). Mean BCVA was 0.116 ± 0.156 or Snellen equivalent of 20/26; and mean refractive error was −1.15 ± 2.34 D.
| All Eyes (n = 91) | Eyes With ≥75% CSJ Visible (n = 52) | Eyes With <75% CSJ Visible (n = 39) | |
|---|---|---|---|
| Age (y), mean ± SD | 56.77 ± 17.58 | 58.52 ± 18.03 | 54.44 ± 16.92 |
| Sex (male/female) | 45/46 | 26/26 | 19/20 |
| Eye (right/left) | 45/46 | 26/26 | 19/20 |
| Lens (phakic/pseudophakic) | 81/10 | 46/6 | 35/4 |
| Visual acuity (logMAR), mean ± SD | 0.116 ± 0.156 | 0.125 ± 0.183 | 0.104 ± 0.110 |
| IOP (mm Hg), mean ± SD | 15.41 ± 3.29 | 15.56 ± 3.15 | 15.33 ± 3.48 |
| Refractive error (diopters), mean ± SD | −1.15 ± 2.34 | −1.62 ± 2.57 | −0.625 ± 1.98 |
Choroidal Thickness Measured With Different Posterior Boundaries
Choroidal thickness varied significantly using different posterior boundaries at all locations across the macula ( P < .001 for all). Averaging the measurements made by the 2 observers, mean subfoveal VCT was 208.36 ± 69.68 μm, mean subfoveal SCT was 274.57 ± 78.86 μm, and mean subfoveal TCT was 287.36 ± 75.59 μm ( Figure 2 ). Comparing the 2 observers, there were no significant differences in SCT and TCT measurements between Observers A and B at all locations ( P = .092–.596), except for VCT, which showed small but significant mean differences of 12.38 ± 49.15 to 28.15 ± 58.73 μm between the 2 observers ( P < .001–.018) ( Figure 3 , Left panel).
When continuously averaged across the central 3-mm segment, averaged choroidal thicknesses also varied significantly with different posterior boundaries ( P < .001), with mean averaged VCT of 204.10 ± 58.067 μm, mean averaged SCT of 266.52 ± 75.03 μm, and mean averaged TCT of 279.60 ± 73.50 μm. Again, there was a small but significant difference between the 2 observers in averaged VCT, but not in averaged SCT or TCT ( Table 2 , Figure 3 , Right panel).
| Location | VCT | SCT | TCT | |||||||||
|---|---|---|---|---|---|---|---|---|---|---|---|---|
| Mean (SD) Difference (μm) | P Value | ICC | CR (μm) | Mean (SD) Difference (μm) | P Value | ICC | CR (μm) | Mean (SD) Difference (μm) | P Value | ICC | CR (μm) | |
| 1.5 mm nasal | 24.07 (57.09) | <.001 | 0.786 | 111.90 | −5.74 (27.18) | .119 | 0.973 | 53.27 | −8.59 (35.35) | .227 | 0.953 | 69.29 |
| 1.0 mm nasal | 20.71 (58.51) | <.001 | 0.750 | 114.68 | −4.59 (27.83) | .047 | 0.970 | 54.55 | −3.61 (35.40) | .332 | 0.952 | 69.38 |
| 0.5 mm nasal | 28.15 (58.73) | <.001 | 0.752 | 115.11 | −2.51 (31.47) | .119 | 0.959 | 61.68 | −2.38 (36.61) | .536 | 0.945 | 71.76 |
| Subfoveal | 23.43 (54.07) | <.001 | 0.827 | 105.98 | −4.21 (25.72) | .449 | 0.973 | 50.41 | −2.38 (34.84) | .516 | 0.947 | 68.29 |
| 0.5 mm temporal | 24.07 (53.12) | <.001 | 0.818 | 104.11 | −3.57 (31.79) | .287 | 0.959 | 62.31 | −4.30 (37.82) | .282 | 0.963 | 74.13 |
| 1.0 mm temporal | 21.43 (51.31) | <.001 | 0.823 | 100.57 | −2.64 (24.85) | .314 | 0.972 | 48.71 | −6.93 (36.62) | .074 | 0.934 | 71.78 |
| 1.5 mm temporal | 12.38 (49.15) | <.001 | 0.860 | 96.33 | −3.70 (27.24) | .198 | 0.964 | 53.39 | −7.74 (37.88) | .054 | 0.928 | 74.24 |
| Averaged | 21.65 (36.96) | <.001 | 0.869 | 72.44 | −3.77 (21.12) | .092 | 0.980 | 41.40 | −4.76 (31.19) | .149 | 0.954 | 61.13 |
Prior studies have shown that the choroid becomes thinner with advanced age and myopic refractive error. Consistent with prior results, subfoveal VCT, SCT, and TCT all showed an inverse association with age (VCT: R 2 = 0.112; P = .001; SCT: R 2 = 0.179; P < .001; TCT: R 2 = 0.176; P < .001), and a positive association with refractive error (VCT: R 2 = 0.092; P = .031; SCT: R 2 = 0.117; P = .014; TCT: R 2 = 0.129; P = .010). Hence, though the 3 posterior boundaries measure choroidal thickness differently, all 3 measurements reflect known physiologic associations of choroidal thickness.
Reliability of Choroidal Thickness Measurements
Overall, all intergrader and intragrader ICC values were greater than 0.75, indicating good repeatability of choroidal thickness measurements using all 3 posterior boundaries. Intergrader ICCs were greater for SCT (0.959–0.980) than for TCT (0.928–0.963) or VCT (0.750–0.869) at all locations including the fovea ( Table 2 ). Intragrader ICC was also greater for SCT (0.967–0.987) than for TCT (0.912–0.949) or VCT (0.915–0.967) at these locations ( Supplemental Table 1 ; Supplemental Material available at AJO.com ). When choroidal thickness measurements were continuously averaged across the central macula (averaged VCT, SCT, and TCT), both intergrader and intragrader ICCs showed better repeatability than individual locations ( Table 2 , Supplemental Table 1 ).
The CR is another estimate of the reliability of choroidal thickness measurements, and represents the smallest possible change in choroidal thickness measurements that represents true change. Consistent with the ICC results, both intergrader and intragrader CRs were lower for SCT (30.77–62.31 μm) than for TCT (50.21–75.17 μm) or VCT (41.14–115.11 μm), and when averaged across the macula (30.77–72.44 μm) than at individual locations (32.87–115.11 μm) ( Table 2 , Supplemental Table 1 ).
Intragrader ICCs and CRs followed the same trends as intergrader values, but intragrader ICCs were greater than intergrader ICCs, and intragrader CRs were lower than intergrader CRs ( Supplemental Table 1 ).
Bland-Altman plots demonstrate that choroidal thickness measurements generally lie within the 95% limits of agreement except for VCT, which also showed larger limits of agreement compared to SCT and TCT ( Figure 4 , Supplemental Figure ; Supplemental Material available at AJO.com ). An outlier in TCT measurements was noted to arise from the inclusion of a deep hyporeflective space near the fovea likely representing a short posterior ciliary vessel in the segmentation by 1 observer for only the TCT measurement, but not the other measurements. Intergrader and intragrader analyses also showed greater variance between observers and between sessions as choroidal thickness increased, as previously demonstrated. This phenomenon is likely owing to the decrease in signal transmission through thicker choroids, resulting in a less distinct CSJ.
Stay updated, free articles. Join our Telegram channel

Full access? Get Clinical Tree


