Purpose
To evaluate the effect of macular reticular pseudodrusen on retinal function using multiple imaging methods.
Design
Prospective cross-sectional study.
Methods
Thirteen eyes with reticular pseudodrusen, but without any other macular abnormality or glaucoma, and 20 normal eyes were evaluated. All subjects underwent color fundus photography, infrared reflectance (IR), fundus autofluorescence (FAF), and microperimetry.
Results
The similarity in the number of reticular pseudodrusen was evaluated through inter-observer intraclass correlation coefficients, which ranged from 0.852-0.944. IR could detect reticular pseudodrusen within the center circle area in 12 eyes, whereas blue-channel fundus photography and FAF could only detect these lesions in 1 and 3 eyes, respectively. The number of reticular pseudodrusen correlated among the different imaging modalities ( P < .001 for all) for all areas of the macula, except the center. The mean retinal sensitivity in eyes with reticular pseudodrusen was lower in all areas of the macula, compared with normal eyes ( P < .001 for all). The number of reticular pseudodrusen correlated with retinal sensitivity in all areas by IR imaging ( P = .003, P < .001, P = .003 for center, inner ring, outer ring, respectively), in the inner and outer rings by blue-channel fundus photography ( P < .001 for both), and in the inner and outer rings by FAF ( P < .001 and P = .001, respectively).
Conclusions
Although multiple imaging modalities are capable of quantifying reticular pseudodrusen, IR appears to have the best ability to do so as compared to blue-channel photography and FAF. The distribution and number of reticular pseudodrusen lesions are closely associated with retinal sensitivity.
Reticular pseudodrusen were first identified as distinctive yellowish patterns in the macula of patients with age-related macular degeneration (AMD) by using blue-light fundus photography. Arnold and associates described a yellowish interlacing network of oval or roundish lesions, termed reticular pseudodrusen, with a diameter of 125-250 μm that were detected in red-free fundus photography. Recently, reticular pseudodrusen have been recognized as an additional distinctive morphologic feature of AMD. Several reports have suggested that reticular pseudodrusen are associated with a high risk of progression to late-stage AMD.
The development of new imaging methods, such as confocal scanning-laser ophthalmoscopy (SLO) and spectral-domain optical coherence tomography (SDOCT), has led to the determination of the exact location of reticular pseudodrusen and to additional insight into its pathogenesis. Using SDOCT, several researchers have suggested that the hyperreflective material above the retinal pigment epithelium (RPE) may alter photoreceptor structures in eyes with reticular pseudodrusen, implying that reticular pseudodrusen may have an influence on retinal function. However, understanding of the relationship between reticular pseudodrusen and retinal function has been limited, and further investigation for comprehending such relationship is required.
The purpose of this study was to evaluate the effect of the presence of macular reticular pseudodrusen on retinal function by using multiple imaging methods, including fundus photography, infrared reflectance (IR), fundus autofluorescence (FAF), and fundus-monitoring microperimetry (MP). Although several terminologies have been used to describe this clinical feature, we use the term “reticular pseudodrusen” according to the nomenclature promoted by Arnold and associates.
Methods
All of the study investigations adhered to the tenets of the Declaration of Helsinki, and this study was approved by the Institutional Review Board and the Ethics Committee of Kyoto University Graduate School of Medicine. The nature of the study, the implications of participating in this research study, and its possible consequences were explained to the study candidates, after which a written informed consent was obtained from all participants.
Participants
Candidates in this prospective cross-sectional study were patients with reticular pseudodrusen, but without any other macular abnormality or glaucoma, who visited the Kyoto University Hospital, Kyoto, Japan, between February 2011 and March 2013, as well as healthy volunteers.
All of the patient eyes had already been classified as having reticular pseudodrusen on the basis of the appearance of reticular patterns in at least 2 imaging modalities, including the blue-channel images obtained using color fundus photography, IR, FAF, indocyanine green angiography, and SDOCT. Eyes with conventional drusen (hard/soft drusen), cuticular drusen, pigment epithelial detachment, serous retinal detachment, choroidal neovascularization (ie, neovasucular AMD, polypoidal choroidal vasculopathy, and retinal angiomatous proliferation), or geographic atrophy were excluded from this study. Eyes with other macular abnormalities (ie, pathologic myopia, idiopathic choroidal neovascularization, angioid streaks, other secondary choroidal neovascularization, central serous chorioretinopathy, epiretinal membranes, or retinal arterial macroaneurysms) or any history or signs of retinal surgery, including laser treatment, were also excluded from this study.
Multimodal Imaging Methods
All subjects underwent a complete ophthalmologic examination, including measurement of best-corrected visual acuity (BCVA), determination of intraocular pressure, indirect ophthalmoscopy, slit-lamp biomicroscopy with a noncontact lens, color fundus photography, IR, FAF, and MP during the same visit.
Color fundus photographs (field, 40 degrees) were obtained digitally using a Topcon TRC NW6S nonmydriatic retinal camera (Topcon, Tokyo, Japan) after medical dilation of the pupil (phenylephrine, 0.5% and tropicamide, 0.5%). To examine the blue-channel images, ImageJ software (National Institutes of Health, Bethesda, Maryland, USA) was used to display the individual color channels (red, green, and blue) of the photographs. Adjustment was performed automatically by using the ImageJ software before grading. IR and FAF images were acquired using a confocal SLO (Spectralis HRA+OCT; Heidelberg Engineering, Heidelberg, Germany). The IR images were obtained using a light stimulus at a wavelength of 820 nm. The FAF images were obtained using an excitation light with a wavelength of 488 nm and a barrier filter beginning at 500 nm. The field of view was set to 30 × 30 degrees, centered on the macula. Adjustment of brightness and contrast for IR and FAF images was performed automatically by using the ImageJ software before grading.
The quality of each image was evaluated by an experienced observer and only eyes with adequate image quality from each imaging modality were included.
Quantification of the Reticular Pseudodrusen
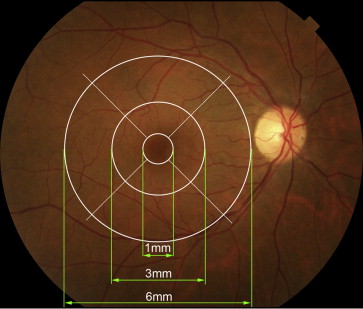
In the blue-channel contrast-enhanced color fundus photography, the reticular pattern was identified as light flecks. Reticular IR was defined as a group of hyporeflectant or halo-like (hyperreflectant lesions surrounded by hyporeflective rings) lesions against a background of mild hyperreflectance. Reticular autofluorescence was defined as a group of hypofluorescent or halo-like lesions against a background of mildly elevated AF. The number of flecks in the blue-channel fundus photography images, hyporeflectant or halo-like lesions on IR, and hypoautofluorescent or halo-like lesions on FAF in 9 separate macular areas (based on the Early Treatment Diabetic Retinopathy Study [ETDRS] sectors [ Figure 1 ]) were determined by 2 experienced observers using a cell-count tool built into ImageJ. The center of the fovea was determined to be the center of the foveal avascular zone on each image, before grading. The numbers of each lesion were determined as the mean of the number determined by the 2 graders; if the values reported were significantly different between the graders, a third grader was invited to determine the number of lesions and the value closest to that determined by the third grader was selected.
Microperimetry
We used fundus-monitoring MP to measure retinal sensitivity. MP-1 software (NIDEK, Padova, Italy) was set to automatically track eye movements and to evaluate every acquired frame for shifts in the directions of the x and y axes of the fundus, with respect to a reference image obtained by an infrared camera at the beginning of the examination.
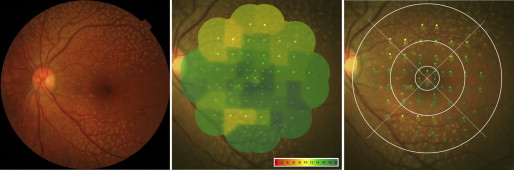
We used a 4-2-staircase strategy with Goldmann size III stimuli against a white background with an illumination of 1.27 cd/m 2 to examine 57 stimulus locations covering the central 20 degrees (designed to probe photopic vision). Differential luminance, defined as the difference between the stimulus luminance and the background luminance, was 127 cd/m 2 at 0-dB stimulation, and the maximum stimulus attenuation was 20 dB; the stimulus duration was 200 ms. The mean retinal sensitivity was calculated in 9 separate areas, based on ETDRS sectors, within the macula ( Figure 2 ). Retinal sensitivity on the border between sectors was included in the counterclockwise sector.
Statistical Analyses
BCVA, measured using the Landolt chart, was expressed as the Snellen equivalent or the logarithm of the minimal angle of resolution (logMAR). For inter-observer measurements, 2-way mixed, average measure intraclass correlation coefficients (ICC [3, K]) were obtained. For comparing the variables among areas, the Bonferroni correction was used. We calculated the Pearson product moment correlation coefficient to determine associations between mean retinal sensitivity and the number of reticular pseudodrusen in each sector. All statistical evaluations were performed in SPSS v.17 (SPSS, Chicago, Illinois, USA). Significance was defined as P < .05.
Results
Fifteen consecutive eyes with reticular pseudodrusen but without any other macular abnormality or glaucoma were examined. Among them, 2 eyes were excluded because of the poor image quality. Thus 13 eyes from 10 patients were included in this study. Twenty normal eyes in 20 subjects were included as control. The ages of the subjects ranged from 55-86 years (mean ± SD, 71.6 ± 9.4 years) for patients with reticular pseudodrusen and from 65-79 years (mean ± SD, 70.2 ± 4.8 years) for normal volunteers ( P = .200).
The BCVA of patients with reticular pseudodrusen ranged from 20/32-20/12 (mean logMAR = −0.04 ± 0.10), and 11 eyes (85%) had BCVA ≥ 20/20. The spherical equivalent refractive error ranged from −1.25 to +1.75 diopter.
The reproducibility of the determination of the number of reticular pseudodrusen (the light flecks in blue-channel fundus photographs, the hyporeflectant or halo-like lesions in IR images, and the hypofluorescent or halo-like lesions in FAF images) was evaluated through an inter-observer ICC; the ICC ranged from 0.852-0.944. The ICCs of each region, obtained by each imaging method, are shown in Table 1 and the Supplemental Table (available at AJO.com ) (using log values).
| Imaging | Inter-observer Intraclass Correlation Coefficients | ||
|---|---|---|---|
| Center | Inner Ring b | Outer Ring b | |
| Fundus photography a | 0.919 | 0.852 | 0.854 |
| IR | 0.930 | 0.939 | 0.944 |
| FAF | 0.906 | 0.923 | 0.920 |
a Blue channel of fundus photography.
b Center, central fovea (1 mm); Inner ring, 1-3 mm from the central fovea; outer ring, 3-6 mm from the central fovea.
The mean numbers of reticular pseudodrusen in each macular ETDRS sector are shown in Table 2 . Reticular pseudodrusen were most frequently detected in the superior area by each modality ( Figure 3 ). In the outer ring, the reticular pseudodrusen were found in greater numbers in the superior side than in the temporal side ( P = .039, P = .020, and P < .001 for blue-channel fundus photography, IR, and FAF, respectively, with Bonferroni correction), the inferior side ( P = .081, P = .044, and P = .001 for blue-channel fundus photography, IR, and FAF, respectively, with Bonferroni correction), or the nasal side ( P = .034, P = .026, and P = .001 for blue-channel fundus photography, IR, and FAF, respectively, with Bonferroni correction). IR could reveal reticular pseudodrusen within the center circle area (1 mm diameter) in 12 eyes (92%), whereas blue-channel fundus photography and FAF could only detect their presence in 1 (8%) or 3 eyes (23%), respectively ( P < .001, χ 2 test; Figure 3 , Table 2 ). The number of reticular pseudodrusen correlated among the different imaging modalities ( P < .001 for all), except for the center area ( Figure 3 , Table 3 ).
| Imaging | Center b | Inner Ring b | Outer Ring b | Whole Macula | ||||||
|---|---|---|---|---|---|---|---|---|---|---|
| Superior | Inferior | Nasal | Temporal | Superior | Inferior | Nasal | Temporal | |||
| Fundus photography a | 1.8 ± 5.7 | 30.0 ± 21.4 | 24.9 ± 28.6 | 18.0 ± 16.1 | 16.4 ± 20.8 | 103.3 ± 65.2 | 42.4 ± 52.2 | 34.3 ± 44.7 | 35.6 ± 45.0 | 306.7 ± 270.2 |
| IR | 12.9 ± 11.5 | 42.2 ± 17.2 | 27.0 ± 21.0 | 29.8 ± 21.9 | 30.0 ± 25.4 | 92.5 ± 41.1 | 47.5 ± 43.6 | 44.3 ± 38.3 | 42.9 ± 40.7 | 369.3 ± 219.1 |
| FAF | 0.5 ± 1.0 | 20.1 ± 13.4 | 17.3 ± 13.1 | 18.5 ± 15.4 | 16.2 ± 14.5 | 78.1 ± 28.3 | 32.7 ± 26.9 | 18.5 ± 15.5 | 30.4 ± 29.0 | 247.7 ± 132.6 |
a Blue channel of fundus photography.
b Center, central fovea (1 mm); inner ring, 1-3 mm from the central fovea; outer ring, 3-6 mm from the central fovea.
| Imaging | Area b | IR | Fundus photography a |
|---|---|---|---|
| Fundus photography a | Center | .343 (0.336) | |
| Inner ring | <.001 (0.798) | ||
| Outer ring | <.001 (0.834) | ||
| FAF | Center | .617 (0.153) | .007 (0.784) |
| Inner ring | <.001 (0.667) | <.001 (0.544) | |
| Outer ring | <.001 (0.882) | <.001 (0.737) |
a Blue channel of fundus photography.
b Center, central fovea (1 mm); inner ring, 1-3 mm from the central fovea; outer ring, 3-6 mm from the central fovea.
Table 4 shows the mean retinal sensitivity in each ETDRS sector. In normal eyes, the mean retinal sensitivity was >16.0 dB in each ETDRS sector, though it was slightly lower in the superior area of the outer ring ( Table 4 ). The mean retinal sensitivity in eyes with reticular pseudodrusen was lower in all areas of the macula, compared with normal eyes ( P < .001 for all). In eyes with reticular pseudodrusen, the mean retinal sensitivity of the whole macula was 12.9 ± 3.9 dB, but the mean retinal sensitivity in the superior side was significantly lower compared with the inferior side ( P = .001, with Bonferroni correction), the temporal side ( P = .006, with Bonferroni correction), and the nasal side ( P = .020, with Bonferroni correction) of the outer ring ( Figures 2 and 3 ).


