Purpose
To assess the intraocular pressure (IOP)-lowering effects and safety of a carteolol/latanoprost fixed combination drug (OPC-1085EL) vs latanoprost (Study 1) and carteolol (Study 2) in patients with primary open-angle glaucoma (POAG) or ocular hypertension (OH).
Design
Multicenter, randomized, evaluator-masked (Study 1)/double-masked (Study 2), parallel-group studies.
Methods
Setting : Twenty-eight clinical sites (Study 1) and 19 clinical sites (Study 2) in Japan. Study Population : Outpatients with bilateral POAG or OH whose predose IOP was 18 to <35 mm Hg in the study eye after 4 weeks’ treatment with latanoprost (Study 1) or carteolol (Study 2) (defined as baseline). Intervention : In Study 1, 237 patients applied OPC-1085EL (n = 118) or latanoprost (n = 119) for 8 weeks. In Study 2, 193 patients applied OPC-1085EL (n = 78), carteolol (n = 78), or carteolol/latanoprost concomitant therapy (n = 37) for 8 weeks. Main Outcome Measure : Adjusted mean IOP reduction at predose from baseline to week 8.
Results
In Study 1, the adjusted mean IOP reductions (95% confidence interval [CI]) were 2.9 (2.5-3.3) mm Hg and 1.6 (1.2-2.0) mm Hg in the OPC-1085EL and latanoprost groups, respectively ( P < .0001). In Study 2, the adjusted mean IOP reductions (95% CI) were 3.5 (3.1-3.9) mm Hg and 1.6 (1.2-2.0) mm Hg in the OPC-1085EL and carteolol groups, respectively ( P < .0001). All adverse drug reactions of OPC-1085EL observed in both studies were mild in severity and only 1 patient in each study discontinued because of an adverse drug reaction.
Conclusions
OPC-1085EL is superior to latanoprost or carteolol alone in terms of lowering IOP, and was well tolerated.
Glaucoma is the second-leading cause of blindness worldwide. Open-angle glaucoma (OAG) is the commonest type of glaucoma, and it is estimated that it will affect around 59 million patients in 2020. Elevated intraocular pressure (IOP) is the primary risk factor for the onset and progression of glaucoma. IOP-lowering treatment is the only therapeutic approach with clear evidence for preventing glaucoma and suppressing its progression.
Patients with glaucoma are often treated with beta blockers or prostaglandin (PG) analogues. Treatment is initiated as monotherapy in the majority of the patients, but poor efficacy or intolerable adverse drug reactions (ADRs) may lead to a change in medication or the addition of a drug with a different mechanism of action. However, concomitant therapies may be inconvenient for patients, fostering poor adherence to treatment. A fixed-combination drug has advantages over concomitant application of single-agent ophthalmic drugs. It can reduce the number of drugs and the frequency of the applications and may improve treatment adherence. Less-frequent application also reduces exposure to potentially harmful preservatives in ophthalmic drugs.
Carteolol hydrochloride is a nonselective beta blocker with intrinsic sympathomimetic activity that reduces IOP with twice-daily (BID) application. It increases blood flow in the fundus and has less impact on the cardiovascular system and respiratory function than timolol maleate. It is also less likely to cause eye irritation and has less impact on blood lipid profiles. Once-daily (QD) carteolol (carteolol LA), which was formulated by adding alginic acid to prolong the IOP-lowering effects, is available in many countries. Latanoprost, a PGF 2α analogue, is widely used for the treatment of glaucoma owing to its strong IOP-reducing activity and good safety profile, and was recently shown to have a visual field-preserving effect in a placebo-controlled trial. Adding carteolol to latanoprost increases the IOP-lowering effect. A fixed-combination treatment of carteolol and a PG analogue represents a new therapeutic option capable of improving convenience and adherence to concomitant therapy. OPC-1085EL is a newly developed ophthalmic solution containing carteolol hydrochloride 2% and latanoprost 0.005%. Because OPC-1085EL contains the same concentration of alginic acid as carteolol LA and the same dose of latanoprost as administered QD, the daily dose of each active ingredient is formulated to be the same as concomitant therapy with carteolol LA and latanoprost. It does not contain benzalkonium chloride, meaning that OPC-1085EL should be safer for the corneal epithelium.
The objectives of the 2 studies reported in this article were to assess the IOP-lowering effects and safety of OPC-1085EL compared with monotherapy with latanoprost (Study 1) or with carteolol LA (Study 2) in patients with primary OAG (POAG; including normal tension glaucoma [NTG]) or ocular hypertension (OH). In Study 2, OPC-1085EL was also compared with carteolol/latanoprost concomitant therapy.
Methods
These were 2 phase 3, multicenter, active-controlled, randomized, evaluator-masked (Study 1)/double-masked (Study 2), parallel-group comparative studies in patients with POAG (including NTG) or OH. The studies were conducted in 28 clinical sites from April 28, 2014 to March 20, 2015 (Study 1) and in 19 clinical sites from April 27, 2014 to January 21, 2015 (Study 2) in Japan. Both studies were performed according to the tenets of the Helsinki Declaration and in compliance with the International Conference on Harmonization Good Clinical Practice and Japanese regulations. Prior to enrollment, written informed consent was obtained from the patients. The informed consent document covered all prospective treatments and study measures; it was not necessary to obtain retrospective consent for any procedures. The informed consent documents and the study protocols were reviewed and approved by the institutional review board of each study site. Both studies were registered on ClinicalTrials.gov (Study 1: NCT02105272 ; Study 2: NCT02105285 ). The list of investigators and participating sites is shown in the Supplemental Materials (available at AJO.com ).
Patients
Outpatients aged 20-80 years with bilateral POAG or OH and with a predose IOP of 18 to <35 mm Hg in the unilateral eye and IOP <35 mm Hg in the contralateral eye at the end of the screening period were eligible. Patients with the following were excluded: (1) best-corrected visual acuity (decimal unit) ≤0.2; (2) hypersensitivity to any ingredients in carteolol or latanoprost ophthalmic drug; (3) nonresponder to beta blockers (Study 1) or PG analogues (Study 2); (4) presence or history of ocular disease, such as progressive retinal disease, severe dry eye, angle closure, ocular infection, endophthalmitis, acute ocular inflammation, corneal foreign body, ocular trauma, herpes keratitis, or corneal ulcer; (5) cataract or intraocular surgery, aphakia, or intraocular lens; and (6) poorly controlled cardiac failure, sinus bradycardia, atrioventricular block, bronchial asthma, severe chronic obstructive pulmonary disease, or poorly controlled diabetes mellitus.
Study Treatments
The study drugs used during the evaluation period were carteolol hydrochloride 2%/latanoprost 0.005% fixed-combination ophthalmic solution (OPC-1085EL) and latanoprost 0.005% (Xalatan; Pfizer Japan Inc, Tokyo, Japan) in Study 1, and OPC-1085EL and carteolol hydrochloride 2% long-acting formulation (Mikelan LA 2%; Otsuka Pharmaceutical Co, Ltd, Tokyo, Japan) and latanoprost 0.005% in Study 2. During the screening period, the run-in drugs (latanoprost in Study 1; carteolol in Study 2) were applied QD in the morning from the day after the screening period started to the last day of the screening period. During the evaluation periods, the study drugs were applied QD in the morning until the end of the last day of the evaluation period from the day after the last day of the screening period.
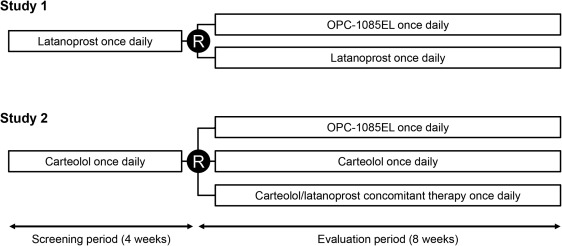
The study designs are shown in Figure 1 . In Study 1, after application of latanoprost during a 4-week screening period, eligible patients were randomized to either OPC-1085EL (OPC group) or latanoprost (LAT group) in a 1:1 fashion and were treated for 8 weeks under evaluator-masked conditions. Patients in the LAT group received latanoprost for a total of 12 weeks from the start of the screening period until the end of the evaluation period. In Study 2, the patients applied carteolol during the screening period and were then randomized to OPC-1085EL (OPC group), carteolol (CAR group), or carteolol/latanoprost concomitant therapy (CAR-LAT group) in a 2:2:1 fashion and were treated for 8 weeks under double-masked conditions for OPC and CAR or under evaluator-masked conditions for CAR-LAT. Patients in the CAR and CAR-LAT groups received CAR for a total of 12 weeks from the start of the screening period until the end of the evaluation period.
During the screening and evaluation periods, the study drug was applied in both eyes, 1 drop, QD, between 9 AM and 11 AM. In the CAR-LAT group in Study 2, carteolol was applied 10 minutes after latanoprost. Patients were instructed to conduct nasolacrimal occlusion to both eyes for 1-5 minutes after application. The study drug was applied ≥10 minutes after any concomitant ophthalmic drug. Concomitant use of any IOP-lowering agents, systemic corticosteroids, topical corticosteroids applied to the eyelids or eyes, and any other drugs that may affect IOP were prohibited. Topical corticosteroids applied elsewhere were permitted. Other prohibited concomitant therapies included ophthalmic surgery and treatment (eg, laser treatment, contact lens).
IOP was measured at the end of the screening period (baseline) and in week 8 of the evaluation period at the following times at both visits: predose (9 AM to 11 AM), 2 hours after dosing, and 8 hours after dosing. IOP was also measured at predose at week 4 after the start of treatment in the evaluation period. The IOP measurement at 8 hours was performed only for patients who consented to this procedure. IOP was measured once at each time point in a sitting position using the Goldmann applanation tonometer after topical anesthesia.
Central randomization was performed to assign patients to each group with a dynamic allocation method that included stratification by center and baseline IOP at predose (18 to <21 mm Hg; 21 to <24 mm Hg; and ≥24 mm Hg). The study drugs were coded based on the randomization list prepared by the controller.
Commercially available latanoprost (Xalatan) was used to ensure its quality. Measures were taken to maintain masking, including implementing procedures for packaging, allocation, supply, and collection of the study drugs; handling of patients; and topical application at the study sites.
Efficacy Parameters
The study eye was defined as the eye with the highest IOP at predose at the end of the screening period, or the right eye if the IOP values of both eyes were equal. The primary endpoint was the adjusted mean IOP reduction at predose from baseline to week 8. Secondary efficacy endpoints included the mean IOP, adjusted mean IOP reduction at each time point at weeks 4 and 8, and the proportions of patients achieving the target IOPs (≤18, ≤16, or ≤14 mm Hg) or the target IOP reductions (≥2, ≥4, or ≥6 mm Hg) at week 8.
Safety Parameters
Safety variables included adverse events (AEs), physical examination findings, subjective ocular symptoms, comfort in the use of the study drug, vital signs (blood pressure, pulse rate), visual acuity, slit-lamp microscopy, fundus examinations, and clinical laboratory tests. AEs were coded using the Medical Dictionary for Regulatory Activities (MedDRA), version 17.0., and were classified as mild (discomfort, but no disruption of normal daily activity), moderate (sufficient discomfort to reduce or affect daily activity), and severe (unable to work or perform normal daily activity). The comfort in the use of the study drug was rated on a 4-point scale by clinical interview: 0: “No problems with application at all”; 1: “Some trouble with application, but no problems”; 2: “Trouble with application, but bearable”; and 3: “Unbearable trouble with application”. ADRs were defined as AEs that occurred during the evaluation period for which a causal relationship with the study drug could not be ruled out.
Statistical Analysis
To determine the sample size in both studies, the difference in IOP reduction between the OPC and LAT groups was assumed to be 1.5 mm Hg and that between the OPC and CAR groups to be 2 mm Hg. The standard deviation for IOP reduction in the 2 studies was estimated to be 3.2 mm Hg. Based on these assumptions, 97 patients per group for Study 1 and 55 per group for Study 2 were required to detect a difference with a 2-sided significance level of .05 and a power of 90%. Moreover, allowing for exclusions, discontinuations, and dropouts, 220 patients (with a ratio for OPC:LAT of 1:1) were required for Study 1 and 175 patients (with a ratio for OPC:CAR:CAR-LAT of 2:2:1; 70, 70, and 35 patients, respectively) for Study 2.
The efficacy population included all randomized patients who received any dose of the study drug, had an IOP measurement at the end of screening, and had at least 1 postbaseline IOP measurement (full analysis set, FAS).
Analysis of covariance was performed to compare the mean IOP and the mean IOP reduction between OPC and LAT (Study 1) and between OPC and CAR (Study 2), with treatment group as a fixed factor and baseline IOP as a covariate. These analyses yielded baseline-adjusted mean changes in IOP. The proportions of patients achieving the target criteria were compared using logistic regression models.
The safety population included all patients who received any dose of the study drug (safety set, SS). The number of patients with AEs was tabulated for each treatment group.
Missing values in the efficacy analyses were imputed using the last-observation-carried-forward (LOCF) approach. Values obtained before topical application of the study drug were not used for imputation. At each visit, for patients with poor compliance with the study drug treatment, categorized as “No application on the day before the visit,” the data at the visit were used in the analysis. For patients with poor compliance with the study drug treatment, categorized as “Visited the site after application on the day of visit,” the data obtained at “2 hours after morning application” and “8 hours after morning application” at the visit were used in the analysis, but the data obtained “predose, before morning application” were excluded.
The SAS software package version 9.2 (SAS Institute Inc, Cary, North Carolina, USA) was used for all analyses.
Results
Study Settings and Patients
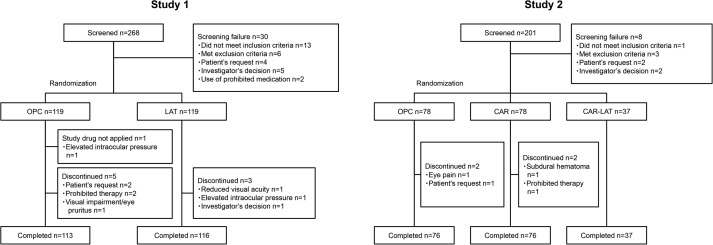
In Study 1, of 238 patients (119 in each group) who were randomized, 237 received the study drugs (118 and 119 in the OPC and LAT groups, respectively), and 229 (113 and 116 in the OPC and LAT groups, respectively) completed the 8-week treatment ( Figure 2 ). In terms of patient characteristics, there were no obvious differences between groups except for sex (significance level: 15%; P = .0661) ( Table 1 ).
| Characteristics | Study 1 | Study 2 | |||||
|---|---|---|---|---|---|---|---|
| OPC | LAT | P Value a | OPC | CAR | P Value a | CAR-LAT | |
| N (%) | N (%) | N (%) | N (%) | N (%) | |||
| Sex | |||||||
| Male | 57 (48.3) | 43 (36.1) | 38 (48.7) | 39 (50.0) | 16 (43.2) | ||
| Female | 61 (51.7) | 76 (63.9) | .0661 b | 40 (51.3) | 39 (50.0) | 1.0000 b | 21 (56.8) |
| Age | |||||||
| Mean ± SD, y | 59.9 ± 11.4 | 60.8 ± 11.5 | .5344 c | 57.9 ± 12.1 | 60.6 ± 10.6 | .1416 c | 56.6 ± 12.8 |
| Diagnosis | |||||||
| POAG | 72 (61.0) | 71 (59.7) | 39 (50.0) | 42 (53.8) | 22 (59.5) | ||
| NTG | 9 (7.6) | 7 (5.9) | 4 (5.1) | 8 (10.3) | 4 (10.8) | ||
| OH | 37 (31.4) | 41 (34.5) | .7964 b | 35 (44.9) | 28 (35.9) | .3414 b | 11 (29.7) |
| Baseline IOP d | |||||||
| ≥18 to <21 mm Hg | 80 (67.8) | 78 (65.5) | 59 (75.6) | 59 (75.6) | 28 (75.7) | ||
| ≥21 to <24 mm Hg | 30 (25.4) | 34 (28.6) | 15 (19.2) | 13 (16.7) | 6 (16.2) | ||
| ≥24 mm Hg | 8 (6.8) | 7 (5.9) | .8613 b | 4 (5.1) | 6 (7.7) | .8109 b | 3 (8.1) |
| Prior medication e | |||||||
| Present | 102 (86.4) | 103 (86.6) | 61 (78.2) | 65 (83.3) | 29 (78.4) | ||
| Absent | 16 (13.6) | 16 (13.4) | 1.0000 b | 17 (21.8) | 13 (16.7) | .5427 b | 8 (21.6) |
a Study 1: OPC vs LAT; Study 2: OPC vs CAR.
In Study 2, 193 patients (78 in each of the OPC and CAR groups and 37 in the CAR-LAT group) were randomized and received the study drugs, and 189 (76 in each of the OPC and CAR groups and 37 in the CAR-LAT group) completed the 8-week treatment ( Figure 2 ). There were no obvious differences in patient characteristics among the 3 groups ( Table 1 ).
Efficacy
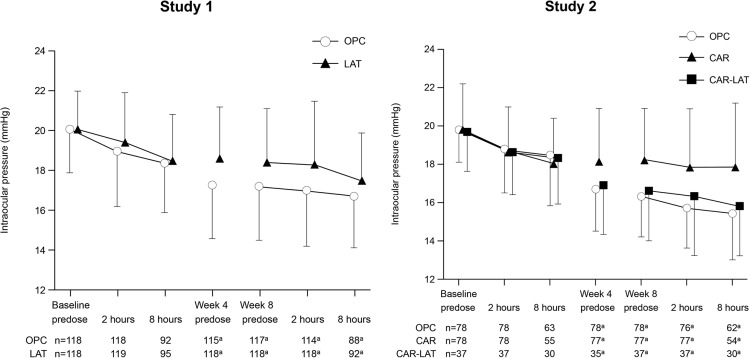
The mean IOPs at each time point are shown in Figure 3 and Table 2 . The mean baseline IOPs at predose and at 2 and 8 hours postdose were similar in both groups in Study 1 and in all 3 groups in Study 2.
| Visit | Time Point | Study 1 | Study 2 | ||||||||
|---|---|---|---|---|---|---|---|---|---|---|---|
| OPC | LAT | OPC | CAR | CAR-LAT | |||||||
| N | IOP, a mm Hg | N | IOP, a mm Hg | N | IOP, a mm Hg | N | IOP, a mm Hg | N | IOP, a mm Hg | ||
| Baseline | Predose | 118 | 20.1 ± 2.2 | 119 | 20.1 ± 1.9 | 78 | 19.8 ± 1.7 | 78 | 19.8 ± 2.4 | 37 | 19.7 ± 2.1 |
| 2 hours | 118 | 19.0 ± 2.8 | 119 | 19.4 ± 2.5 | 78 | 18.8 ± 2.3 | 78 | 18.6 ± 2.4 | 37 | 18.6 ± 2.2 | |
| 8 hours | 92 | 18.4 ± 2.5 | 95 | 18.5 ± 2.3 | 63 | 18.5 ± 2.7 | 55 | 18.0 ± 2.4 | 30 | 18.3 ± 2.4 | |
| Week 4 | Predose | 115 | 17.3 ± 2.7 | 118 | 18.6 ± 2.6 | 78 | 16.7 ± 2.2 | 77 | 18.1 ± 2.8 | 35 | 16.9 ± 2.6 |
| Week 8 | Predose | 117 | 17.2 ± 2.7 | 118 | 18.4 ± 2.7 | 78 | 16.3 ± 2.1 | 77 | 18.2 ± 2.7 | 37 | 16.6 ± 2.6 |
| 2 hours | 114 | 17.0 ± 2.8 | 118 | 18.3 ± 3.2 | 76 | 15.7 ± 2.1 | 77 | 17.8 ± 3.1 | 37 | 16.3 ± 3.1 | |
| 8 hours | 88 | 16.7 ± 2.6 | 92 | 17.5 ± 2.4 | 62 | 15.4 ± 2.4 | 54 | 17.8 ± 3.4 | 30 | 15.8 ± 2.6 | |
Study 1
The adjusted mean IOP reductions (95% confidence interval [CI]) in the OPC and LAT groups at predose at week 8 (primary endpoint) were 2.9 (2.5, 3.3) and 1.6 (1.2, 2.0) mm Hg, respectively. The difference in adjusted mean IOP reduction (95% CI) between the 2 groups (OPC − LAT) was 1.3 (0.7, 1.8) mm Hg ( Table 3 ). The IOP reduction in the OPC group was significantly greater than that in the LAT group at all time points. The reductions in IOP with OPC vs LAT were also reflected in the subgroup analysis ( Table 4 ). The proportions of patients achieving the target criteria (ie, ≤18, ≤16, and ≤14 mm Hg for IOP; or ≥2, ≥4, and ≥6 mm Hg for IOP reduction) at predose at week 8 were significantly greater in the OPC group than in the LAT group ( Table 5 ).
| Study 1 | OPC | LAT | Difference b | P Value c | |||
|---|---|---|---|---|---|---|---|
| Visit | Time Point | N a | IOP Reduction, b mm Hg | N a | IOP Reduction, b mm Hg | ||
| Week 4 | Predose | 115 | 2.7 ± 0.2 (2.3, 3.1) | 118 | 1.5 ± 0.2 (1.1, 1.8) | 1.3 ± 0.3 (0.7, 1.8) | <.0001 |
| Week 8 | Predose | 117 | 2.9 ± 0.2 (2.5, 3.3) | 118 | 1.6 ± 0.2 (1.2, 2.0) | 1.3 ± 0.3 (0.7, 1.8) | <.0001 |
| 2 hours | 114 | 2.1 ± 0.2 (1.7, 2.4) | 118 | 1.0 ± 0.2 (0.6, 1.4) | 1.0 ± 0.3 (0.5, 1.6) | .0003 | |
| 8 hours | 88 | 1.7 ± 0.2 (1.3, 2.1) | 92 | 1.0 ± 0.2 (0.6, 1.3) | 0.7 ± 0.3 (0.2, 1.3) | .0108 | |
| Study 2 | OPC | CAR | Difference b | P Value c | |||
|---|---|---|---|---|---|---|---|
| Visit | Time Point | N a | IOP Reduction, b mm Hg | N a | IOP Reduction, b mm Hg | ||
| Week 4 | Predose | 78 | 3.1 ± 0.2 (2.7, 3.6) | 77 | 1.8 ± 0.2 (1.3, 2.2) | 1.3 ± 0.3 (0.7, 2.0) | <.0001 |
| Week 8 | Predose | 78 | 3.5 ± 0.2 (3.1, 3.9) | 77 | 1.6 ± 0.2 (1.2, 2.0) | 1.9 ± 0.3 (1.3, 2.5) | <.0001 |
| 2 hours | 76 | 2.9 ± 0.2 (2.5, 3.3) | 77 | 0.8 ± 0.2 (0.4, 1.2) | 2.1 ± 0.3 (1.6, 2.7) | <.0001 | |
| 8 hours | 62 | 3.0 ± 0.3 (2.5, 3.6) | 54 | 0.3 ± 0.3 (−0.3, 0.8) | 2.7 ± 0.4 (1.9, 3.5) | <.0001 | |
a Number of subjects with both nonmissing baseline values and nonmissing values at each time point.
b Mean ± standard error (95% confidence interval).
| Characteristics | Study 1 | Study 2 | ||||||
|---|---|---|---|---|---|---|---|---|
| OPC | LAT | OPC | CAR | |||||
| N a | IOP Reduction, b mm Hg | N a | IOP Reduction, b mm Hg | N a | IOP Reduction, b mm Hg | N a | IOP Reduction, b mm Hg | |
| IOP at baseline | ||||||||
| ≥18 to <21 mm Hg | 79 | 2.7 ± 1.7 | 78 | 1.7 ± 2.0 | 59 | 3.3 ± 1.7 | 58 | 1.5 ± 1.7 |
| ≥21 to <24 mm Hg | 30 | 3.1 ± 2.2 | 34 | 1.2 ± 2.3 | 15 | 3.8 ± 2.1 | 13 | 1.6 ± 2.3 |
| ≥24 mm Hg | 8 | 4.5 ± 2.9 | 6 | 3.7 ± 4.9 | 4 | 5.8 ± 3.4 | 6 | 3.0 ± 2.2 |
| Diagnosis | ||||||||
| POAG | 71 | 3.0 ± 2.2 | 70 | 1.5 ± 2.1 | 39 | 3.8 ± 2.0 | 42 | 1.4 ± 1.9 |
| NTG | 9 | 3.7 ± 1.7 | 7 | 2.0 ± 2.1 | 4 | 3.5 ± 1.0 | 7 | 2.3 ± 1.3 |
| OH | 37 | 2.5 ± 1.7 | 41 | 1.7 ± 2.7 | 35 | 3.1 ± 1.9 | 28 | 1.9 ± 2.0 |
a Number of subjects with both nonmissing baseline values and nonmissing values at each time point.
| Target value | Study 1 | Study 2 | ||||
|---|---|---|---|---|---|---|
| OPC (n a = 117) | LAT (n a = 118) | Wald d e χ 2 test | OPC (n a = 78) | CAR (n a = 77) | Wald d e χ 2 test | |
| N b (%) c | N b (%) c | P Value | N b (%) c | N b (%) c | P Value | |
| IOP | ||||||
| ≤18 mm Hg | 88 (75.2) | 66 (55.9) | .0004 | 66 (84.6) | 45 (58.4) | <.0001 |
| ≤16 mm Hg | 47 (40.2) | 27 (22.9) | .0038 | 48 (61.5) | 19 (24.7) | <.0001 |
| ≤14 mm Hg | 18 (15.4) | 8 (6.8) | .0634 | 14 (17.9) | 5 (6.5) | .0313 |
| IOP reduction | ||||||
| ≥2 mm Hg | 89 (76.1) | 61 (51.7) | .0002 | 68 (87.2) | 39 (50.6) | <.0001 |
| ≥4 mm Hg | 42 (35.9) | 25 (21.2) | .0201 | 36 (46.2) | 11 (14.3) | <.0001 |
| ≥6 mm Hg | 10 (8.5) | 4 (3.4) | .2417 | 13 (16.7) | 4 (5.2) | .0215 |
a Number of subjects with both nonmissing baseline values and nonmissing values at each time point.
b Number of subjects who achieved the target value at week 8.
c Percentage of patients with the target value according to the number of patients with IOP data at week 8.
d Logistic regression model: the response variable was set as the proportion, and the fixed effects were baseline intraocular pressure and treatment group.
Study 2
The adjusted mean IOP reductions (95% CI) in the OPC and CAR groups at predose at week 8 (primary endpoint) were 3.5 (3.1, 3.9) mm Hg and 1.6 (1.2, 2.0) mm Hg, respectively. The difference in adjusted mean IOP reduction (95% CI) between the 2 groups (OPC − CAR) was 1.9 (1.3, 2.5) mm Hg ( Table 3 ). The IOP reduction in the OPC group was significantly greater than that in the CAR group at all time points ( P < .0001). The reductions in IOP with OPC vs CAR were also reflected in the subgroup analysis ( Table 4 ). The proportions of patients achieving the target criteria were significantly greater in the OPC group than in the CAR group ( Table 5 ). In addition, the IOP reduction at each time point in the OPC group was similar to that in the CAR-LAT group ( Table 6 ).
| Visit | Time Point | OPC | CAR-LAT | ||
|---|---|---|---|---|---|
| N a | IOP Reduction, b mm Hg | N a | IOP Reduction, b mm Hg | ||
| Week 4 | Predose | 78 | 3.1 ± 2.0 | 35 | 2.7 ± 2.1 |
| Week 8 | Predose | 78 | 3.5 ± 1.9 | 37 | 3.1 ± 2.3 |
| 2 hours | 76 | 2.9 ± 1.8 | 37 | 2.3 ± 2.4 | |
| 8 hours | 62 | 3.1 ± 2.1 | 30 | 2.5 ± 2.4 | |
Stay updated, free articles. Join our Telegram channel

Full access? Get Clinical Tree


