5 Radiographic Evaluation of Pituitary Tumors
Magnetic resonance imaging (MRI) has established itself as the primary imaging modality in the evaluation of the pituitary gland over the last three decades. The superb contrast and excellent spatial resolution of MRI have resulted in its becoming the sole pituitary imaging technology, except when there are contraindications or in instances where bony detail or information regarding the presence of intralesional calcification is needed. Plain film radiography and catheter angiography have markedly limited roles in the evaluation of pituitary pathology.
 Computed Tomography
The role of computed tomography (CT) in the evaluation of pituitary glandular disorders is largely limited to circumstances in which MRI is contraindicated. The CT protocol at our institution for evaluation of the sella is a 0.625-mm helical acquisition following the intravenous (IV) administration of a bolus of contrast media. This data set allows detailed coronal, sagittal, and, if necessary, oblique reformatted images. In an early study of the role of CT in the evaluation of pituitary lesions, Webb et al1 concluded that although CT and MRI were comparable in their ability to detect macroadenomas, MRI offered superior characterization of lesional morphology and surrounding structures. However, CT may provide complementary information on surrounding osseous structures, such as the integrity of the sellar floor,2 and it can confirm calcification in an existing lesion (Fig. 5.1).
 Magnetic Resonance Imaging
To effectively identify and characterize pituitary abnormalities, an MRI examination must consist of high-resolution non-contrast and contrast-enhanced sequences. Fat-suppression techniques may be useful in the evaluation of the postoperative sella but have not been used routinely. At our institution, a complete sella MRI examination consists of noncontrast sagittal and coronal fast spin echo (SE) T1-weighted sequences, a coronal T2-weighted sequence, postcontrast coronal and sagittal T1-weighted sequences, and a postcontrast spoiled gradient sequence, the value of which is discussed below. The precise specifications of MRI protocols vary among scanners, but the objective of providing images with high spatial and contrast resolution is achieved by a combination of thin (3-mm) slices, a small field of view, and a fine matrix size3 to produce images with very small voxels. The coronal noncontrast T1-weighted and T2-weighted images are first reviewed for any abnormalities. It is often possible to identify microadenomas on these images, particularly if narrow window settings are used. The administration of IV gadolinium-based contrast at 0.1 mmol/kg is required to clearly establish the presence of most lesions and define their margins. Several studies have established that IV contrast leads to increased lesional detection.3 However, recent awareness of the risk of nephrogenic systemic fibrosis with gadolinium-based contrast agents has led to a greater degree of prudence in its use. Contrast can be avoided if a lesion is depicted clearly on noncontrast images, and if not identified, administration of half of the standard dose (0.05 mmol/kg)4 may be a useful strategy. The scan should be performed immediately after the contrast injection when not utilized in a dynamic technique. Studies have shown that normalization of pituitary adenomas and normal gland may occur with further delays in imaging.3
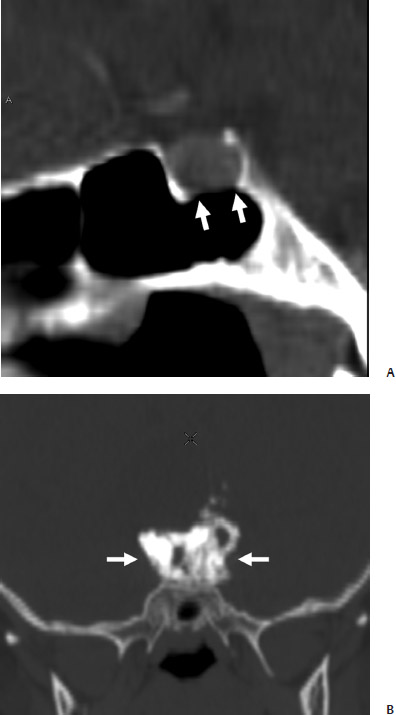
Fig. 5.1 (A) Sagittal reformatted computed tomography (CT) image shows erosion of sellar floor caused by microadenoma (arrows). (B) A densely calcified component of an adamantinomatous craniopharyngioma is evident (arrows).
Although SE sequences are the mainstay of sellar imaging, volumetric spoiled gradient echo sequences have been shown to be of value in the detection of small microadenomas, particularly in the setting of Cushing’s disease. This sequence provides thinner slices, yields better spatial resolution, and enables multiplanar reformations to be performed as the voxel sizes are nearly isotropic.5 Patronas et al6 demonstrated a higher sensitivity for detection of adrenocorticotropic hormone (ACTH) microadenomas with this technique, but also a slightly higher false-negative rate compared with SE imaging.
Dynamic contrast MRI performed immediately after the administration of a bolus of IV contrast may be used as a problem-solving technique when regular imaging is inconclusive, but it is used as a routine imaging tool at some institutions. This technique is based on the principle that lesion conspicuity may be maximized by scanning immediately after administration of contrast, when the lesion and the gland demonstrate differential rates of enhancement due to the differences in their blood supply. A series of coronal T1-weighted images are rapidly acquired through the gland, with a temporal resolution of 1 to 2 seconds being achievable with modern scanners. The source of an adenoma’s blood supply determines when the lesion is most conspicuous. Some are most evident on the unenhanced images and fade on the enhanced images. Others are most evident 30 to 50 seconds after contrast administration and others 1 to 2 minutes later. Addition of a dynamic MRI sequence may increase lesion detection by 10%. It may also be beneficial to add a sagittal acquisition to the standard coronal dynamic study.5,7
 Normal Imaging Anatomy
The pituitary gland exhibits great variability in its dimensions. As a rule of thumb, as measured on a coronal image, the height of the gland is 6 mm in infants and children, 8 mm in men and postmenopausal women, 10 mm in women of childbearing age, and 12 mm in pregnancy and the post-partum state (Elster’s rule of 6, 8, 10, 12).8 In the peripartum period, the gland may demonstrate a prominent superiorly convex contour.
The adenohypophysis on MRI is usually isointense to brain but may appear slightly hyperintense on T1-weighted sequences in pregnant or postpartum women. The neonatal anterior pituitary may be substantially hyperintense on T1-weighted images. This is due to lactotroph hyperplasia and increased protein synthesis. The neurohypophysis is uniformly hyperintense on T1-weighted images (Fig. 5.2). The reason for this “bright spot” has not precisely been determined but is believed to be due to neurophysin, the vasopressin-associated carrier protein. Other contenders include vasopressin itself and phospholipid vesicles that contain vasopressin. The “ectopic” neurohypophysis refers to the displacement of the neurohypophyseal bright spot into the stalk or hypothalamus proximal to the site of stalk injury or disease. The bright spot may be absent in central diabetes insipidus, but it may also not be seen in a small percentage of the normal population (Fig. 5.3). The infundibulum demonstrates a tapered configuration and enhances homogeneously. A normal stalk is less than 4 mm thick. On postcontrast images, the gland enhances homogeneously. On dynamic images, a centrifugal pattern of enhancement from the stalk and posterior pituitary to the central and then peripheral adenohypophysis is observed.5,9
The optic chiasm is consistently demonstrable above the gland on all sequences. The cavernous sinuses are seen as paired parasellar heterogeneous structures. The larger sinusoids within them may appear as flow voids but will enhance following gadolinium administration. The lateral dural reflection of these sinuses is easily visualized, but demonstration of the thin medial dural walls is often problematic. Although the cranial nerves that traverse the lateral walls may be seen on coronal T2-weighted images, the performance of a high-resolution heavily T2-weighted three-dimensional sequence may be the best way to consistently demonstrate them.10 The cavernous internal carotid artery is easily seen as a flow void (Fig. 5.2).
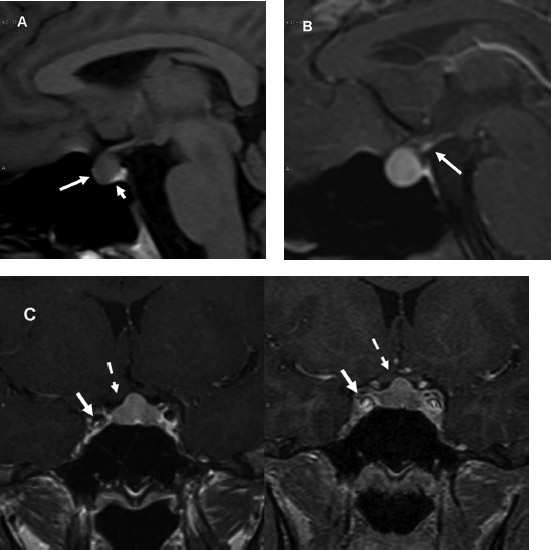
Fig. 5.2 (A) Normal magnetic resonance imaging (MRI) anatomy. Isointense adenohypophysis and hyperintense neurohypophysis (long and short arrows, respectively) are clearly identified on the sagittal unenhanced T1-weighted image. (B) Enhancement and tapered appearance of stalk are evident (arrows). (C) Postcontrast coronal T1-weighted and spoiled gradient (SPGR) images are shown. Note more homogeneous enhancement pattern in the former. The convex superior contour of the gland is normal in this 22-year-old woman. Cavernous internal carotid arteries (solid arrows) and optic chiasm (dashed arrows) are seen.
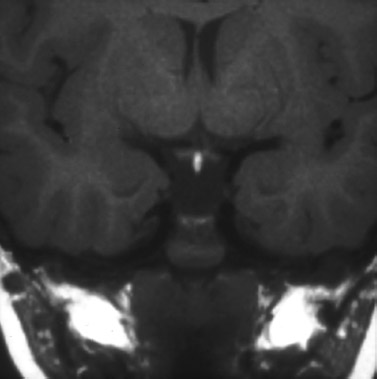
Fig. 5.3 Ectopic neurohypophysis. Transection of infundibulum has resulted in displacement of a “bright spot” of neurohypophysis into the proximal infundibulum.
 Imaging of Pituitary Pathology
Tumors
Microadenomas
T1-weighted coronal sequences are best suited for the identification of microadenomas. Most (80–85%) are hypointense with respect to the remainder of the gland on T1-weighted images. The minority that are isointense are usually evident on postcontrast images. A small fraction are hyperintense due to intratumoral hemorrhage. The appearance on T2-weighted images is more variable and, in general, these lesions are less well seen5,11 (Fig. 5.4).
There is no defining imaging characteristic that enables easy distinction between the different types of microadenomas. However, the distribution of these lesions tends to reflect the distribution of the cell of origin. For example, ACTH-, thyroid-stimulating hormone (TSH)–, and luteinizing hormone/follicle-stimulating hormone (LH/FSH)–producing adenomas tend to occupy the central gland, whereas prolactinomas and growth hormone (GH)–producing adenomas prefer the glandular periphery. GH–producing adenomas have been noted to demonstrate a predilection for infrasellar extension. T2 hypointensity may indicate that a microadenoma is of the densely granulated GH-producing type.12 The smallest microadenomas are often those that produce ACTH.
A deformity of the glandular contour, in the absence of signal abnormality, may indicate the presence of an underlying microadenoma that may reveal itself on postcontrast imaging. Deviation of the infundibulum, however, is a poor radiographic sign. The infundibulum may be deviated without evidence of underlying pathology in cases of developmental asymmetry of the sellar floor or on occasion be deviated toward a lesion. The high incidence of infundibulum deviation in the normal population has been attributed to developmental lateral eccentricity of the pituitary with respect to the midline of the brain and also is due to an ontogenic eccentric insertion of the stalk off the midline in some people. Stalk deviation, therefore, should not be used to support or refute the presence of a microadenoma.13
Most microadenomas enhance to a lesser degree than a normal gland after administration of gadolinium-based contrast. A dynamic method, as described earlier, may be required in those instances when standard MRI is equivocal. Some authors advocate the routine incorporation of a dynamic study into their pituitary protocol. We have rarely found this necessary. As described earlier, a postcontrast spoiled gradient (SPGR) sequence may be useful to reveal small microadenomas not demonstrated on enhanced SE T1-weighted images (Fig. 5.5). The utility of delayed post-contrast imaging, performed 30 to 60 minutes after administration of contrast, where contrast accumulates within the adenoma and has washed out from the normal gland, has also been described.3 This may occasionally allow distinction of otherwise undiscovered adenomas.
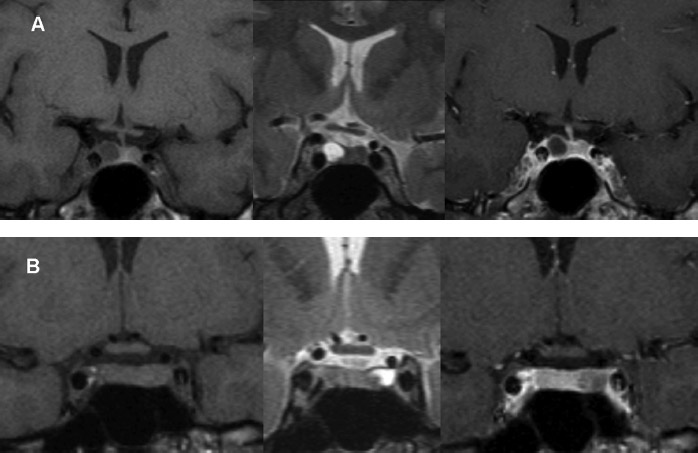
Fig. 5.4 (A) Typical microadenoma. This prolactinoma is hypointense on T1-weighted image (left), hyperintense on T2-weighted image (center) and does not enhance with contrast (right). (B) Adenoma is isointense on T1-weighted imaging (left) and is evident only on T2-weighted (center) and postcontrast sequences (right).
Excellent correlation exists between MRI and intraoperative findings of microadenomas. The high accuracy reported in multiple early studies evaluating the role of MRI has not been refuted. Although the detection of small lesions remains occasionally problematic, the addition of SPGR sequences and the high signal-to-noise ratio obtainable with high field strength MRI units have proven to be extremely beneficial (Fig. 5.6). In circumstances where all noninvasive approaches fail to depict a lesion, the presence of which is strongly suspected clinically, inferior petrosal sinus (IPS) sampling may be necessary. The IPS may be safely catheterized in up to 98% of cases with a complication rate less than 1%. It is an extremely sensitive, specific, and accurate test for diagnosing Cushing’s disease and distinguishing that entity from ectopic ACTH syndrome14 (Fig. 5.7).
It must be noted, however, that not all small intraglandular lesions are microadenomas. Small Rathke’s cleft and pars intermedia cysts may resemble adenomas, especially when filled with proteinaceous fluid. A focal susceptibility artifact in the gland adjacent to the site of insertion of the sphenoid sinus septum may simulate a lesion15 (Fig. 5.8). An expanded posterior clinoid process may also simulate a lesion due to volume averaging. The pituitary gland may have small microinfarctions that could potentially mimic adenomas.
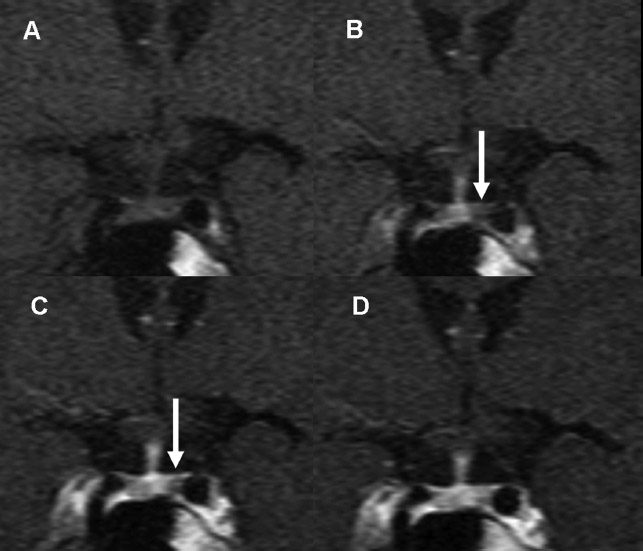
Fig. 5.5 (A–D) Dynamic MRI. On initial unenhanced image, no evidence of microadenoma is seen. On subsequent images, obtained 13 seconds apart, a small peripherally located hypoenhancing adenoma is identified on left side (arrows). (D) The adenoma is barely discernible and is near isointense with the remainder of gland.
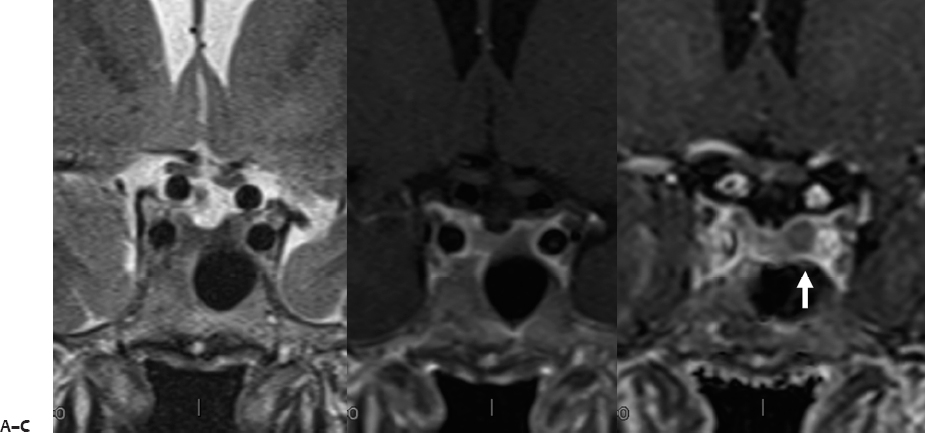
Fig. 5.6 Microadenoma are best demonstrated on spoiled gradient (SPGR) imaging. Adrenocorticotropic hormone—producing microadenoma is nearly imperceptible on the T2-weighted (A) and postcontrast T1-weighted spin-echo image (B). It is most conspicuous on the postcontrast SPGR image (C) (white arrow).
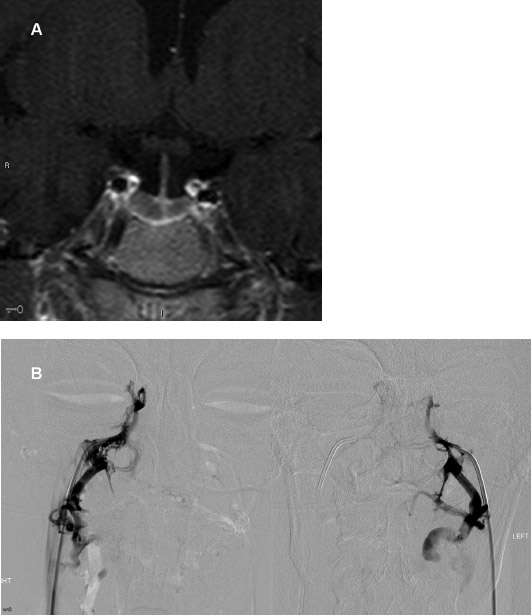
Fig. 5.7 (A)
Stay updated, free articles. Join our Telegram channel

Full access? Get Clinical Tree


