Purpose
To evaluate the quantitative characteristics of the radial peripapillary capillary (RPC) network in glaucoma, glaucoma suspect, and normal eyes using speckle variance optical coherence tomography angiography (OCT-A). To determine correlations between RPC density, nerve fiber layer (NFL) thickness, and visual field indices.
Design
Cross-sectional study.
Methods
OCT-A images of RPCs were acquired at a single institution using a custom-built 1060 nm system from 3 groups: unilateral glaucoma (10 eyes from 5 subjects), glaucoma suspects (6 eyes from 3 subjects), and normal control eyes (16 eyes from 9 normal subjects). Peripapillary NFL thickness measurements were determined using spectral-domain optical coherence tomography. Glaucoma and glaucoma suspects also underwent automated 30-2 Humphrey visual field analysis. Manual tracing techniques were used to quantify RPC density in the OCT-A images. Data were analyzed using a linear mixed model with 1 fixed-effect covariate. Correlations between main outcome measures (RPC density, NFL thickness, and visual field index) were determined.
Results
Mean age was not significantly different between the 3 groups ( P = .25). The density of RPCs was significantly lower in glaucomatous eyes compared with matched-peripapillary regions in the fellow eye, glaucoma suspect group, and normal group (all P < .001). RPC density was strongly correlated with NFL thickness ( P < .001) and visual field index ( P < .001).
Conclusions
Significant reductions in RPC density were correlated with sites of NFL decrease and visual field loss in glaucoma. Speckle variance OCT-A allows visualization and quantification of RPCs and may therefore be a useful tool for indirectly quantifying and monitoring retinal ganglion cell axonal injury in glaucoma.
Glaucoma is a leading cause of irreversible blindness worldwide and the second most common cause of blindness in the developed world. The pathophysiology of glaucoma is complex and characterized by the time-dependent loss of retinal ganglion cells (RGCs) and their accompanying axons. Indices that are currently used to quantify and evaluate progression of glaucomatous optic neuropathy include visual field testing, nerve fiber layer (NFL), optic nerve head, ganglion cell layer with inner plexiform layer (GCIPL), and ganglion cell complex parameters analysis. The nutritional demands of RGC axons are likely to be partially satisfied by radial peripapillary capillaries (RPCs) and structural changes to RPCs have been implicated in the pathogenesis of Bjerrum scotoma and glaucoma. The RPCs represent a unique capillary plexus within the inner aspect of the NFL. They are largely restricted to the posterior pole of the human retina along specific retinal eccentricities surrounding the optic nerve. Morphologically, this capillary network displays minimal intercapillary anastomosis and shows a linear course in keeping with the NFL distribution. The anatomic distribution and unique morphologic characteristics help to distinguish the RPCs from other capillary plexuses within the retinal microcirculation. Despite the evidence that RPCs are critically related to RGC function, the morphologic characteristics of RPCs are not routinely used in clinical practice to evaluate glaucomatous progression. This may be because RPCs are not reliably visualized with fluorescein angiography (FA), which is the mainstay imaging modality for clinically evaluating the retinal circulation.
Optical coherence tomography angiography (OCT-A) is a relatively new, noninvasive imaging technique that uses flow-based information to visualize the retinal and optic disc circulation. Our previous studies evaluated the morphologic characteristics of the foveal, perifoveal, and peripapillary capillary networks using speckle variance (sv) OCT-A and showed that the topological and quantitative characteristics of these networks, as seen on OCT-A, are comparable to histologic representation. This report uses OCT-A to quantitatively evaluate RPCs in glaucoma, glaucoma suspect, and normal eyes. Correlations between RPC density, NFL thickness, and visual field index (VFI) provided in this study suggest that the quantitative characteristics of RPCs may be a useful metric for evaluating RGC axonal loss in glaucoma.
Methods
The research work was conducted as a cross-sectional study. All subject recruitment and imaging took place at the Eye Care Centre at Vancouver General Hospital, Vancouver, Canada. The study protocol, including subject recruitment and imaging, was approved prospectively by the Research Ethics Boards at the University of British Columbia and Vancouver General Hospital. The study was performed in accordance with and adhered to the tenets of the Declaration of Helsinki. Written informed consent was obtained from all subjects.
Inclusion Criteria and Subject Recruitment
A total of 32 eyes from 17 subjects were imaged with OCT-A. This included 10 eyes from 5 subjects in Group A, 6 eyes from 3 subjects in Group B, and 16 eyes from 9 subjects in Group C. Group A consisted of subjects with unilateral glaucomatous optic neuropathy and a normal fellow eye. Eyes with glaucomatous optic neuropathy met all of the following criteria: (1) evidence of optic disc neural rim loss on clinical examination; (2) evidence of peripapillary NFL loss on spectral-domain optical coherence tomography (SD OCT); (3) glaucomatous pattern of visual field defect on automated Humphrey visual field (HVF) testing (30-2) with an abnormal pattern standard deviation ( P < .05); (4) stable SD OCT, HVF, and optic disc clinical examination for 6 or more months.
Group B consisted of glaucoma suspects. Eyes in this group met the following criteria: (1) no evidence of progressive optic disc neural rim loss on clinical examination; (2) evidence of nonprogressive NFL thinning in at least 1 region on SD OCT for at least 12 months; (3) normal baseline 30-2 HVF test with normal VFI and pattern standard values; and (4) no clinical history of: (i) unexplained optic disc hemorrhage, (ii) family history of glaucoma, (iii) intraocular pressure measurement above 21 mm Hg, (iv) central corneal thickness below 500 μm, or (v) history of nonglaucomatous optic neuropathy or retinal pathology.
Group C was the normal control group with no evidence of retinal or optic nerve pathology. Quantitative and morphologic RPC analysis of imaging from this group has been previously published.
Visual Fields, Disc Photographs, Peripapillary Optical Coherence Tomography
Visual fields were acquired using the Humphrey Field Analyzer II (Carl Zeiss Meditec, Dublin, California, USA). The settings were set for 30-2 threshold test, standard SITA protocol. Refractive error was corrected during testing. The maximum false-positive or false-negative value was set at 10%, and a maximum of 3 instances of fixation loss was chosen. Stereoscopic photographs around the optic discs were obtained for each participant using a fundus camera (TRC-50DX; Topcon, Hasunuma-cho, Japan) with 5.0-megapixel resolution. Peripapillary assessment of the NFL was done using the standard peripapillary protocol using SD OCT (Spectralis; Heidelberg Engineering, Heidelberg, Germany). All ancillary testing was acquired within 6 months of speckle variance OCT-A imaging.
Optical Coherence Tomography Angiography Instrumentation
Speckle variance OCT-A images and simultaneous, co-registered regular structural OCT images were acquired from a GPU-accelerated OCT clinical prototype. The details of the acquisition system have previously been published. The OCT system uses a 1060-nm swept source (Axsun Inc, Billerica, Massachusetts, USA) with 100 kHz A-scan rate and a full-width half-maximum bandwidth of 61.5nm, which corresponds to a coherence length of ∼6 μm in tissue. For the speckle variance calculation, 3 repeat acquisitions were obtained at each B-scan location. The scan area was sampled in a 300 × 300 (× 3) grid with a ∼2 × 2-mm field of view in 3.15 seconds. Scan dimensions were calibrated based on the eye length of each participant, measured using the IOLMaster 500 (Carl Zeiss Meditec). Processing of the OCT intensity image data and en face visualization of the retinal microvasculature was performed in real time using our open source code for alignment and quality control purposes.
Processing of Optical Coherence Tomography Angiography Images
Post-processing of the raw intensity data was performed to segment the retinal layers and extract optimal-quality images of the retinal microvasculature. Coarse axial motion artifact was corrected using cross-correlation between adjacent frames. Sub-pixel registration was performed on each set of corresponding B-scans before creating the speckle variance B-mode scan. Before layer segmentation, 3-dimensional bounded variance smoothing was applied to the motion-corrected intensity images in order to reduce the effect of speckle while preserving and enhancing edges. The inner limiting membrane, posterior boundary of the NFL, inner nuclear layer, and outer nuclear layer were segmented automatically in 3 dimensions using a graph-cut algorithm. The automated segmentation was examined and corrected by a trained grader using Amira (version 5.1; Visage Imaging, San Diego, California, USA). The OCT-A image within each layer was summed in the axial direction to produce a projected en face image. En face images were notch-filtered and contrast-adjusted using adaptive histogram equalization. In an effort to eliminate the bias of large blood vessels from the NFL thickness measurement, the images were cropped to an area of ∼1 × 1 mm to remove the majority of the large blood vessels present. Furthermore, prior to performing capillary density comparisons between glaucoma, glaucoma suspect, and normal control subjects the images were again cropped to an area of 636.5 × 636.5 μm.
Image Acquisition and Quantification
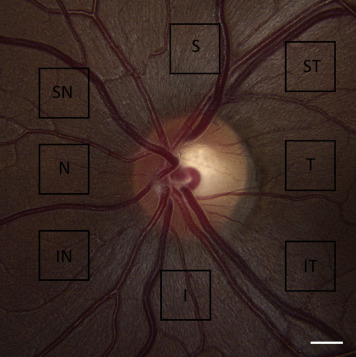
The 8 peripapillary regions imaged with speckle variance OCT-A are illustrated in Figure 1 . In Group A, the peripapillary region that was associated with the site of focal optic disc rim defect and corresponding HVF loss and NFL thinning was imaged first. A matched region in the normal fellow eye was then imaged. In Group B, the peripapillary region that was associated with the site of lowest NFL thickness, as determined using SD OCT, was imaged with OCT-A. Region selection for OCT-A imaging in Group A and B subjects was agreed upon collectively by authors Z.M., M.H., S.L., and C.B. In Group C, all 8 peripapillary regions were imaged with speckle variance OCT-A, as has been previously reported.
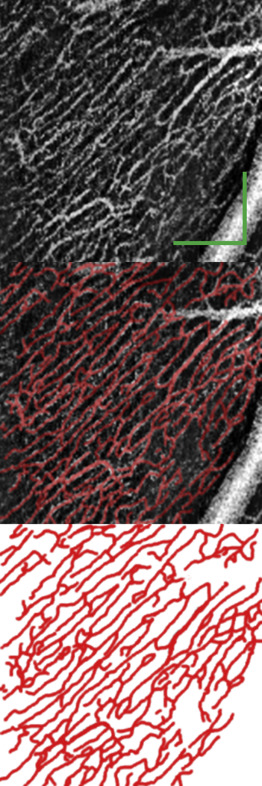
Our previously published manual tracing technique was used to quantify RPC density, as shown in Figure 2 . Manual tracing was performed using the GNU Image Manipulation Program Version 2.8.14. All manual tracings were performed by Z.M. in a nonmasked fashion. Care was taken to trace RPCs, and all large vessels originating from the disc were segmented separately and excluded. Capillary density was measured in the segmented image using MATLAB. The proportion of the image occupied by retinal vessels was expressed as a percentage, and the unit of measurement was calculated as the percentage retinal area occupied by capillary plexus. As speckle variance images are derived from the structural intensity scans, quantitative structural information such as the NFL thickness can be extracted from the exact same location as capillary density. The NFL thickness was measured and averaged across the cropped volumetric ∼1 × 1 mm scan of the region of interest. Where reported, the density of the RPCs was calculated as the fraction of pixels identified as belonging to a vessel vs the total number of pixels in an image. To determine the reproducibility of these measurements, 3 images from Group A, B, and C were manually traced and quantified on 2 separate occasions in a masked fashion, each at least 3 months apart, by the same rater (Z.M.). To facilitate the qualitative comparisons of the deep capillary plexus, careful manual segmentation of the retinal layers was performed to minimize projection artifacts. In addition, manually scrolling through the entire OCT volume helped to identify and exclude any residual projection artifacts from the overlying large superficial vessels in the qualitative comparison. The unique morphologic appearance of multiple closed loops in a laminar configuration was used as the guiding principle for identification and assessment of the deep capillary plexus.
Statistical Analysis
Intergroup mean comparisons were done using 1-way analysis of variance. Prior to group comparisons, the assumption of homogeneity of variances was tested using Levene’s test. A linear mixed regression model with 1 fixed-effect covariate incorporating the random effects on the scale of the linear predictor was used with capillary density as the response variable. The covariate tested was NFL thickness. The random effects were “eye” (right or left) to account for measurement from both eyes of the same individual, nested within “subject” to account for some multiple measurements from the same eye. The Q-Q normal plot showed normal distribution of the data across the mean. Statistical analysis was performed using R (R Core Team [2013]. R: A language and environment for statistical computing. R Foundation for statistical computing, Vienna, Austria. http://www.R-project.org/ .). Statistical significance was set as P < .05.
Results
The average age of subjects (range; median) of Groups A, B, and C were 58.00 ± 18.60 (26–72; 66) years, 44.67 ± 23.50 (21–68; 45) years, and 41.13 ± 13.51 (27–60; 36) years, respectively ( P = .25). The male-to-female ratio of subjects in Groups A, B, and C were 3:2, 3:0, and 4:3, respectively. The average intraocular pressure of subjects (range; median) of the glaucoma eyes and fellow eyes in Group A and Group B were 11.46 ± 4.21 (5–15; 12) mm Hg, 13.74 ± 3.21 (10–17; 14) mm Hg, and 16.17 ± 2.04 (14–19; 16) mm Hg, respectively.
Morphology of Radial Peripapillary Capillaries and the Deeper Retinal Networks
In the normal control group, the RPCs followed a very similar trajectory to the RGC axons in the NFL and demonstrated a linear course with minimal anastomoses. Decreased density of RPCs was observed within regions of optic disc neural rim loss in glaucomatous eyes. In glaucomatous eyes, RPCs maintained a linear trajectory; however, a patchy or diffuse loss of RPCs was observed within regions of NFL thinning. The density and morphologic characteristics of deeper capillary networks, beyond the outer margins of the NFL, at sites of RPC loss appeared normal in glaucomatous eyes ( Figure 3 ).


