Purpose
To measure the vascular density and foveal avascular zone (FAZ) area in the deep and superficial retinal vascular networks using optical coherence tomography angiography (OCTA) in patients with branch retinal vein occlusion (BRVO).
Design
Retrospective observational case series.
Methods
Patients with unilateral BRVO involving the macula were enrolled. OCTA was performed on the BRVO and fellow eyes. Macular vascular density, FAZ area, and foveal thickness were measured in all eyes.
Results
Seventeen eyes of 17 patients met inclusion criteria. The mean overall vascular density measured in the entire scan was lower in BRVO eyes compared to fellow eyes in both the superficial (48.07% vs 52.60%, respectively; P < .001) and deep (52.60% vs 57.67%, respectively; P < .001) networks. In both networks, the density was lower in the affected BRVO sector compared to the unaffected sector in the same eye and in the fellow eye ( P < .001). In the deep network, the density was lower in the unaffected sector of the BRVO eye compared with the corresponding sector in the fellow eye (58.87% vs 61.65%, respectively; P = .04). A negative correlation was found between the logarithm of the minimal angle of resolution (logMAR) visual acuity and the overall density in superficial (r = −0.40, P = .02) and deep (r = −0.38, P = .03) networks. The mean FAZ area in BRVO eyes was significantly lower only at the level of the deep network when compared to the fellow eyes (0.519 mm 2 vs 0.410 mm 2 , respectively; P = .02) and correlated positively with logMAR (r = 0.34, P = .04).
Conclusion
In eyes with BRVO, quantitative OCTA measurements confirm decreased vascular density in both the superficial and deep vascular networks. Moreover, vascular density and FAZ area appear to correlate with visual function.
Branch retinal vein occlusion (BRVO) is a common retinal vascular disease that can lead to visual loss, often owing to macular edema. Several studies have explored the relationship between retinal perfusion and macular edema in BRVO. One group reported a positive correlation between the severity of macular edema seen on optical coherence tomography (OCT) and the size of nonperfusion area seen on fluorescein angiography (FA) in the macula and periphery. Others have suggested that areas of partial perfusion may contribute more to macular edema than areas of more profound nonperfusion. In addition, blood flow velocity in the perifoveal capillaries has been measured by using a scanning laser ophthalmoscope combined with FA and was found to correlate with visual function in eyes with BRVO.
The recent introduction of optical coherence tomography angiography (OCTA) has allowed for acquisition of high-resolution depth-resolved images of the retinal vascular layers in a rapid, noninvasive manner. Multiple approaches for OCTA have been developed, including amplitude-based, phase-based, or combined amplitude/phase variance–based methods. One current method uses a split-spectrum amplitude decorrelation algorithm (SSADA) that distinguishes static and nonstatic tissue based on the amplitude of the decorrelation signal coming from consecutive B-scans. OCTA has been recently used to measure the foveal avascular zone (FAZ) area and macular vascular density in healthy eyes and in several disease states.
Prior studies have qualitatively described the changes in BRVO eyes seen on OCTA. In both the superficial and deep capillary networks, non-flow areas, vascular dilation, and intraretinal edema have been observed. In this study, we quantified the vascular density and FAZ area in BRVO eyes and fellow eyes to determine correlation with visual function and foveal thickness.
Methods
Subjects
The study was approved by the institutional review board of Wills Eye Hospital and complied with the Health Insurance Portability and Accountability Act. Patients with a diagnosis of BRVO who underwent OCTA of both eyes at the Retina Service of Wills Eye Hospital between January 1, 2015 and April 30, 2015 were retrospectively evaluated. Data collected included the findings of the comprehensive ophthalmologic examination, best-corrected visual acuity (BCVA) based on current spectacle correction with pinhole, and spectral-domain OCT (SDOCT, Spectralis; Heidelberg Engineering, Heidelberg, Germany). Fundus examination had been performed in each patient to confirm the diagnosis of BRVO and exclude any retinal vascular disease in the fellow eyes.
Inclusion and Exclusion Criteria
Patients with the diagnosis of BRVO involving the macula based on clinical examination were retrospectively enrolled. The diagnosis was confirmed using imaging studies (FA and/or SDOCT). Both treatment-naïve and previously treated patients were included. Patients were excluded if they had previous retinal surgery (prior vitrectomy), diabetic retinopathy, age-related macular degeneration, or other retinal vascular diseases.
Optical Coherence Tomography Angiography Image Acquisition
The AngioVue OCTA system on the commercially available Avanti SDOCT device (RTVue-XR Avanti; Optovue, Fremont, California, USA) was used for imaging. This system used an SSADA software algorithm (version 2015.100.0.35) and operated at 70 000 A-scans per second to acquire OCTA volumes consisting of 304 × 304 A-scans. Orthogonal registration and merging of 2 consecutive scans were used to obtain OCTA volume scans over a central 3 × 3 mm area of both eyes for each subject. OCTA images of the superficial and deep vascular networks were generated separately using the automated software algorithm. Based on these default settings, the boundaries of the superficial network extended from 3 μm below the internal limiting membrane to 15 μm below the inner plexiform layer (IPL). The deep capillary network extended from 15 μm to 70 μm below the IPL.
Two experienced independent graders (W.A.S., A.S.) reviewed the images. Patients with poor image quality were excluded based on 1 or more of the following criteria: low signal strength index (less than 50), presence of blink artifacts, poor fixation leading to motion or doubling artifacts, and media opacity obscuring view of the vasculature.
Foveal Avascular Zone, Foveal Thickness, and Vascular Density Measurement
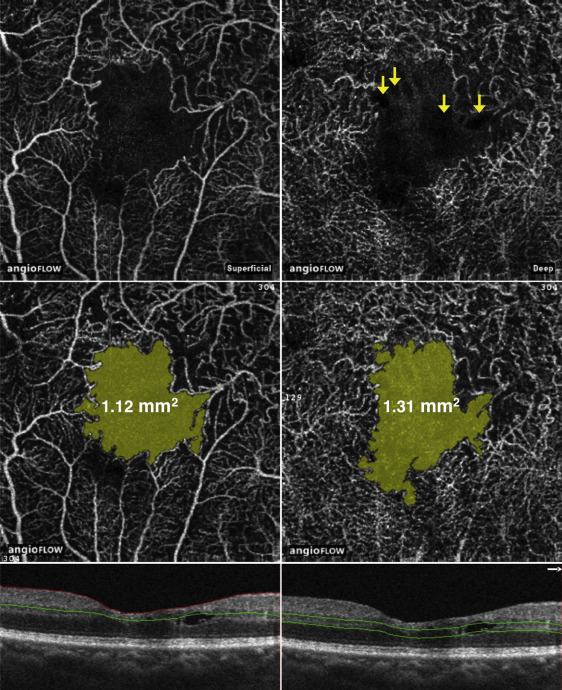
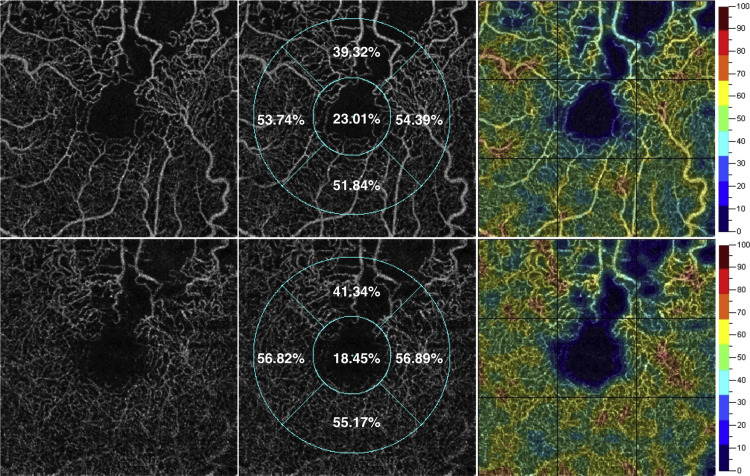
Using the acquired images, measurements of the FAZ area were calculated using the non-flow function on the OCTA software ( Figure 1 ). The OCTA software uses a custom grid overlay that is superimposed on the 3 × 3 mm OCTA scan to generate vascular density in the different areas of interest ( Figure 2 ). The grid is composed of 2 circles: an inner circle with a diameter of 1 mm and an outer circle with a diameter of 2.5 mm. The foveal region was defined as the inner circle. The outer circle is also divided into sectors (nasal, temporal, superior, inferior). The foveal thickness was calculated from the inner circle. Vascular density values were calculated for the entire en face scan and for different sectors of the grid, as shown in Figure 2 . This calculation was performed by converting the obtained images to a binary format using an automated thresholding algorithm. Vascular density was calculated as the percentage area occupied by blood vessels, with the blood vessels being defined as pixels having decorrelation values above the threshold level. In BRVO eyes we compared the vascular density between the affected sector (superior or inferior) on the grid and the opposite unaffected sector of the same eye. We also compared both sectors with the corresponding sectors in the fellow eyes. Color-coded density maps were also generated through the SSADA algorithm, which localized areas with decreased vascular density ( Figure 2 ).
Statistical Analysis
BCVA was converted to the logarithm of the minimal angle of resolution (logMAR) for statistical evaluation. Statistical analyses were performed with SPSS, Version 20 (SPSS, Inc, Chicago, Illinois, USA). The paired t test was used to compare the logMAR visual acuity, vascular density, foveal thickness, and FAZ area between BRVO eyes and fellow eyes. The Pearson correlation coefficient was used to study the correlation between logMAR visual acuity, vascular density, FAZ area, and foveal thickness. A 2-tailed P value of <.05 was considered statistically significant.
Results
Patient characteristics are listed in Table 1 . A total of 34 eyes from 17 subjects (9 female and 8 male) consisting of 17 eyes with BRVO and 17 unaffected fellow eyes were included in this study. The mean age of the subjects was 64 years (range, 44–82 years). The mean duration between BRVO diagnosis and obtaining OCTA scans was 8 months (range, 0–42 years). Twelve patients had received prior treatment (eg, anti–vascular endothelial growth factor [VEGF] injections and/or focal/grid laser) while the remaining 5 patients were treatment naïve. The mean logMAR visual acuity was 0.37 in the BRVO eyes (equivalent to 20/47 on Snellen chart) and 0.16 in the fellow eyes (equivalent to 20/29 on Snellen chart, P = .007).
| Number of BRVO eyes | 17 |
| Number of fellow eyes | 17 |
| Sex (male:female) | 8:9 |
| Mean age (SD) | 63 (12) |
| Prior treatments | |
| Treatment naïve | 5 (29) |
| Anti-VEGF injections only, no. (%) | 8 (47) |
| Anti-VEGF injections and focal/grid laser, no. (%) | 4 (24) |
| Mean duration of BRVO diagnosis, mo (range) | 8 (0–42) |
| Hypertension, no. (%) | 12 (71%) |
| Diabetes mellitus, no. (%) | 4 (24%) |
The FAZ measurements are shown in Table 2 . When comparing superficial and deep FAZ area between BRVO eyes and fellow eyes, there was a statistically significant difference only at the level of the deep vascular network ( P = .02). Using Pearson correlation, the deep FAZ area correlated positively with logMAR visual acuity (r = 0.34, P = .04; Figure 3 ). The vascular density measurements are shown in Table 3 . In BRVO eyes and fellow eyes, the overall vascular density measured in the entire scan in both superficial (r = −0.4, P = .02) and deep (r = −0.38, P = .03) vascular networks correlated negatively with logMAR visual acuity ( Figure 3 ). The mean foveal thickness in BRVO eyes measured 339 μm compared to 260 μm in the fellow eyes ( P = .02). In all eyes, the foveal thickness correlated positively with logMAR visual acuity (r = 0.38, P = .02; Figure 3 ).
| BRVO Eye | Fellow Eye | P Value a | |
|---|---|---|---|
| Superficial FAZ area (mm 2 ) (95% CI) | 0.312 (0.171–0.454) | 0.284 (0.206–0.362) | .54 |
| Deep FAZ area (mm 2 ) (95% CI) | 0.519 (0.378–0.660) | 0.410 (0.304–0.517) | .02 |
Stay updated, free articles. Join our Telegram channel

Full access? Get Clinical Tree


