Purpose
To evaluate the reproducibility of area and volume measurements of retinal pigment epithelium detachments (PEDs) in eyes of patients with age-related macular degeneration using spectral-domain optical coherence tomography imaging and a novel automated, quantitative algorithm.
Design
Prospective study to evaluate a diagnostic technology.
Methods
Patients with PEDs associated with age-related macular degeneration underwent spectral-domain optical coherence tomography imaging. Each eye was imaged 5 times, and each scan consisted of a raster pattern comprising 40 000 uniformly spaced A-scans organized as a 200 × 200 A-scan array. Each raster scan covered a retinal area of 6 × 6 mm encompassing the entire PED. A novel algorithm was used to create PED maps that permitted both qualitative and quantitative assessment of PED area and volume. Test–retest standard deviations of PED area and volume measurements were calculated for each eye.
Results
Sixty-three eyes of 58 patients were enrolled in this study. The qualitative appearance and the quantitative measurements of PED area and volume were highly reproducible over the 5 different datasets obtained from each eye. The intraclass correlation coefficient was more than 0.99 for both area and volume measurements obtained using the entire dataset.
Conclusions
A novel algorithm for the qualitative and quantitative assessment of PEDs imaged using spectral-domain optical coherence tomography was shown to be highly reproducible. The ability to measure PED area and volume reliably represents a novel strategy for following disease progression, especially when assessing the response of vascularized PEDs to antiangiogenic therapy.
Retinal pigment epithelium detachments (PEDs) are present in different chorioretinal diseases, most notably age-related macular degeneration, polypoidal choroidal vasculopathy, and idiopathic central serous chorioretinopathy. In age-related macular degeneration, the presence of a PED frequently is associated with the presence of choroidal neovascularization (CNV) and a higher risk of severe visual acuity loss. PEDs can be classified as serous (vascular or nonvascular), fibrovascular, or drusenoid. Historically, this classification system relied on the clinical appearance of the lesion as assessed by biomicroscopic examination, color fundus photography, fluorescein angiography (FA), and indocyanine green angiography. More recently, optical coherence tomography (OCT) has been used to provide a more detailed anatomic assessment of PEDs. The cross-sectional profile of the PED provided by OCT can reveal its contents based on internal reflectivity and can identify the presence of associated subretinal or intraretinal fluid.
The quantitative assessment of PEDs has relied on the en face appearance of these lesions as seen on color fundus and angiographic images. From these images, area measurements were calculated and expressed in units of square millimeters or disc areas (DAs). However, area measurements provide only 2 dimensions at the base of a PED and do not truly define the morphologic features of a PED. Other properties such as the volume or the shape may be useful prognostic features when observing normal disease progression or the effect of treatments. Although time-domain OCT provided the first opportunity to characterize PEDs based or height and contour using individual B-scans, this imaging approach was limited by its acquisition time. Time-domain OCT was too slow to capture reliably the full geometry of the PED, and the small number of B-scans obtained was insufficient to reconstruct the lesion accurately. In addition, it was not possible to correlate the position of the scan with other retinal landmarks to ensure that the scan covered the targeted portion of the PED. The recent introduction of spectral-domain (SD) OCT technology overcomes these limitations. It is now possible to obtain datasets that densely sample a large region of the retina and permit the 3-dimensional reconstruction of a PED, and this reconstructed PED can be registered to a fundus image. Segmentation algorithms can be applied to these datasets so that quantitative information can be extracted. Current software on the commercially available Cirrus SD OCT (Carl Zeiss Meditec, Inc, Dublin, California, USA) is capable of generating a 3-dimensional segmentation map of the retinal pigment epithelium (RPE). Another algorithm, which was recently published, uses this same dataset to create a virtual RPE floor free of any deformations. The combination of these algorithms permits the creation of difference maps, which isolate the deformations of the RPE and allow measurements of their geometry. The algorithm was developed to study drusen, and it has been shown to measure drusen area and volume reproducibly. This same approach can be used to study PEDs.
The idea of generating measurements of RPE deformations based on difference maps between the actual RPE segmentation and some kind of interpolated normal RPE floor using SD OCT datasets is not new. However, previously published algorithms either were semiautomated or were prone to artifacts. This report describes the use of a fully automated algorithm to generate area and volume measurements of PEDs and to investigate the reproducibility of these measurements. This algorithm has been licensed to Carl Zeiss Meditec and will be included in future versions of the Cirrus software.
Methods
This prospective study included patients with a clinical diagnosis of a PED secondary to age-related macular degeneration who were recruited from the retina service at the Bascom Palmer Eye Institute. All patients signed a research consent form after an explanation of the study.
The diagnosis of a PED was confirmed by the Bascom Palmer Eye Institute retina faculty. Serous (vascular and nonvascular) and fibrovascular PEDs were included in this study. SD OCT imaging (Cirrus HD-OCT; Carl Zeiss Meditec, Inc) was performed on all patients, and color fundus imaging and angiographic imaging with either fluorescein or indocyanine green was performed as clinically needed.
PEDs were identified ophthalmoscopically by the presence of well-circumscribed elevation of the RPE. Serous PEDs were identified as vascularized or nonvascularized by their appearance on angiography. On FA, nonvascularized PEDs had a homogenous hyperfluorescent appearance with well-defined borders during the late phases of the angiogram, as previously described. Indocyanine green angiography showed none of the typical hyperfluorescence associated with CNV throughout the transit phases. In vascularized PEDs, evidence of CNV-related hyperfluorescence was seen either on FA or on indocyanine green angiography. On SD OCT imaging, the serous PEDs appeared as dome-shaped elevations of the RPE. Vascularized serous PEDs often were associated with subretinal or intraretinal fluid. Fibrovascular PEDs were associated with an irregular elevation of the RPE in which there was nonhomogenous hyperreflective material below the RPE consistent with fibrovascular tissue. In fibrovascular PEDs, FA revealed the typical appearance of either occult-only or minimally classic CNV.
An SD OCT instrument was used for this study. Each eye was imaged 5 separate times in a single session using a raster scan protocol that covered a 6 × 6-mm area with 200 × 200 A-scans. This protocol resulted in the acquisition of an SD OCT dataset consisting of 40 000 uniformly spaced A-scans organized as 200 A-scans in each B-scan and as 200 horizontal B-scans in each raster array. Each A-scan was separated by 30 μm. The operator assessed the quality of the scan during its acquisition, and whenever possible, an effort was made to delete datasets with poor signal strength or with significant motion artifacts. The patient was repositioned during the scanning session as necessary, but there was no specific requirement to reset the patient or the instrument after acquiring each of the 5 separate datasets. The major exclusion criteria for this study included PEDs that extended to the edge of the scan or were too large to fit entirely within the 6 × 6-mm scanning area of the SD OCT instrument. Eyes with geographic atrophy (GA) within the macula also were excluded. GA was detected by fundus biomicroscopy, color fundus imaging, fundus autofluorescence imaging, SD OCT imaging, or a combination thereof.
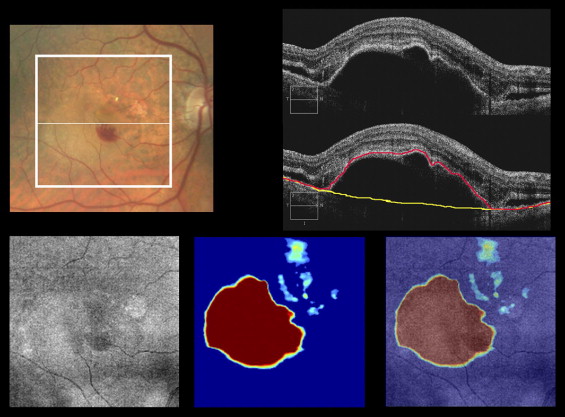
The raw OCT datasets were exported to a personal computer for analysis. A proprietary algorithm developed by one of the authors (G.G.), and a commercially available Cirrus SD OCT instrument was used to segment the RPE. A separate algorithm, also developed by the same author (G.G.), was used to determine automatically the RPE floor, a virtual RPE free of any deformations. As a result of this analysis, an RPE deformation map was generated by tracking the distance between the real RPE and the interpolated RPE floor at each of the 40 000 measurement data points, as depicted in Figure 1 .
Quantitative measurements of PED area and volume based on the RPE deformation map were obtained for the full dataset. The test–retest standard deviations of each set of measurements were calculated for each eye. To understand the correlation between the lesion size and the test–retest standard deviations, the data also were analyzed after transforming the measurements according to its scaling properties. This was accomplished by performing a square root transformation of area measurements and a cube root transformation of volume measurements. The test–retest standard deviations then were calculated for the square root of the PED area measurements and the cube root of the PED volume. This same strategy was published previously for the quantitative assessment of drusen. The intraclass correlation coefficient of reproducibility was used as a summary statistic. All statistical calculations were carried out with the SPSS software version 16.0 (SPSS, Inc, Chicago, Illinois, USA).
Results
Sixty-three eyes from 58 patients were enrolled in this study. The subjects included 15 men and 48 women with a mean age of 75.14 years (range, 51 to 90 years; standard deviation, 9.22 years). Sixteen eyes were classified as having serous nonvascularized PEDs (25.4%; Figure 2 ) , 25 eyes were classified as having serous vascularized PEDs (39.7%; Figure 3 ), 20 eyes were classified as having fibrovascularized PEDs (31.7%; Figure 4 ) , and 2 eyes were classified as having hemorrhagic vascularized PEDs (3.2%; Figure 5 ) .
A total of 63 sets of OCT images were obtained and analyzed. Each set of OCT images consisted of 5 repeated scans from 1 visit. A review of the acquired datasets led to the exclusion of 1 image from each of 4 different patients because of poor image quality resulting from large motion artifacts. Therefore, 4 eyes had only 4 repeated scans used in the analysis. The PED area and PED volume were computed automatically from each image over the full 6 × 6-mm square covered by the scan.
One (1.6%) of the 63 eyes was a clear outlier in which the algorithm failed to identify the RPE properly, resulting in very different measurements over the 5 repetitions. This particular case created problems for the RPE segmentation algorithm, which failed to identify the appropriate anatomic boundaries on 4 of the 5 scans. The algorithm erroneously identified a highly reflective signal from the photoreceptor outer segments as the RPE layer rather than following the true RPE layer ( Figure 6 ) . In this case, the retina elevated by the subretinal fluid was interpreted by the algorithm as a PED. Obvious failures of the RPE segmentation were identified immediately when viewing OCT datasets, and in this case, the PED measurements were unreliable and were excluded from the reproducibility analysis.
Stay updated, free articles. Join our Telegram channel

Full access? Get Clinical Tree


