Purpose
To quantify retinal capillary density and morphology in uveitis using spectral-domain optical coherence tomography angiography (SD-OCTA).
Design
Cross-sectional, observational study.
Methods
Healthy and uveitic subjects were recruited from 2 tertiary care eye centers. Prototype SD-OCTA devices (Cirrus; Carl Zeiss Meditec, Inc, Dublin, California, USA) were used to generate 3 × 3-mm 2 OCTA images centered on the fovea. Subjects were placed into 3 groups based on the type of optical microangiography (OMAG) algorithm used for image processing (intensity and/or phase) and type of retinal segmentation (automatic or manual). A semi-automated method was used to calculate skeleton density (SD), vessel density (VD), fractal dimension (FD), and vessel diameter index (VDI). Retinal vasculature was assessed in the superficial retinal layer (SRL), deep retinal layer (DRL), and nonsegmented retinal layer (NS-RL). A generalized estimating equations model was used to analyze associations between the OCTA measures and disease status within each retinal layer. A P value < .05 was accepted as significant. Reproducibility and repeatability were assessed using the intraclass correlation coefficient (ICC).
Results
The SD, VD, and FD of the parafoveal capillaries were lower in uveitic eyes compared with healthy eyes in all retinal segments. In addition, SD and VD were significantly lower in the DRL of subjects with uveitic macular edema. There was no correlation in any capillary parameters and anatomic classification of uveitis.
Conclusions
Quantitative analysis of parafoveal capillary density and morphology in uveitis demonstrates significantly lower capillary density and complexity. SD-OCTA algorithms are robust enough to detect these changes and can provide a novel diagnostic index of disease for uveitis subjects.
Macular abnormalities are a common manifestation of uveitis regardless of anatomic location of disease. Inflammatory mediators play a key role in the disruption of the retinal microvasculature, leading to visually debilitating findings such as macular edema (ME), retinal ischemia, and neovascularization (NV). Fluorescein angiography (FA) and spectral-domain optical coherence tomography (SDOCT) remain the most commonly used tools to detect these uveitic findings. However, standard FA requires an invasive procedure, does not reliably provide capillary-level resolution, and needs subjective assessment that does not correlate with OCT anatomic findings in many cases.
Quantitative and objective analysis of macular involvement in uveitis has largely been limited to measuring retinal thickness with OCT, or less commonly measuring retinal blood perfusion velocity using retinal function imager. Ultra-widefield FA has been used to identify areas of retinal ischemia, leakage, and retinal vasculitis that are not visible using conventional FA and to quantify some of these findings. Although wide-field FA is an essential tool, quantitative studies are confounded by relatively low-resolution images, distortion of peripheral anatomy owing to imaging artifacts, lid artifacts, and a limited time window for optimal imaging during the FA transit phase. In addition, wide-field images generally do not provide high-resolution images of the foveal capillaries where vision-threatening macular pathology most often occurs.
Spectral-domain OCT angiography (SD-OCTA) is a novel imaging modality that uses the advances in OCT technology to provide high-resolution angiographic information of the retinal microvasculature. SD-OCTA allows both qualitative and quantitative assessment of microvascular integrity in retinal vascular diseases, particularly in the parafovea, where the most visually significant pathology is often present (eg, macular edema). We have demonstrated that qualitative SD-OCTA findings in the macula are reliable and correlate well with macular FA findings in diabetic retinopathy and retinal venous occlusion. In addition, macular capillary structural details by SD-OCTA are higher in resolution, and also provide quantitative measures of disease severity. Most importantly, SD-OCTA is a noninvasive method that can be repeated frequently, and provides near–histology level resolution for assessment of capillary density.
In this study, we use SD-OCTA to quantitatively assess the density and morphology of parafoveal retinal capillaries in subjects with a history of uveitis. In particular, we address 3 important clinical questions: Are there differences in macular capillary density or morphology (1) between uveitic eyes and healthy eyes, (2) between uveitic eyes with ME and those without ME, and (3) between uveitic eyes with different anatomic foci of disease activity? We use 3 different image-processing and retinal segmentation algorithms to validate the reliability of our findings.
Methods
Subject Recruitment
This cross-sectional, observational case series on healthy and uveitic adult eyes was conducted at the University of Southern California Roski Eye Institute (USCREI) and the University of Washington Eye Institute (UWEI) over 14 months (November 1, 2014 to January 31, 2016). The study was approved by the USC Health Sciences Campus and University of Washington Institutional Review Boards for prospective recruitment and imaging of subjects using OCTA with subsequent image analysis. Written informed consent was obtained from all subjects for participation in the research. The study was conducted in accordance with Health Insurance Portability and Accountability Act regulations and adhered to the tenets stated in the Declaration of Helsinki.
Adult patients diagnosed with uveitis by fellowship-trained uveitis specialists were recruited for this study. Because macular pathology can occur in any type of uveitis, all types of uveitis were eligible regardless of the known anatomic location, clinical diagnosis, or clinical features. In cases of bilateral uveitis, both eyes were eligible. In unilateral uveitis, only the uveitic eye was included in the analysis. Subjects who were unable to fixate or had significant media opacities were excluded. In addition, subjects with concomitant retinal vascular disease not associated with uveitis (eg, diabetic retinopathy, retinal vascular occlusion, glaucoma, and age-related macular degeneration) were excluded. Healthy subjects with no ocular disease other than refractive error were recruited as controls.
Three cohorts of uveitis and healthy subjects were recruited for the study: 2 groups from USCREI and 1 group from UWEI. Each group was imaged with the same OCTA device model but under different processing and segmentation settings, as described in the imaging protocol below. All uveitis patients were evaluated according to standard-of-care with complete history, ocular examination, imaging, and appropriate laboratory studies and categorized by fellowship-trained uveitis specialists using Standardization of Uveitis Nomenclature criteria. Clinical and demographic information including age, sex, ocular examination findings and diagnosis, and pertinent medical history such as diabetes, hypertension, hyperlipidemia, and autoimmune disease were collected. All patients were imaged on the same day as their clinical evaluation, and at least 1 3 × 3-mm 2 scan centered on the fovea was taken in each eye of interest for subsequent evaluation.
Spectral-domain Optical Coherence Tomography Angiography Imaging Protocol
Prototype SD-OCTA devices (Cirrus; Carl Zeiss Meditec, Inc, Dublin, California, USA) with a central wavelength of 840 nm and scan speed of 68 kHz (68 000 A-scans per second) were used to generate en face OCTA images using optical microangiography (OMAG) algorithms that have been described. Two different OMAG image processing and/or segmentation schemes were used for the study as described below. Subjects were grouped as follows.
In Group 1, subjects were imaged with an intensity-only OMAG algorithm. A semi-automated segmentation algorithm was used to generate 3 horizontal OCTA slabs: the superficial retinal layer (SRL; automatically calculated as 60% of the depth between the inner limiting membrane [ILM] and 110 μm above the retinal pigment epithelium [RPE]); the deep retinal layer (DRL; automatically calculated as the remaining 40% of the depth up to 110 μm above the RPE); and the nonsegmented retinal layer (NS-RL; automatically segmented from the ILM to RPE).
In Group 2, a combined-intensity and phase-based OMAG algorithm was used with the same semi-automated segmentation algorithm as Group 1 ( Figure 1 , Top row).
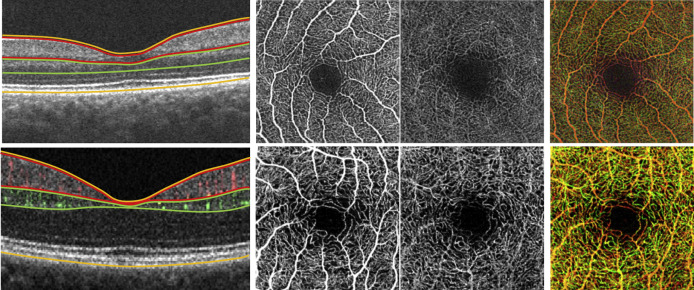
In Group 3, subjects were imaged with combined-intensity and phase-based OMAG algorithm and manual segmentation. In the manual segmentation, the SRL extended from the ILM to the edge of the inner plexiform layer (IPL); the DRL extended from the inner nuclear layer (INL) to the edge of the outer plexiform layer (OPL); and the NS-RL extended from the ILM to the RPE ( Figure 1 , Bottom row).
For each subject, at least 1 3 × 3-mm 2 scan centered on the fovea was taken in each eye of interest. Quality was assessed based on corresponding structural en face images and co-registered OCT B-scans to exclude artifacts, segmentation errors, or poor image focus. Images were graded on an A-F scale using signal intensity (reported from 0/10 for no signal detection to 10/10 for excellent signal detection by the OCTA device), as well as subjective user evaluation of the scans. All scans graded A-C (signal intensities greater than 7/10, no significant floaters or segmentation errors, and minimal motion artifact) were included. Scans graded D-F were excluded (images that had signal intensities of 6/10 or less, large or diffuse floaters, significant segmentation errors, or motion artifacts). This methodology was described in our previous studies.
Quantitative Algorithm for Spectral-domain Optical Coherence Tomography Angiography Images
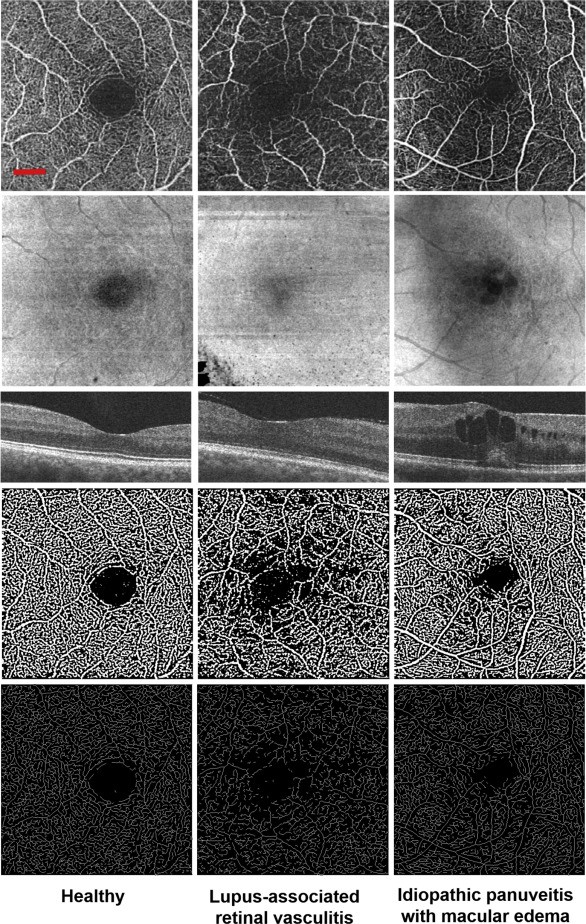
A semi-automated algorithm with interactive user interface was used to quantify retinal vascular density and morphology. Vascular density was characterized by skeleton density (SD) and vessel density (VD), while vascular morphology was characterized by fractal dimension (FD) and vessel diameter index (VDI). All OCTA images were converted into 8-bit files (586 × 585 pixels; 1 pixel ≈ 5.13 × 5.13 μm 2 ). The original grayscale image was then converted into a binarized black-and-white image using a 3-way combined method consisting of a global threshold, hessian filter, and adaptive threshold in MATLAB (R2013b; MathWorks, Inc, Natick, Massachusetts, USA), as shown in Figure 2 . The foveal avascular zone (FAZ) was used to determine the global threshold for each image. The resulting image was then processed separately by 2 mechanisms: (1) median adaptive threshold with top-hat filter of 12 pixels, and (2) hessian filter only. The 2 generated images were then combined to form the final binarized image ( Figure 2 , Fourth row). This binary image was used to calculate VD, which represented a unitless proportion of the total area of pixels with detected OCTA signal (white pixels in the binarized image) compared with the total area of pixels in the binarized image, as follows:
V D = ( ∑ ( i , j ) n B ( i , j ) ) 2 ( ∑ ( i , j ) n X ( i , j ) ) 2
The binarized image was used to create the skeletonized SD-OCTA image to measure statistical length of moving blood column, or SD (pixels/pixels 2 ). This was done by repeatedly deleting the outer boundary of pixels in the binarized image until 1 pixel remained to represent that section of detected blood perfusion ( Figure 2 , Bottom row). SD was calculated using this skeletonized image, as follows:
Stay updated, free articles. Join our Telegram channel

Full access? Get Clinical Tree


