Purpose
To assess the ability of Pulsar perimetry (Pulsar) in detecting early glaucomatous visual field (VF) damage in comparison with Frequency Doubling Technology (FDT), Scanning Laser Polarimetry (SLP, GDx VCC), and Heidelberg Retina Tomography (HRT).
Design
Prospective observational cross-sectional case study.
Methods
This multicenter study included: 87 ocular hypertensives (OHT); 67 glaucomatous optic neuropathy (GON) patients; 75 primary open-angle glaucoma (POAG) patients; and 90 normals. All patients underwent standard automated perimetry (SAP) HFA 30-2, Pulsar T30W, FDT N-30, HRT II, and GDx VCC. Area under Receiver Operating Characteristic Curves (AROCs) for discriminating between healthy and glaucomatous eyes and agreement among instruments were determined.
Results
The best parameters for Pulsar, FDT, HRT, and GDx were, respectively: loss variance square root; no. of areas with P < 5%; Cup-Shape-Measure; and Nerve Fiber Indicator (NFI). In detecting POAG eyes, Pulsar (AROC, 0.90) appeared comparable with FDT (0.89) and significantly better than HRT (0.82) and GDx (0.79). For GON, Pulsar ability (0.74) was higher than GDx (0.69) and lower than FDT (0.80) and HRT (0.83). The agreement among instruments ranged from 0.12 to 0.56. Pulsar test duration was significantly shorter than SAP and FDT ( P < .001).
Conclusions
Pulsar T30W test is a rapid and easy perimetric method, showing higher sensitivity than SAP in detecting early glaucomatous VF loss. Its diagnostic ability is good for detecting early perimetric POAG eyes and fair for GON eyes. Pulsar performance was comparable with FDT, HRT, and GDx, even if the agreement between instruments was poor to fair.
Primary open-angle glaucoma (POAG) is an acquired chronic and progressive optic neuropathy resulting in retinal ganglion cell (RGC) death and/or dysfunction. Several studies have shown that optic nerve head (ONH) and retinal nerve fiber layer (RNFL) structural damage often precedes functional defects in early glaucomatous optic neuropathy (GON), which may be indicative of loss of RGC redundancy; however, some patients do show early functional defects before structural ones become evident. Recent randomized clinical trials have reported that initial glaucomatous damage can vary, thus both structural and functional tests are imperative in the early detection of glaucoma.
Standard automated perimetry (SAP) is still the clinical standard in the diagnosis and follow-up of glaucoma; however, numerous studies have shown that it offers limited sensitivity in the detection of early glaucomatous damage. New non-conventional perimetric tests, such as short wavelength automated perimetry (SWAP), frequency-doubling technology (FDT), and Pulsar perimetry (Pulsar) were designed to selectively stimulate certain visual pathways to overcome potential redundancy and provide early visual field (VF) defect detection.
New imaging technology such as Heidelberg Retina Tomography (HRT; Heidelberg Engineering GmbH, Heidelberg, Germany) and scanning laser polarimetry (SLP; GDx VCC; Carl Zeiss, Meditec Inc, Dublin, CA, USA), provide quantitative objective analysis of the ONH and RNFL thickness. Both HRT and GDx VCC have shown good diagnostic ability in discriminating between healthy and early glaucomatous eyes.
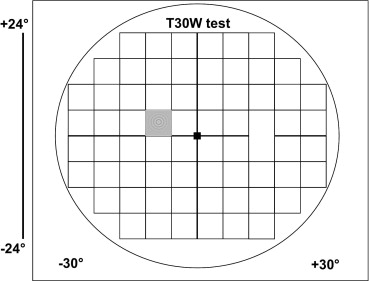
Pulsar was developed in 2000 by Gonzales de la Rosa and associates. The T30W test utilizes a circular sinusoidal grating pattern that examines 66 areas of the central 30 degrees VF ( Figure 1 ). Pulsar has given promising preliminary results in the early detection of glaucomatous VF damage.
The aim of our multicenter study was to compare Pulsar with FDT, GDx, and HRT in detecting early glaucomatous damage.
Methods
This multicenter prospective observational cross-sectional study included 1 eye of 328 consecutive subjects composed of: 90 normal subjects; 87 patients with ocular hypertension (OHT); 71 patients with GON; and 80 patients with POAG. Only 1 eye per subject was randomly selected using a computer-generated randomized number assignment if both eyes met the inclusion criteria. All subjects underwent a complete ophthalmologic examination, SAP, FDT, Pulsar, GDx, and HRT within a 4-month period. Normal subjects were recruited from staff members and volunteers. POAG and OHT patients were recruited from the Ophthalmology Glaucoma Clinics. The three centers that participated in the study included: S. Maria della Misericordia Hospital, Udine, Italy; Discoveries in Sight, Devers Eye Institute, Portland, Oregon; and Centro Oftalmologico Sampaolesi y Fundacion Argentina Oftalmologica, Buenos Aires, Argentina.
Inclusion criteria were: best-corrected visual acuity better than or equal to 0.7; open anterior chamber angle; absence of ocular pathology other than glaucoma; reliable SAP, FDT, and Pulsar test results; good GDx and HRT image quality; and willingness to provide informed written consent. Exclusion criteria included: ametropia >±5 diopters (D), pupil diameter <2 mm; angle alterations; secondary causes of glaucoma; advanced glaucomatous VF defects; papillary anomalies; large peripapillary atrophy; media opacities preventing good image scans; diabetes mellitus; neurological disorders; medication that could modify VF results (ie, chloroquine, vigabatrin, pilocarpine, etc.); and previous intraocular surgery (excluding cataract surgery performed at least 6 months prior).
Intraocular pressure was measured with the Goldmann applanation tonometer (GAT; Haag-Streit International, Bern, Switzerland). Central corneal thickness (CCT) was measured with ultrasonic pachymetry (Altair pachymeter, Optikon 2000; S.p.A., Rome, Italy). In order to avoid false positive OHT patients, all GAT measurements were corrected on the basis of the CCT value according to the formula proposed by Doughty and Zaman: corrected GAT = measured GAT – [(CCT-535) × (2.5/50)].
Optic nerve head and RNFL appearance were assessed by an expert ophthalmologist (P.B., C.A.J., R.S.) with slit-lamp indirect ophthalmoscopy and a 78-D lens. Normal ONH and RNFL appearance was clinically defined as: inter-eye vertical cup-disk asymmetry <0.2; cup-to-disk ratio <0.6; and, the absence of diffuse or focal rim thinning, cupping, localized pallor, optic disk hemorrhage, or RNFL defects. ONH and RNFL were classified as GON if at least one of the following was evident: ONH excavation (ie, undermining of the neural rim); notching involving ≥2 clock hours; focal or diffuse atrophy of neural rim area involving ≥2 clock hours; disc hemorrhage; focal or generalized atrophy of the RNFL. The eyes were classified as GON based on masked consensus grading of the ONH by 2 expert graders. Adjudication by a third expert grader was completed in cases of disagreement.
Study Population
The patients were classified into four groups according to the following criteria:
- 1
Control group (90 eyes): normal intraocular pressure (IOP), ONH, and RNFL appearance, and SAP results; no family history of glaucoma and other ocular pathologies;
- 2
OHT group (87 eyes): IOP >21 mm Hg before medication corrected for central corneal thickness (CCT); normal ONH and RNFL appearance, and SAP results;
- 3
GON group (71 eyes): IOP >21 mm Hg before medication corrected for CCT, abnormal slit-lamp appearance of the ONH or RNFL clinically defined as GON, normal SAP results;
- 4
POAG group (80 eyes): IOP >21 mm Hg before medication corrected for CCT, reproducible glaucomatous SAP VF defects.
Instruments
SAP testing was performed using the Humphrey Field Analyzer (HFA) II 750 (Carl Zeiss Meditec Inc, Dublin, California, USA) 30-2 test with Standard Swedish Interactive Thresholding Algorithm (SITA) strategy.
Reliability criteria for HFA tests included false-positive <15%, false-negative <33%, and fixation losses <20%. A normal SAP result was defined according to the Hoddapp and associates criteria. SAP tests were classified as glaucomatous following the Anderson and Patella criteria. Only early glaucomatous SAP VF defects, having an mean deviation (MD) better than −5.0 decibels (dB) and a pattern standard deviation (PSD) <5.0 dB were included.
The Pulsar T30W test (Haag-Streit International, Bern, Switzerland) was used. The stimulus consists of a circular sinusoidal 5 degrees diameter grating pattern that is presented for 500 msec. The stimulus undergoes a counter phase pulse motion at 30 Hz, in which both spatial resolution (SR, from 0.5 to 6.3 cyc/deg on a 12-step log scale) and contrast (C, from 3 to 100% on a 32-step log scale) are simultaneously modified. Threshold sensitivity based on tendency oriented perimetry (TOP) threshold strategy is expressed in spatial resolution contrast units (src). Reliability criteria for Pulsar included false-positive and false-negative responses <33% and fixation losses <20%.
The FDT N-30 full-threshold procedure was used (Welch Allyn FDT, Skaneateles Falls, New York, USA and Carl Zeiss Meditec). The stimulus is a sinusoidal grating of low spatial frequency (0.25 cycles/degree) with high temporal frequency (25 Hz); using a Modified Binary Search (MOBS) strategy. The test uses 18 square 10 degrees × 10 degrees targets and 1 central 5 degrees × 5 degrees circular target. The reliability criteria used were fixation loss, false-negative, and false-positive <33%.
Confocal Scanning Laser Ophthalmoscope imaging with the HRT II (Heidelberg Engineering, Heidelberg, Germany, software version 1.4.1.5) was used. Exclusion criteria included: acquisition sensitivity <90%; standard deviation (SD) >40 microns; ONH not centered; poor image or frame clarity. HRT classification is based on the Moorfields Regression Classification (MRC) analysis, which includes: “Within normal limits” (confidence interval [CI] <95%); “Borderline” (95% to 99.9% CI); and, “Outside normal limits” (CI >99.9%). The MRC classification is given for the 360 degrees global rim area (MRC-Global) and for six 45 degree predetermined rim sectors.
Scanning Laser Polarimetry imaging was performed with GDx VCC (Carl Zeiss Meditec Inc, software version 5.1.0), the fourth generation SLP equipped with a variable corneal compensator (VCC), which allows individual compensation of other sources of ocular birefringence. The parameters include mean RNFL thickness average for: the entire 360 degrees (Temporal-Superior-Nasal-Inferior-Temporal [TSNIT] average); Temporal (335 degrees to 24 degrees), Superior (25 degrees to 144 degrees), Nasal (145 degrees to 214 degrees), and Inferior (215 degrees to 334 degrees) quadrants. Inclusion criteria included: quality scores greater than 8, residual anterior segment retardation ≤15 nm and typical scan score (TSS) >75. A low TSS is indicative of atypical patterns of retardation that can generate spurious RNFL thickness measurements.
Main Outcome Measure
Several parameters for each instrument were considered in the analysis, including:
Standard Automated Perimetry
MD, PSD, no. of significantly depressed points with P < 5% ( P < 5%) and P < 1% ( P < 1%) in the pattern deviation probability (PDP) plot, and test duration.
Pulsar
MD, SD of loss variance (sLV), no. of significantly abnormal areas with P < 5% ( P < 5%) and P < 1% ( P < 1%) in the comparison plot, and test duration.
Frequency Doubling Technology
MD, PSD, no. of significantly abnormal areas with P < 5% ( P < 5%) and P < 1% ( P < 1%) in the PDP plot, and test duration.
Heidelberg Retina Tomography II
All parameters listed on the HRT Stereometric Analysis printout.
GDx VCC
Nerve Fiber Indicator (NFI), TSNIT Average, TSNIT-SD, Superior Average, and Inferior Average.
Statistical Analysis
Left eye results were converted to a right eye format for the analysis. Differences between test results were calculated using the analysis of variance (ANOVA), and the Friedman test. Comparisons between groups were assessed using the ANOVA and the Kruskal-Wallis tests. Fisher least significant difference (LSD) test was used for pairwise multiple comparisons. Differences between proportions were evaluated using the χ 2 test.
The tests in assessing gold standard included: the most recent and repeatable HFA 30-2 test; IOP measurement with GAT corrected for CCT; and, clinical evaluation of ONH, and RNFL appearance with fundus biomicroscopy. The best cut-off point (defined as the value dividing healthy from POAG eyes with the highest probability), sensitivity (Se) at ≥80%, ≥90%, and ≥95% specificity (Sp) and area under the receiver operating characteristic curve (AROC) for detecting glaucoma were calculated for all considered parameters of the Pulsar Perimetry, FDT, HRT, and GDx VCC. The parameter from each instrument with the highest AROC in diagnosing glaucoma was included in the comparison among instruments. Differences among sensitivities and specificities were calculated using the χ 2 test; differences among the AROCs were evaluated using the Hanley-McNeil method.
Agreement of dichotomous classification (normal vs glaucomatous) at the best cut-off among the best parameters of each instrument was calculated with the Cohen Kappa test. Levels of agreement with Kappa statistic were defined as: excellent (>0.81); good (0.61 to 0.80); moderate (0.41 to 0.60); fair (0.21 to 0.40); and poor (<0.20). The statistical analysis was performed using SPSS 11.0 for Windows (SPSS Inc, Chicago, Illinois, USA). Statistical significance was defined as P < .05.
Results
Eyes that were excluded were: 2 with poor HRT image quality; 4 with poor GDx image quality; and 3 with unreliable SAP results. A total of 319 eyes met our inclusion criteria, including: 90 normal subjects, 87 OHT patients, 67 GON patients, and 75 POAG patient ( Figure 2 ). Table 1 lists demographics, clinical data, and SAP results. Table 2 lists the mean, SD, and comparison P values for all the parameters considered for all instruments in the 4 patient groups. Pulsar showed the shortest test time, while SAP showed the longest in all groups (data not shown; Friedman test, P = .002).
| Variable | POAG (75) Mean ± SD | GON (67) Mean ± SD | OHT (87) Mean ± SD | Controls (90) Mean ± SD | Groups Comparison ( P ) |
|---|---|---|---|---|---|
| Age (years) | 65.9 ± 11.0 | 63.9 ± 9.3 | 63.6 ± 10.3 | 53.4 ± 13.2 | .000 a , d |
| CCT (μm) | 553.1 ± 42 | 549.6 ± 37 | 540.8 ± 36 | 543.9 ± 26 | .181 b |
| IOP (mm Hg) | 25.7 ± 4.2 | 25.4 ± 3.4 | 25.3 ± 3.6 | 15.6 ± 3.0 | .000 a , d |
| Corrected IOP h (mm Hg) | 25.1 ± 4.2 | 24.8 ± 3.3 | 25.1 ± 3.5 | 15.1 ± 3.2 | .000 a , d |
| Abnormal ONH (% of eyes) | 72.5 | 100 | 0 | 0 | .000 c , e |
| SAP MD (dB) | −2.1 ± 1.5 | −0.9 ± 1.3 | −0.3 ± 1.4 | −0.04 ± 1.0 | .000 b , e |
| SAP PSD (dB) | 2.7 ± .9 | 1.7 ± .5 | 1.5 ± .4 | 1.4 ± .3 | .000 a , e , f |
| SAP x points with P < 5% | 11.7 ± 4.9 | 3.4 ± 2.5 | 2.5 ± 2.5 | 1.8 ± 1.7 | .000 a , e , f |
| SAP x points with P < 1% | 4.2 ± 2.6 | 0.4 ± 0.8 | 0.2 ± 0.7 | 0.1 ± 0.2 | .000 a , g |
| SAP time (s) | 471 ± 65 | 428 ± 56 | 416 ± 55 | 392 ± 32 | .000 b , e , f |
d No differences between POAG, GON, and OHT.
e No differences between OHT and controls.
f No differences between GON and OHT.
g No differences between GON, OHT, and controls.
| Instrument | Parameter | Patient Groups | ||||
|---|---|---|---|---|---|---|
| POAG (75) Mean ± SD | GON (67) Mean ± SD | OHT (87) Mean ± SD | Controls (90) Mean ± SD | Groups Comparison ( P ) | ||
| Pulsar | MD (src) | 2.9 ± 2.8 | 1.3 ± 2.9 | 0.4 ± 2.5 | −0.6 ± 1.6 | .000 a |
| sLV (src) | 3.0 ± 1.1 | 2.3 ± 0.9 | 1.9 ± 0.9 | 1.6 ± 0.6 | .000 a | |
| x areas P < 5% | 17.6 ± 16.2 | 7.2 ± 11.3 | 5.0 ± 10.6 | 1.3 ± 3.3 | .000 a , h | |
| x areas P < 1% | 9.6 ± 12.1 | 3.9 ± 8.7 | 2.7 ± 8.2 | 0.4 ± 2.7 | .000 a , e , h | |
| Test duration | 191.6 ± 18.4 | 195.2 ± 35.4 | 188.9 ± 20.4 | 187.9 ± 24.9 | .79 a | |
| FDT | MD (dB) | −1.9 ± 2.9 d | −1.0 ± 2.4 | −0.3 ± 2.3 | 0.01 ± 1.9 | .000 b , e , h |
| PSD (dB) | 4.8 ± 1.6 d | 4.2 ± 1.3 | 3.8 ± 1.0 | 3.5 ± 0.8 | .000 a , e , h | |
| x areas with P < 5% | 5.0 ± 3.6 | 2.8 ± 2.7 | 1.9 ± 1.9 | 0.7 ± 1.0 | .000 a | |
| x areas with P < 1% | 1.5 ± 1.9 | 0.5 ± 0.9 | 0.2 ± 0.4 | 0 ± 0 | .000 a , b | |
| Test duration | 270.0 ± 16.7 | 269.1 ± 18.7 | 269.9 ± 14.6 | 264.9 ± 17.0 | .262 b | |
| HRT II | Disc area (mm 2 ) | 2.07 ± 0.47 | 2.13 ± 0.46 | 1.92 ± 0.41 | 1.81 ± 0.51 | .000 b , d , e , f |
| Cup area (mm 2 ) | 0.83 ± 0.50 | 0.86 ± 0.46 | 0.46 ± 0.30 | 0.44 ± 0.38 | .000 a , d , e | |
| Rim area (mm 2 ) | 1.21 ± 0.34 | 1.27 ± 0.33 | 1.44 ± 0.33 | 1.37 ± 0.34 | .000 b , d , g | |
| Cup volume (mm 3 ) | 0.26 ± 0.27 | 0.24 ± 0.19 | 0.12 ± 0.19 | 0.11 ± 0.18 | .000 a , d , e | |
| Rim volume (mm 3 ) | 0.27 ± 0.14 | 0.29 ± 0.13 | 0.39 ± 0.15 | 0.37 ± 0.15 | .000 b , d , e | |
| C/D ratio | 0.38 ± 0.17 | 0.39 ± 0.15 | 0.23 ± 0.12 | 0.47 ± 0.31 | .000 b , d | |
| Linear C/D ratio | 0.59 ± 0.17 | 0.61 ± 0.14 | 0.46 ± 0.15 | 0.44 ± 0.16 | .000 a , d , e | |
| Mean cup depth (mm) | 0.28 ± 0.12 | 0.29 ± 0.10 | 0.21 ± 0.10 | 0.21 ± 0.10 | .000 a , d , e | |
| Maximum cup depth (mm) | 0.67 ± 0.23 | 0.70 ± 0.20 | 0.55 ± 0.24 | 0.59 ± 0.25 | .000 b , d , e | |
| Cup shape measure | −0.121 ± 0.076 | −0.124 ± 0.063 | −0.167 ± 0.084 | −0.203 ± 0.076 | .000 b , d | |
| Height variation contour (mm) | 0.35 ± 0.12 | 0.37 ± 0.10 | 0.39 ± 0.08 | 0.41 ± 0.10 | .001 a , d , e , f , h | |
| Mean RNFL thickness (mm) | 0.20 ± 0.12 | 0.20 ± 0.07 | 0.27 ± 0.15 | 0.26 ± 0.06 | .000 a , d , e | |
| RNFL cross-sectional area (mm 2 ) | 0.94 ± 0.46 | 1.05 ± 0.38 | 1.23 ± 0.34 | 1.23 ± 0.34 | .000 b , d , e | |
| Reference height (mm) | 0.34 ± 0.11 | 0.37 ± 0.12 | 0.35 ± 0.14 | 0.33 ± 0.12 | .46 b | |
| MRC-global (N/B/O) (x eyes) | 23/21/31 | 23/23/22 | 77/8/2 | 85/5/2 | .000 c , d , e | |
| GDxVCC | NFI | 34.1 ± 14.1 | 31.0 ± 15.9 | 20.6 ± 7.7 | 20.4 ± 7.6 | .000 a , d , e |
| TSNIT average (μm) | 49.4 ± 6.6 | 50.7 ± 6.9 | 55.2 ± 5.3 | 54.4 ± 5.1 | .000 b , d , e | |
| TSNIT SD | 17.4 ± 5.0 | 17.9 ± 4.3 | 20.1 ± 4.5 | 20.7 ± 3.7 | .000 b , d , e | |
| Superior average (μm) | 57.2 ± 8.6 | 58.7 ± 9.9 | 65.7 ± 7.6 | 65.6 ± 6.5 | .000 b , d , e | |
| Inferior average (μm) | 55.1 ± 9.4 | 56.9 ± 9.3 | 62.1 ± 8.1 | 61.6 ± 7.4 | .000 b , d , e | |
d No differences between POAG and GON.
e No differences between OHT and controls.
f No differences between POAG and OHT.
g No differences between GON and controls.
Best cut-off values, Se at ≥80%, ≥90%, and ≥95% Sp, and AROC for glaucoma diagnosis for all considered parameters of the four instruments are listed in Tables 3 and 4 ; the percentage of OHT eyes meeting the abnormality criteria calculated at the best cut-off are also reported. The single parameters associated with the greatest AROC for discriminating between glaucomatous and healthy eyes were respectively: sLV for Pulsar; no. P < 5% in the PDP for FDT; CSM for HRT; and NFI for GDx ( Tables 3 and 4 ; Figures 3 and 4 ).
| Instrument | Parameter | Best Cut-off c | Se at Best Cut-off | Sp at Best Cut-off | Se (%) at 80% Sp | Se (%) at 90% Sp | Se (%) at 95% Sp | AROC Mean ± SE | % Abnormal OHT Eyes a |
|---|---|---|---|---|---|---|---|---|---|
| Pulsar | MD (src) | >0.70 | 80.0 | 92.2 | 80.0 | 80.0 | 68.0 | 0.892 ± 0.03 | 32.2 |
| sLV (src) | >2.3 | 69.3 | 95.6 | 73.3 | 69.3 | 69.3 | 0.900 ± 0.03 | 31.0 | |
| x areas P < 5% | >4 | 70.6 | 100 | 78.6 | 73.3 | 72.0 | 0.883 ± 0.03 | 25.3 | |
| x areas P < 1% | >0 | 65.3 | 100 | 65.3 | 65.3 | 65.3 | 0.827 ± 0.04 | 20.7 | |
| FDT | MD (dB) | <−0.78 | 61.3 | 73.3 | 54.6 | 42.6 | 22.6 | 0.698 ± 0.05 | 42.5 |
| PSD (dB) | >3.89 | 76.0 | 87.8 | 77.3 | 72.0 | 48.0 | 0.845 ± 0.03 | 43.7 | |
| x areas with P < 5% | >1 | 81.3 | 90.0 | 81.3 | 81.3 | 70.6 | 0.897 ± 0.03 | 50.6 | |
| x areas with P < 1% | >0 | 57.3 | 100 | 57.3 | 57.3 | 57.3 | 0.787 ± 0.04 | 14.9 | |
| HRT II | Disc area (mm 2 ) | >1.97 | 62.6 | 73.3 | 37.3 | 22.6 | 16.0 | 0.691 ± 0.05 | 43.7 |
| Cup area (mm 2 ) | >0.68 | 65.3 | 87.8 | 65.3 | 52.0 | 41.3 | 0.789 ± 0.04 | 27.6 | |
| Rim area (mm 2 ) | <1.27 | 58.6 | 63.3 | 34.6 | 24.0 | 22.6 | 0.610 ± 0.05 | 29.9 | |
| Cup volume (mm 3 ) | >0.10 | 73.3 | 75.5 | 57.3 | 56.0 | 40.0 | 0.769 ± 0.04 | 35.6 | |
| Rim volume (mm 3 ) | <0.30 | 61.3 | 73.3 | 50.6 | 40.0 | 34.6 | 0.716 ± 0.04 | 25.3 | |
| C/D ratio | >0.34 | 61.3 | 57.7 | 2.6 | 0 | 0 | 0.518 ± 0.06 | 23.0 | |
| Linear C/D ratio | >0.56 | 66.6 | 83.3 | 68.0 | 57.3 | 49.3 | 0.805 ± 0.04 | 27.1 | |
| Mean cup depth (mm) | >0.25 | 57.3 | 78.8 | 57.3 | 46.6 | 42.6 | 0.741 ± 0.04 | 32.2 | |
| Maximum cup depth (mm) | >0.74 | 38.6 | 83.3 | 38.6 | 30.6 | 24.0 | 0.668 ± 0.05 | 25.3 | |
| Cup shape measure | >−0.151 | 65.3 | 90.0 | 72.0 | 65.3 | 48.0 | 0.816 ± 0.04 | 39.1 | |
| Height variation contour (mm) | <0.36 | 56.0 | 73.3 | 38.6 | 28.0 | 26.6 | 0.687 ± 0.05 | 35.6 | |
| Mean RNFL thickness (mm) | <0.23 | 68.0 | 75.5 | 54.6 | 41.3 | 40.0 | 0.764 ± 0.04 | 31.0 | |
| RNFL cross-sectional area (mm 2 ) | <0.99 | 58.6 | 78.8 | 54.6 | 37.3 | 30.6 | 0.698 ± 0.05 | 23.0 | |
| Reference height (mm) | >0.43 | 20.0 | 83.3 | 21.3 | 9.3 | 6.6 | 0.526 ± 0.06 | 24.1 | |
| MRC-global | B in ONL b | 57.3 | 92.2 | 57.3 | 58.6 | 30.6 | 0.753 ± 0.04 | 11.6 | |
| GDx VCC | NFI | >26 | 62.6 | 85.5 | 62.6 | 58.6 | 37.3 | 0.790 ± 0.04 | 18.7 |
| TSNIT average (μm) | <50.18 | 60.0 | 75.5 | 42.6 | 36.0 | 32.0 | 0.713 ± 0.05 | 20.0 | |
| TSNIT SD | <18.04 | 61.3 | 75.5 | 50.6 | 45.3 | 25.3 | 0.698 ± 0.05 | 38.7 | |
| Superior average (μm) | <60.90 | 70.6 | 78.8 | 65.3 | 41.3 | 37.3 | 0.781 ± 0.04 | 25.3 | |
| Inferior average (μm) | <54.10 | 38.6 | 87.8 | 40.0 | 36.0 | 25.3 | 0.682 ± 0.05 | 16.0 |
a Calculated at the best cut-off.
b B in ONL; borderline in outside normal limits.
| Instrument | Parameter | Best Cut-off c | Se at Best Cut-off | Sp at Best Cut-off | Se (%) at 80% Sp | Se (%) at 90% Sp | Se (%) at 95% Sp | AROC Mean ± SE | % Abnormal OHT Eyes a |
|---|---|---|---|---|---|---|---|---|---|
| Pulsar | MD (src) | >0.50 | 53.7 | 87.8 | 55.2 | 49.2 | 40.3 | 0.741 ± 0.04 | 34.5 |
| sLV (src) | >2.3 | 41.8 | 95.6 | 53.7 | 41.8 | 41.8 | 0.743 ± 0.05 | 31.0 | |
| x areas P < 5% | >2 | 47.8 | 92.2 | 53.7 | 47.8 | 46.3 | 0.714 ± 0.05 | 28.7 | |
| x areas P < 1% | >0 | 35.8 | 100 | 35.8 | 35.8 | 35.8 | 0.678 ± 0.05 | 20.7 | |
| FDT | MD (dB) | <−0.78 | 47.8 | 73.3 | 37.3 | 22.4 | 14.9 | 0.606 ± 0.05 | 42.5 |
| PSD (dB) | >3.83 | 53.7 | 83.3 | 53.7 | 40.3 | 17.9 | 0.711 ± 0.05 | 43.7 | |
| x areas with P < 5% | >1 | 59.7 | 90.0 | 59.7 | 59.7 | 38.8 | 0.802 ± 0.04 | 50.6 | |
| x areas with P < 1% | >0 | 34.3 | 100 | 34.3 | 34.3 | 34.3 | 0.672 ± 0.05 | 14.9 | |
| HRT II | Disc area (mm 2 ) | >1.97 | 58.2 | 73.3 | 40.3 | 32.8 | 16.4 | 0.707 ± 0.05 | 43.7 |
| Cup area (mm 2 ) | >0.67 | 64.2 | 85.5 | 65.7 | 49.2 | 40.3 | 0.807 ± 0.04 | 28.7 | |
| Rim area (mm 2 ) | <1.27 | 50.7 | 65.5 | 28.3 | 22.4 | 19.4 | 0.584 ± 0.05 | 29.9 | |
| Cup volume (mm 3 ) | >0.09 | 76.1 | 73.3 | 59.7 | 56.7 | 41.8 | 0.789 ± 0.04 | 40.2 | |
| Rim volume (mm 3 ) | <0.31 | 59.7 | 73.3 | 53.7 | 35.8 | 32.8 | 0.674 ± 0.05 | 26.4 | |
| C/D ratio | >0.34 | 59.7 | 60.0 | 0 | 0 | 0 | 0.533 ± 0.06 | 23.0 | |
| Linear C/D ratio | >0.56 | 74.6 | 81.1 | 74.6 | 59.7 | 44.8 | 0.826 ± 0.04 | 27.1 | |
| Mean cup depth (mm) | >0.24 | 64.2 | 78.9 | 59.7 | 53.7 | 49.2 | 0.776 ± 0.04 | 37.9 | |
| Maximum cup depth (mm) | >0.71 | 53.7 | 78.9 | 44.8 | 34.3 | 28.3 | 0.699 ± 0.05 | 32.2 | |
| Cup shape measure | >−0.151 | 68.6 | 87.8 | 68.6 | 64.2 | 46.3 | 0.832 ± 0.04 | 39.1 | |
| Height variation contour (mm) | <0.36 | 52.2 | 73.3 | 31.3 | 14.9 | 11.9 | 0.619 ± 0.05 | 35.6 | |
| Mean RNFL thickness (mm) | <0.25 | 73.1 | 65.5 | 43.3 | 32.8 | 28.3 | 0.710 ± 0.05 | 41.4 | |
| RNFL cross-sectional area (mm 2 ) | <0.99 | 41.8 | 76.7 | 38.8 | 28.3 | 25.4 | 0.618 ± 0.05 | 23.0 | |
| Reference height (mm) | >0.43 | 23.9 | 83.3 | 23.9 | 11.9 | 8.9 | 0.565 ± 0.05 | 24.1 | |
| MRC-global | B in ONL b | 68.6 | 92.2 | 68.6 | 68.6 | 35.8 | 0.803 ± 0.04 | 11.6 | |
| GDx VCC | NFI | >26 | 47.8 | 85.5 | 47.8 | 43.3 | 28.3 | 0.688 ± 0.05 | 18.7 |
| TSNIT average (μm) | <50.18 | 52.2 | 75.5 | 38.8 | 32.8 | 29.8 | 0.653 ± 0.05 | 20.0 | |
| TSNIT SD | <18.04 | 49.2 | 78.9 | 47.8 | 40.3 | 25.4 | 0.660 ± 0.05 | 38.7 | |
| Superior average (μm) | <62.10 | 53.7 | 75.5 | 47.8 | 37.3 | 29.8 | 0.687 ± 0.05 | 33.3 | |
| Inferior average (μm) | <54.10 | 41.8 | 87.8 | 41.8 | 34.3 | 23.9 | 0.643 ± 0.05 | 16.0 |
Stay updated, free articles. Join our Telegram channel

Full access? Get Clinical Tree


