Preoperative Considerations: Corneal Topography
Douglas D. Koch
Li Wang
Detailed examination of corneal curvature is an essential part of the workup before refractive surgery. Computerized videokeratography (CVK) plays several critical roles in the preoperative considerations of refractive surgery, including: (a) providing general information regarding the corneal shape; (b) detecting corneal warpage and monitoring the topographic stability after discontinuation of contact lens wear; and (c) detecting ectatic corneal disorders, such as keratoconus or keratoconus suspects, pellucid marginal degeneration (PMD), keratoglobus, or other topographic abnormalities.
ASSESSMENT OF CORNEAL SHAPE
Two principles of CVK exist: the reflection-based system and the projection-based system. Placido disk technology is based on the reflection principle and has been most widely accepted, used, and understood. The Placido target is projected onto the cornea and reflected off the tear film, which is in turn captured and analyzed to reconstruct the corneal shape. The Orbscan slit-scanning topography system (Bausch & Lomb, Rochester, NY) is the only commercially available device that uses the principle of projection to measure directly the corneal elevation.
Display of Corneal Shape
There are several ways in which the shape of the cornea can be measured and represented by color-coded maps.
Radius of Curvature
Radius of curvature can be calculated by two means:
Axial radius of curvature: Axial radius of curvature is calculated by measuring the perpendicular distance from the tangent at a point to the optical (or sagittal) axis. Although the axial map is the most commonly used CVK display, it has a spherical bias because each measured curvature is referred to the optical axis (1) (Fig. 69-1A).
Tangential (instantaneous/local) radius of curvature: Tangential radius of curvature is calculated at each point with respect to its neighboring points by fitting the best-fit sphere (BFS). Tangential radius of curvature shows more marked changes over smaller regions and provides more accurate measurements of corneal curvature, and certainly better representation of local irregularity, than axial radius of curvature (Fig. 69-1B).
Corneal Power
The radius of curvature (r, in meters) can be converted to power (P, in diopters) using a simplified paraxial formula by assuming that the rays of light striking the cornea are paraxial:
where n′ is the standardized value for keratometric index of refraction; 1.3375 is used for most CVK devices. The standardized value for keratometric index of refraction, n′, is not the true refractive index of the cornea but is an approximated index to yield the total corneal power as a single refracting surface by compensating for the negative power of the posterior surface. Corneal power relates to the patient’s refractive status, and is therefore frequently used in clinical practice; however, it is less accurate than the tangential curvature map when representing the corneal shape because of the paraxial assumption made during its derivation.
Corneal Height or Elevation
Corneal height or elevation is defined by the distance of each of point on the corneal surface from a reference plane. The reference plane is determined using a least-squares method, and the elevation display depends on reference surface size, shape, alignment, and fitting zone. Positive elevation measurements indicate that the corneal surface falls above the reference plane and are represented as warm colors, whereas negative values indicate that the corneal surface falls below the reference plane and are represented
as cool colors on the elevation maps (Fig. 69-2). Elevation maps have particular value in assessing postoperative visual problems and guiding topography-based ablation.
as cool colors on the elevation maps (Fig. 69-2). Elevation maps have particular value in assessing postoperative visual problems and guiding topography-based ablation.
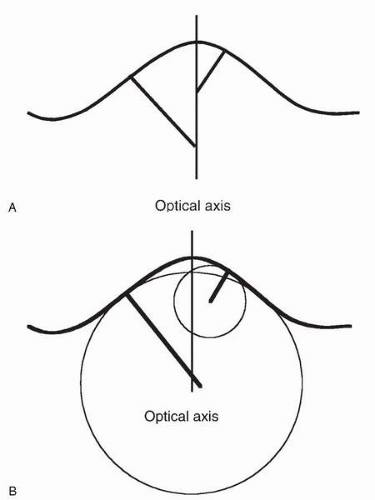 FIGURE 69-1. Two approaches for the calculation of corneal radius of curvature. A, Axial radius of curvature. B, Tangential radius of curvature. |
Color-Coded Maps
A number of different dioptric intervals have been recommended for standardized scales of color-coded maps. Scales with intervals greater than 0.5 D are useful for corneas with large dioptric ranges, and a 0.5-D scale is required to obtain sufficient detail regarding nuances that affect visual performance. Most topographers offer some type of standardized absolute scale and adjustable scales that allow the clinician to customize the information for maximal clinical value. It is critical first to check the scale and step interval when viewing a color-coded topographic map.
Numeric and Statistical Indices
CVK devices provide a number of numeric and statistical indices that can tremendously enhance analysis of topographic maps. The cursor can be moved to any position on the map and the information regarding its radius of curvature, power or elevation, and its distances and axis from the corneal center or the entrance pupil center are displayed. Most of the devices provide some type of numeric display, which gives numeric values along certain meridians and annular zones (Fig. 69-3). Statistical indices summarize particular features of the cornea:
Simulated keratometry (Sim K): Sim K is provided by all devices; this value attempts to mimic conventional keratometry readings and represents orthogonal curvatures at the 3-mm zone.
Mean values at central zone: Some systems display the mean values in certain central zones. For example, the effective refractive power (EffRP) from the Holladay Diagnostic Summary Display of the EyeSys Corneal Analysis System (EyeSys Technologies, Houston, TX) represents the mean refractive power of the cornea over the central 3-mm zone, taking into account the Stiles Crawford effect (2).
Surface regularity index (SRI): The SRI is a measure of the local regularity of the corneal surface in the central 4.5-mm diameter. SRI values increase with increasing irregular astigmatism and approach zero for a smooth corneal surface. Studies have demonstrated that the SRI is highly correlated with best spectacle-corrected visual acuity (BCVA) (3, 4, 5, 6).
Surface asymmetry index (SAI): The SAI measures the difference in corneal powers at each ring 180 degrees apart as a measure of symmetry. The SAI value would be zero for a perfect sphere, a surface with perfectly spherocylindrical regular astigmatism, and for any surface with power values that are radially symmetric (3).
Potential visual acuity (PVA) or predicted corneal acuity (PCA): PVA or PCA is an estimation of predicted visual acuity if the cornea is the only factor limiting vision. A study reported that the PCA appears to be most useful in predicting the BCVA in patients with normal corneas, but is less precise in patients with corneal abnormalities (7).
Asphericity: Asphericity is usually quantitatively described by the Q value. For a sphere, Q = 0. For prolate surfaces, Q < 0, and for oblate surfaces, Q > 0. Mean reported Q values ranges from −0.15 to −0.30 (8, 9, 10). Related parameters include eccentricity of the equivalent conic section (e), and shape factor (P), where Q = −e2, and P = Q + 1, respectively.
Keratoconus detection indices: A number of keratoconus detection indices are displayed by certain devices to estimate the likelihood of the presence of keratoconus; these are discussed in detail later.
Pattern Recognition
There are a variety of corneal topographic patterns in a normal population with good vision. Using the Corneal Modeling System, Bogan et al. (11) described five CVK patterns in normal corneas: round, oval, symmetric bow tie, asymmetric bow tie, and irregular. Naufal et al. (12) defined rasterstereography-based classification of normal corneas: island, regular ridge, incomplete ridge, irregular ridge, and unclassified. Using the EyeSys Corneal Analysis System, Budak and colleagues (13) provided a corneal topographic classification of myopic eyes based on axial, instantaneous, refractive, and profile difference maps. They defined six types of patterns for axial, instantaneous, and refractive maps: circular, circular with central bow tie, circular with central irregularity, symmetric bow tie, asymmetric bow tie, and irregular pattern.
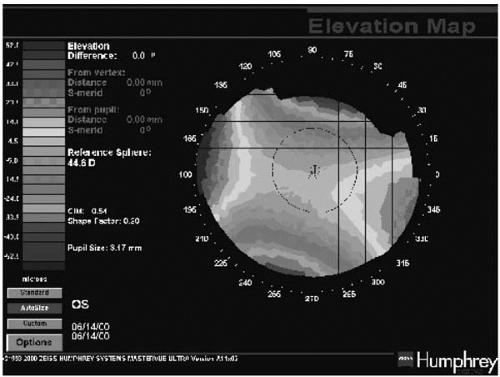 FIGURE. 69-2. Elevation map of a cornea with regular astigmatism. The elevated portion represents the flatter meridian of the cornea.(see color image) |
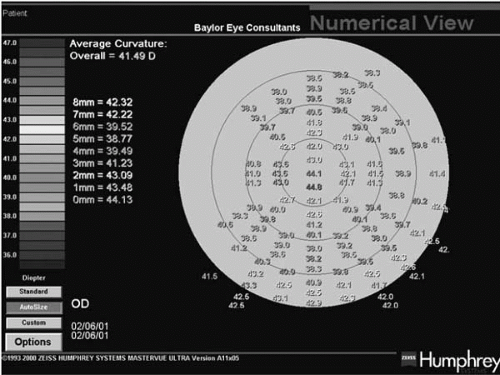 FIGURE 69-3. Numeric display from Humphrey Atlas.(see color image) |
Although there is large range of topographic appearances of a normal cornea, a pattern outside this spectrum should be classified as abnormal cornea only after careful investigation to rule out artifacts, such as improper alignment and focusing or tear film irregularities. Inspection of the videokeratoscopic ring image is often useful in this regard.
Role of Corneal Curvature Measurement in Surgical Planning
Although corneal curvature can be determined by standard keratometry, automated keratometry, and corneal topography, corneal topographic measurement offers the advantage of providing curvature values over the entire measured surface. As such, it can detect focal areas of steepening or flatness that could affect surgical planning, including the suitability of the patient for refractive surgery and the selection of the microkeratome. Overly flat or steep corneas may pose an increased risk for flap complications with certain microkeratomes. For example, buttonholes may be more likely to occur in eyes with corneas steeper than 46 D. Conversely, free caps may occur more frequently in corneas flatter than 40 D. Clinicians have suggested that corneas steeper than 48 to 50 D or flatter than 35 D may result in poor quality of vision, but we are unaware of any peer-reviewed data supporting these contentions.
Stay updated, free articles. Join our Telegram channel

Full access? Get Clinical Tree


