Purpose
To investigate the predictive factors for diabetic macular ischemia progression through the analysis of fluorescein angiography (FA) parameters.
Design
Retrospective, longitudinal study.
Methods
Data were collected from 79 eyes of 79 patients with type 2 diabetes mellitus. Macular ischemia severity was assessed using Early Treatment Diabetic Retinopathy Study (ETDRS) protocols and custom software used to quantify the foveal avascular zone (FAZ) area. Patients with ischemia grades “mild,” “moderate,” or “severe” and at least 2 macula-centered FA images over a minimum of 6 months were included. Main outcome measures were change in macular ischemia grades and FAZ enlargement rate (mm 2 /year).
Results
The median FAZ areas in mild, moderate, and severe ischemia grades at baseline were 0.28, 0.37, and 0.73 mm 2 , and significantly increased at the final FA (0.31, 0.41, and 1.23 mm 2 ) ( P = .001). The median duration of follow-up was 27.5, 31.0, and 24.0 months, and was not significantly different between groups. FAZ enlargement rates were higher in the more advanced ischemia grades—“severe” (0.073 mm 2 [10.4%]/year) compared to “mild” (0.021 mm 2 [7.50%]/year) ( P = .02) or “moderate” (0.019 [5.13%] mm 2 /year) ( P = .03). A greater ischemia severity grade was predictive for progression (odds ratio [OR] = 2.47, confidence interval [CI] = 1.21-5.05, P = .02). Macular ischemia progression itself was an independent predictive factor for visual acuity loss (OR = 4.60, CI = 1.54-13.7, P = .03).
Conclusions
The rate of FAZ enlargement ranges from 5%-10% of baseline FAZ area per year in eyes with established ischemia. A greater macular ischemia grade was independently predictive for progression, and diabetic macular ischemia progression itself was predictive of the loss of visual function.
Diabetic macular ischemia was first established using fluorescein angiography (FA) in the Early Treatment Diabetic Retinopathy Study (ETDRS). Owing to the requirement of angiography for its evaluation, diabetic macular ischemia has not been studied in the pivotal epidemiologic studies of diabetic retinopathy, and is consequently not well understood. Increasing our understanding of how quickly diabetic macular ischemia progresses, in whom it occurs, and its association with visual impairment is important in the clinical management of diabetic maculopathy. This may be of particular relevance because of emerging evidence for intravitreal pharmacotherapies, such as anti–vascular endothelial growth factor (VEGF), for the treatment of diabetic macular edema.
The ongoing controversy regarding the potential adverse effects of anti-VEGF therapies on macular ischemia is largely based on case reports and noncomparative cases series—in patients receiving treatment for diabetic macular edema, as an adjunctive treatment with pars plana vitrectomy in diabetic retinopathy, and in eyes treated for exudative age-related macular degeneration. These studies report that in the presence of macular ischemia, there is an adverse effect on outcomes, or a limit to the benefits of treatments. However, the deleterious effects of these intravitreal treatments on diabetic macular ischemia are far from clear. Firstly, larger prospective randomized trials, such as the Diabetic Retinopathy Clinical Research Network studies, did not address the potential effects of anti-VEGF therapy on ischemia. Secondly, the Bevacizumab Or Laser Therapy (BOLT) trial, the only prospective study that examined macular perfusion, found no clear associations between intravitreal injections of bevacizumab and macular ischemia at 4 months. In fact, a recent analysis of eyes with retinal vein occlusions has observed the opposite; that VEGF blockade with ranibizumab prevents, rather than worsens, “retinal nonperfusion.” Similarly, Neubauer and associates observed in eyes with diabetic macular edema an improvement in peripheral retinal ischemia after treatment with bevacizumab.
In our previous cross-sectional study, we found that 41.3% of patients with diabetes had some form of macular ischemia. However, a reduced visual acuity was only associated in those with moderate to severe disease (16.6%). It is not known if, or how quickly, diabetic macular ischemia progresses. Addressing the shortcomings in our knowledge of “diabetic macular ischemia progression” is likely to be of critical importance for a number of reasons. Firstly, the identification of those patients who are likely to progress may have considerable implications in those in a working age group. Secondly, it would aid in discerning between diabetic macular ischemia progression attributable to the natural history of the disease itself, or progression from the effects of treatments received, and may prevent the unnecessary exclusion of patients or untimely cessation of therapy.
In this report, we perform in-depth, longitudinal qualitative and quantitative analyses of the rate of progression for macular ischemia. We also examine clinical features at the baseline FA that may predict progression in an effort to identify parameters of interest for both clinical practice and future clinical trials.
Patients and Methods
Inclusion Criteria and Data Collection
In this retrospective cohort study, clinical and imaging data were collected from patients attending medical retinal clinics over a 6-month time period. Approval for data collection and analysis was obtained from the Institutional Review Board of Moorfields Eye Hospital, and adhered to the tenets set forth in the Declaration of Helsinki.
Patient demographic data, visual acuity, and retinopathy/maculopathy grades were obtained from standardized electronic reports in the United Kingdom National Screening Committee—Diabetic Eye Screening Programme, a grading system that has been described in more detail elsewhere. Patients with a diagnosis of type 2 diabetes who underwent an FA within 6 months of the study period were included. FAs were graded according to ETDRS protocols (see below), and eyes with ETDRS-defined diabetic macular ischemia grades of “mild,” “moderate,” or “severe” and at least 2 macular centered FA images, separated by a minimum interval of 6 months, were identified. Patients with a definite presence of macular ischemia—that is, those with “mild,” “moderate,” or “severe” macular ischemia grades—were included in order to assess the rate of progression and associations of this clinical entity. Exclusion criteria include ocular comorbidities such as retinal arterial or venous occlusion, epiretinal membrane, neovascular age-related macular degeneration, inherited macular disease, or macular scarring of any etiology. A total of 79 patients were identified; of these, 61 patients had both eyes meeting the criteria. From the remaining 18 patients, 1 eye was chosen from each patient using random block permutation and was included in the analysis. Clinical and imaging data from 2 time points were collected.
Acquisition and Analysis of Fluorescein Angiograms
Grading methods for macular ischemia
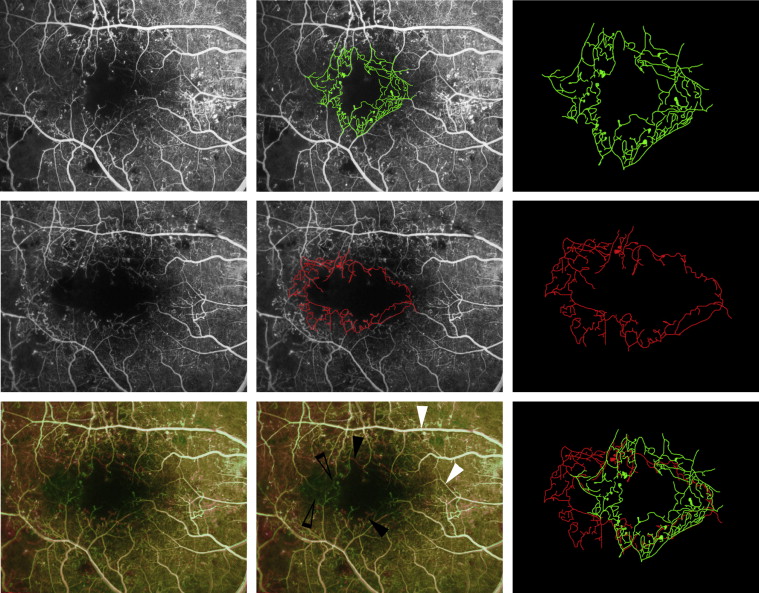
All angiographic images were acquired with a digital retinal camera system (Topcon TRC 50IX; Topcon Medical Systems Inc, Paramus, New Jersey, USA). One early-to-mid-phase image (at 20-40 seconds), centered on the macula, was chosen for analysis and no image manipulation was performed prior to grading. Figure 1 illustrates an example of FAs acquired over a period of 2 years. Macular ischemia was dual-graded by 2 masked assessors using protocols and standard photographs from ETDRS Report No. 11. According to these criteria, diabetic macular ischemia was classified as none, questionable, mild, moderate, or severe. Substantial intergrader agreement was demonstrated, with a weighted kappa of 0.704 (standard error = 0.087, 95% confidence interval [CI] = 0.535-0.874). In the case of disagreement between graders, open adjudication was used to resolve the final grading decision.
Change in macular ischemia grades
The “baseline” FA was defined as the FA taken at the earlier time point and “final” FA and the later time point. A change in the macular ischemia grade, for example from “moderate” to “severe,” was deemed as macular ischemia progression. FAs from both time points were graded in all eyes, and a change macular ischemia grade was defined as either “no change,” “improvement,” or “progression.”
Quantification of the foveal avascular zone
Quantitative analysis of all images was performed using a validated image viewer and grading software package (“GRADOR”; Doheny Image Reading Center, Los Angeles, California, USA) that facilitates planimetric measurements. Boundaries for the foveal avascular zone (FAZ) were manually delineated and area measurements calculated in square millimeters (mm 2 ), using a scale factor based on the camera’s angle of view.
Quantification of the rate of foveal avascular zone enlargement
The “baseline” and “final” FAZ areas were quantified using the FA from the earlier and later time points, respectively. The rate of FAZ enlargement was calculated as the difference in area between the “baseline” and “final” FAs, expressed over the time interval between FAs (mm 2 /year). The difference in area between the “baseline” and “final” FAs was also expressed as a percentage of the “baseline” FAZ size, in order to present the magnitude of change in FAZ size as a proportion of “baseline” measurements. This was similarly expressed over the time interval between FAs (%/year).
Statistical Analysis
Clinical and imaging data were analyzed with frequency and descriptive statistics. Snellen visual acuities were converted to logMAR (logarithm of the minimal angle of resolution) visual acuity for the purposes of statistical analysis. The Wilcoxon rank-sum test was used for analysis of changes between baseline and final measurements in paired samples. The Mann-Whitney U test was used to compare continuous variables, whereas the χ² test was used for categorical variables.
We developed models for each ETDRS-defined diabetic macular ischemia grade and visual acuity progression rates, and multivariable logistic regression analysis was used to test for associations. The results were presented as odds ratios (ORs) with 95% CI and P values < .05 were considered statistically significant.
Statistical analyses were performed using SPSS software version 16 (SPSS, Inc, Chicago, Illinois, USA).
Results
Patient Characteristics
A total of 79 eyes from 79 patients were analyzed. There were 24 female and 55 male patients with a median age of 63 (interquartile range [IQR], 56.5-70). At baseline, 44 eyes had either treated, or untreated proliferative diabetic retinopathy, and 35 eyes had either none, or nonproliferative diabetic retinopathy. There were 54 eyes with clinically significant macular edema, 13 with non–clinically significant macular edema, and 12 with no macular edema. In all eyes, the median FAZ area was 0.31 mm 2 (IQR, 0.22-0.43) at baseline and 0.39 mm 2 (IQR, 0.29-0.63) at the final FA. The median visual acuity was 0.3 logMAR (IQR, 0.2-0.5) both at the baseline and at final FA. The median time interval between FAs was 27 months (IQR, 16.5-53.5; range, 7-126).
Progression of Diabetic Macular Ischemia Grades
At the baseline FA, within 79 eyes analyzed, there were 42 eyes (53.2%) with “mild,” 24 (30.4%) “moderate,” and 13 (16.4%) “severe” macular ischemia grades. At the final FA, there were 39 eyes (49.4%) with “mild,” 25 (31.6%) “moderate,” and 15 (19.0%) “severe” macular ischemia grades. Fifty-eight eyes (73.4%) had no change or an improvement of macular ischemia grade between baseline and final FA, of which 31 had baseline macular ischemia grades of “mild,” 15 “moderate,” and 12 “severe.” In 9 eyes (11.4%), there was an improvement in the macular ischemia grade, from “moderate” to “mild” in 8 eyes and from “severe” to “moderate” in 1 eye. A total of 12 eyes (15.2%) showed progression in macular ischemia grades, 9 from “mild” to “moderate,” 1 from “moderate” to “severe,” and 2 from “mild” to “severe.” Analysis of the baseline macular ischemia grade subgroups revealed progression in 11 of 42 eyes (26.2%) in the “mild,” 1 of 30 (3.3%) in the “moderate,” and 0 of 7 (0%) in the “severe” grade.
The median FAZ area was observed to increase from baseline to the final FA across all macular ischemia grades, with 0.28 mm 2 (IQR, 0.19-0.35) to 0.31 mm 2 (IQR, 0.25-0.45) in the “mild,” 0.37 mm 2 (IQR, 0.28-0.47) to 0.41 mm 2 (IQR, 0.34-0.66) in the “moderate,” and 0.73 mm 2 (IQR, 0.64-1.03) to 1.23 mm 2 (IQR, 0.67-1.43) in the “severe” grades ( Figure 2 ). This was significantly different within each macular ischemia grade ( P = .001).
Rate of Foveal Avascular Zone Area Enlargement
The overall median enlargement rate of the FAZ area was 0.023 mm 2 /year (IQR, 0.001-0.060) ( Table 1 ). With a median baseline FAZ size of 0.31 mm 2 , this represents a FAZ area progression rate of 7.42% per year in all eyes. The enlargement rate was also examined in 6 categories, according to macular ischemia grade, diabetic retinopathy and maculopathy grade, baseline visual acuity, and loss of visual acuity (<0.05 logMAR/year) ( Table 2 ).
| Baseline FAZ Area (mm 2 ) | Final FAZ Area (mm 2 ) | Change in FAZ Area (Final – Baseline) (mm 2 ) | P Value | Time Interval Between Baseline and Final FA (Months) | Change in FAZ Area per Year (mm 2 /y) | Percentage Change in FAZ Area per Year (%/y) | |
|---|---|---|---|---|---|---|---|
| All eyes | 0.31 (0.22-0.43) | 0.39 (0.29-0.63) | 0.06 (0.01-0.16) | <.001* | 27.0 (16.5-53.5) | 0.023 (0.001-0.060) | 7.42 |
| Baseline macular ischemia severity grades | |||||||
| Mild (n = 42) | 0.28 (0.19-0.35) | 0.31 (0.26-0.45) | 0.05 ( 0-0.11) | <.001* | 27.5 (18.0-49.5) | 0.021 (0.001-0.060) | 7.50 |
| Moderate (n = 24) | 0.37 (0.28-0.43) | 0.39 (0.33-0.63) | 0.05 (0-0.14) | <.001* | 31.0 (18.5-60.8) | 0.019 (0.001-0.056) | 5.13 |
| Severe (n = 13) | 0.70 (0.38-0.95) | 0.82 (0.55-1.23) | 0.18 (0.08-0.40) | <.001* | 24.0 (18.0-36.0) | 0.073 (0.048-0.181) | 10.4 |
| Baseline FAZ area | |||||||
| Small (<0.3 mm 2 ) (n = 35) | 0.22 (0.16-0.27) | 0.28 (0.21-0.35) | 0.06 (0.02-0.11) | <.001* | 24.0 (14.0-42.0) | 0.023 (0.007-0.056) | 10.4 |
| Large (>0.3 mm 2 ) (n = 44) | 0.41 (0.36-0.59) | 0.55 (0.39-0.86) | 0.06 (0-0.20) | <.001* | 34.0 (18.0-59.8) | 0.024 (0-0.065) | 5.85 |
| Diabetic retinopathy grades | |||||||
| None or NPDR (n = 35) | 0.29 (0.22-0.35) | 0.34 (0.27-0.61) | 0.06 (0.02-0.18) | <.001* | 24.0 (16.0-35.5) | 0.040 (0.007-0.068) | 13.8 |
| PDR (n = 44) | 0.38 (0.27-0.55) | 0.41 (0.31-0.64) | 0.05 (0-0.14) | <.001* | 33.5 (16.8-58.3) | 0.021 (0-0.048) | 5.5 |
| Diabetic maculopathy grades | |||||||
| None or non-CSME (n = 30) | 0.31 (0.23-0.41) | 0.37 (0.29-0.61) | 0.06 (0.01-0.17) | <.001* | 28.0 (19.0-56.0) | 0.022 (0.001-0.061) | 7.10 |
| CSME (n = 49) | 0.34 (0.22-0.45) | 0.39 (0.30-0.70) | 0.05 (0.01-014) | <.001* | 27.0 (15.0-50.0) | 0.027 (0.001-0.057) | 7.94 |
| Baseline visual acuity (logMAR) | |||||||
| Good (<0.3) (n = 48) | 0.31 (0.23-0.40) | 0.38 (0.29-0.56) | 0.05 (0.01-0.12) | <.001* | 28.0 (17.8-63.8) | 0.019 (0.001-0.042) | 6.13 |
| Poor (>0.3) (n = 31) | 0.32 (0.22-0.80) | 0.48 (0.28-0.80) | 0.10 (0.02-0.21) | <.001* | 27.0 (14.0-47.0) | 0.046 (0.003-0.141) | 14.4 |
| Loss of visual acuity (<0.05 logMAR/y) | |||||||
| No (n = 56) | 0.32 (0.22-0.40) | 0.39 (0.30-0.55) | 0.04 (0-0.12) | <.001* | 34.0 (17.5-59.8) | 0.018 (0-0.042) | 5.62 |
| Yes (n = 23) | 0.30 (0.22-0.45) | 0.39 (0.28-0.97) | 0.10 (0.05-0.22) | <.001* | 19.0 (15.5-29.5) | 0.057 (0.026-0.124) | 19.0 |
| Comparison of FAZ Area Enlargement Rates per Year (mm 2 /y) | P Value |
|---|---|
| Baseline macular ischemia grades | |
| Mild vs moderate | .86 |
| Mild vs severe | .02* |
| Moderate vs severe | .03* |
| Baseline diabetic retinopathy grades | |
| None or nonproliferative DR vs proliferative DR | .11 |
| Baseline diabetic maculopathy grades | |
| None or non-CSME vs CSME | .88 |
| Visual acuity | |
| Baseline visual acuity (logMAR): good <0.3 vs poor >0.3 | .11 |
| Loss of visual acuity (<0.05 logMAR/y): yes vs no | .002** |
Stay updated, free articles. Join our Telegram channel

Full access? Get Clinical Tree


