Purpose
To identify neurosensory recovery, testing different functional variables during monthly intravitreal standard anti–vascular endothelial growth factor (VEGF) therapy in neovascular age-related macular degeneration (AMD).
Design
Prospective interventional cohort study.
Methods
Sixty-four treatment-naïve neovascular AMD patients with subfoveal lesions were treated and examined monthly for distance visual acuity, reading acuity, maximum reading speed, and contrast sensitivity and with microperimetry evaluating the percentage of absolute and relative scotoma and mean central retinal sensitivity weighted by area. Improvements in reading acuity, distance acuity, reading speed, contrast sensitivity, mean central retinal sensitivity, and scotoma area in dependence of age, lesion type, lesion size, and mean central retinal sensitivity were evaluated by a random-slope and random-intercept model. Recovery pattern of parameters was compared by correlating the individual slopes of each variable.
Results
Initially, a rapid short-term effect of anti-VEGF treatment was documented throughout all functional variables. Progressive functional gain over 1 year was observed for distance visual acuity ( P = .011), contrast sensitivity ( P ≤ .0001), and mean central retinal sensitivity ( P ≤ .0001), but not for reading acuity ( P = .31) and maximum reading speed ( P = .94). Decrease of absolute scotoma area missed statistical significance over time ( P = .053) and also fixation stability did not improve ( P = .08). However, lesion size influenced the course of absolute scotoma area ( P = .0015), while lesion type had no effect on any visual function variable evaluated. The individual slopes of reading acuity and distance visual acuity showed a moderate correlation; however, all other variables showed only a weak or no significant correlation among each other.
Conclusion
Visual recovery in anti-VEGF therapy is reflected in a characteristic pattern of functional changes over time, whereas distance visual acuity does not seem to comprehensively reflect overall visual function gain.
Visual function, particularly near visual function such as reading, is highly associated with quality of life. However, visual function and treatment response are usually assessed in clinical practice and in clinical trials solely by testing distance visual acuity (VA). Distance VA has been commonly reported to increase during follow-up, but concomitantly patients have reported stagnation of visual function during treatment. Distance VA is the method of choice to monitor the efficacy of treatment for neovascular age-related macular degeneration (AMD), even though in active disease impairment of reading acuity is more pronounced than distance VA and reading acuity has been shown to improve more than distance VA during treatment. Reading acuity would therefore be an alternative follow-up method, and the American Academy of Ophthalmology (AAO) practice pattern recommends it ( http://one.aao.org/CE/PracticeGuidelines/default.aspx ) as an adequate method to follow up patients with neovascular AMD. Comparison of distance VA with reading acuity, contrast sensitivity, and retinal sensitivity in studies of different ophthalmic diseases has led to the recognition that distance VA testing is not sufficient to reflect overall visual function. Furthermore, the method has been shown to correlate poorly with other visual function variables. However, most studies have been cross-sectional, examining a single time point rather than the course of visual function variables during treatment follow-up. Many studies have concentrated on the correlation of retinal thickness and visual function.
We designed a prospective longitudinal study in which patients who had been newly diagnosed with neovascular AMD were evaluated for neurosensory function and recovery during standard monthly anti–vascular endothelial growth factor (VEGF) therapy. Established classic functional variables were used for the evaluation.
We hypothesized that measuring higher-order visual function would improve vision assessment in patients with neovascular AMD and provide a realistic insight into the benefits of anti-VEGF therapy by reflecting all of the important visual function variables that contribute to visual performance in everyday life. In addition, a more reliable investigative method should be able to explain the mismatch between distance VA findings and patients’ subjective visual perception, leading to improved personalized therapeutic strategies and consequent enhancement of quality of life for patients with neovascular AMD.
Methods
Patient Selection and Setting
In this prospective longitudinal study, 64 eyes of 64 consecutive subfoveal treatment-naïve patients were observed. Patients who had recent onset of neovascular AMD and a distance VA ranging from 20/40 to 20/320 and who were willing and able to attend monthly visits were enrolled. The prospective study was approved by the local ethics committee, Medical University of Vienna, and registered at clinicaltrials.gov ( NCT01608113 ). The study design adhered to the tenets of the Declaration of Helsinki and all federal laws of Austria. Patients gave written informed consent after an extensive discussion about the purpose of the study and all the risks associated with participation. They were recruited at the Medical University of Vienna. Patients with cataract worse than grade 2 (according to Lens Opacities Classification System III), amblyopia, dyslexia, Alzheimer disease, or dementia were excluded. Overall intellectual reading capabilities were tested by binocular newspaper text reading before inclusion.
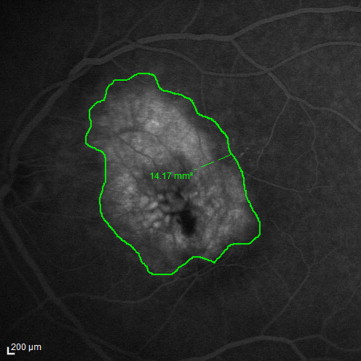
Examinations were performed before injection of anti-VEGF (baseline) and 1 day, 1 week, and 1 month after the initial injection. Thereafter examinations and anti-VEGF injections were given at monthly (28 days) intervals ± 3 days in accordance with the study protocol. Study examination included testing with distance best-corrected visual acuity (BCVA), Early Treatment Diabetic Retinopathy Study (ETDRS) charts, Radner reading charts for reading acuity and maximum reading speed, Pelli-Robson charts for contrast sensitivity, and microperimetry. Fluorescein angiography was performed with Heidelberg Retinal Angiography (HRA; Heidelberg Engineering, Heidelberg, Germany) at baseline and after 3, 6, and 12 months. Lesions detected with fluorescein angiography were classified either as type I or type II choroidal neovascularizations (CNVs); classic and predominantly classic angiographic lesion types were subsumed as type II CNV and occult and minimal classic lesions as type I CNV. Lesion size (mm 2 ) was measured at 10 minutes; for this purpose, the contours of the leakage extent were traced and the area was automatically calculated by the HRA-embedded software ( Figure 1 ). Heidelberg-Spectralis HD-OCT (Heidelberg Engineering, Heidelberg, Germany) was performed at each monthly visit.
Study Variables
BCVA was tested in both eyes using ETDRS charts at a distance of 4 m. Results were recorded as the logarithm of the minimal angle of resolution (logMAR) and visual acuity letter score.
Radner reading charts were used to test reading acuity with a luminescence of 90 cd/m 2 at a distance of 30 cm. The charts offer a reliable test for monocular reading acuity with high test-retest reproducibility in patients with low visual function. Similar to MNRead charts, each sentence is 0.1 logMAR units smaller than the previous sentence and the text is printed with high contrast. In contrast to the MNRead charts, logRAD charts consist of “sentence optotypes”; thus, all sentences are similar in grammatical difficulty and in the number, length, and position of words. This reading test is available in several languages and was designed to correlate distance VA and reading acuity as closely as possible. A difference of 0.1 log unit has been described between reading acuity measured by Radner reading charts and ETDRS visual acuity in healthy eyes.
Reading acuity was tested monocularly for both eyes. Sentences were covered and patients were asked to uncover and read each sentence aloud, from the largest to the smallest accessible font, as quickly as possible. Reading acuity was recorded as a logRAD score (reading equivalent of logMAR; logRAD score = logRAD + syllables misread × 0.005). Maximum reading speed was defined as the maximum number of words read per minute (wpm), measured with a stopwatch. The best maximum reading speed, independent of print size, was used for further analysis. All eyes were refracted to achieve BCVA, including presbyopic correction for reading. Patients who were unable to read the biggest letter size of 1.4 logRAD were given the logRAD score 2.0 with a maximum reading speed of 10 wpm.
Contrast sensitivity was evaluated using Pelli-Robson charts at a luminescence of 85 cd/m 2 using the total contrast sensitivity (CS) score ([number of letters −3] × 0.05, CS score).
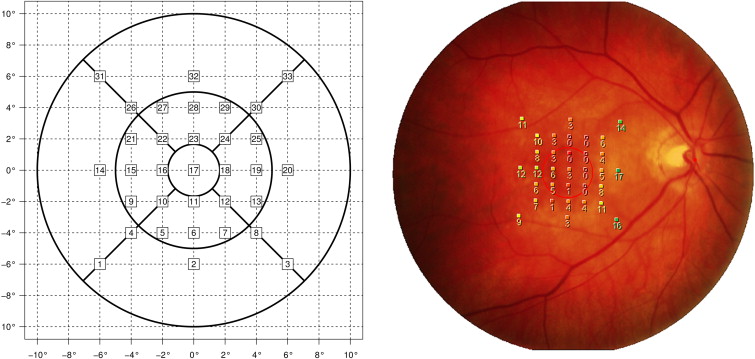
Microperimetry was performed with the MP-1 microperimeter (Nidek Advanced Vision Information System [NAVIS]; Nidek Technologies, Padua, Italy). The Cartesian grid generated consisted of 33 test points. The follow-up function was used for every follow-up visit. The fixation mark presented as a 3-degree circle and a 4-2-1 staircase strategy was used. The stimulus intensity ranged from 0-20 dB (0 dB refers to the strongest signal intensity of 127 cd/m 2 ) in 1-dB steps.
Stimulation loci representing an absolute scotoma (0 dB) were counted at every visit. Loci with sensitivity from 1-6 dB were considered severe relative scotoma and those with sensitivity from 7-12 dB as mild relative scotoma. Values above 13 dB were considered normal (= normal function loci). Afterwards, microperimetry data were exported in mpd format and analyzed using proprietary software developed by one of the authors (C.S.) to automatically transfer retinal sensitivity values for evaluation of mean retinal sensitivity according to the 1-, 3-, and 6-mm ETDRS grids. Thus, stimulation loci within a radius of 0.5 mm were automatically counted for the 1-mm central ETDRS grid, loci between 0.5 and 1.5 mm were automatically counted for the 3-mm ETDRS grid, and stimuli between 1.5 and 3 mm were automatically counted for the 6-mm ETDRS grid by the respective software ( Figure 2 ). The software then not only summarized mean central retinal sensitivity values but also calculated the mean retinal sensitivity value by weighting the sensitivity data by area. Besides mean retinal sensitivity, absolute and severe relative scotoma size was also evaluated by this software through interpolation. Absolute scotoma size was evaluated by multiplying each stimulation locus ≤0 with its associated area. Correspondingly, each stimulation locus ≤6 dB was multiplied with its associated area for the evaluation of the size of severe relative scotoma. The associated area varied according to the location of the loci, as central loci are closer to each other than peripheral loci ( Figure 2 ). Thus, respective scotoma size was automatically calculated in regard to the total area tested.
Fixation stability within 2 degrees and 4 degrees according to the MP-1 microperimetry examination set-ups was recorded at baseline and 3, 6, and 12 months after the initial treatment. The MP-1 automatically acquires about 25 fixation points per second. In accordance with a study by Fujii and associates, a finding of more than 75% of the fixation points inside the 2-degree-diameter circle was classified as a “stable” fixation, more than 75% fixation points inside the 4-degree-diameter circle and less than 75% inside the 2-degree-diameter circle as a “relatively unstable” fixation, and less than 75% inside the 4-degree-diameter circle as an “unstable” fixation.
Statistical Analyses
Distance VA (logMAR), contrast sensitivity (CS score), reading acuity (logRAD score), maximum reading speed (maximum wpm), and mean retinal sensitivity were the main outcome variables.
Time, age, and lesion type (type I vs type II) were independent factors for the respective functional variables; intercept and slope of a linear trend were random factors. In the prespecified analysis, data were analyzed by a random slope and random intercept model with an unstructured covariance matrix. The difference in fixation stability (stable, relatively unstable, unstable) between baseline and after 1 year was analyzed with a Wilcoxon signed rank test. Further, to correlate lesion size, lesion type, and absolute scotoma size, the effect of lesion size and lesion type adjusted for age and time on absolute scotoma size was analyzed using a similar random-slope–random-intercept model to that mentioned above, with the main outcome variable “absolute scotoma size” as a dependent variable and lesion type (type I vs type II), lesion size, time, and age as independent variables.
Pearson correlations were used to correlate the time course of the different functional variables with the individual slopes of the variables.
Statistical analyses were conducted with the statistics program R ( www.r-project.org ). Figures were also drawn with R. Descriptive statistics are reported as mean ± standard deviation for continuous data and as absolute frequency (percentage) for categorical data. The level of significance was set at P ≤ .05.
Results
Baseline Characteristics
Sixty-four eyes of 64 consecutive patients were included in this prospective longitudinal study. All patients received monthly treatments following a fixed regime. There were 3 early discontinuations: 2 patients left the study after 4 months (1 because of prostate carcinoma and 1 after complaints about the time-consuming study procedure), and 1 patient left the study after 6 months after a myocardial infarction. Because of missing data points, overall 61 patients were included in the per-protocol analysis. Mean age was 77.2 ± 8.5 years. Thirty-three patients presented an occult angiographic, 12 a classic angiographic, 12 a minimally classic, and 4 a predominantly classic lesion type. Thus, 45 patients showed type I lesions and 16 type II lesions. The mean lesion size at baseline was 7.5 ± 6.1 mm 2 : 7.9 ± 6.1 mm 2 in occult, 6 ± 5.6 mm 2 in classic, 7.1 ± 6.7 mm 2 in minimally classic, and 10.8 ± 6.6 mm 2 in predominantly classic lesions. Lesion size did not differ between lesion types (2-sample t test: type I: 7.7 ± 6.2, type II: 7.1 ± 6.0, P = .72).
Course of Visual Function Variables During Observational Period
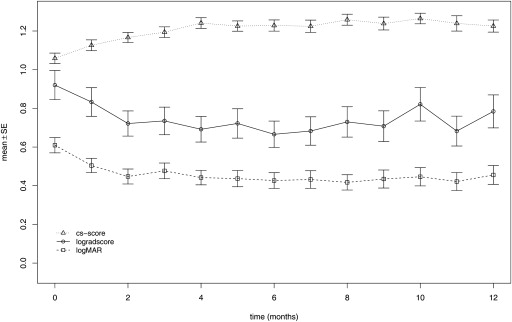
The mean values of the variables for functional testing evaluated are shown in Tables 1 and 2 . In general, all functional variables responded rapidly to treatment ( Tables 1 and 2 , Figures 3 and 4 ). However, progressive functional gain over 1 year was only seen in distance VA ( P = .011), contrast sensitivity ( P ≤ .0001), and mean central retinal sensitivity ( P ≤ .0001). No gain in reading acuity ( P = .31) and maximum reading speed ( P = .91) was seen. CNV lesion type had no influence on the course of any visual function parameter, whereas age affected contrast sensitivity ( P = .046) and central retinal sensitivity ( P = .02). Further details are provided in Tables 3 and 4 .
| Reading Acuity (logRAD Score) | Distance VA (logMAR) | Maximum Reading Speed (wpm) | Contrast Sensitivity (CS Score) | |
|---|---|---|---|---|
| Baseline | 0.93 ± 0.6 | 0.61 ± 0.32 | 108 ± 63 | 1.06 ± 0.22 |
| 1 day | 0.85 ± 0.53 | 0.55 ± 0.25 | 120 ± 62 | 1.06 ± 0.21 |
| 1 week | 0.85 ± 0.59 | 0.51 ± 0.26 | 119 ± 66 | 1.08 ± 0.26 |
| 1 month | 0.82 ± 0.57 | 0.50 ± 0.29 | 118 ± 60 | 1.13 ± 0.22 |
| 2 months | 0.70 ± 0.49 | 0.45 ± 0.30 | 125 ± 61 | 1.17 ± 0.20 |
| 3 months | 0.72 ± 0.53 | 0.48 ± 0.31 | 129 ± 64 | 1.20 ± 0.21 |
| 4 months | 0.68 ± 0.49 | 0.44 ± 0.29 | 124 ± 55 | 1.25 ± 0.20 |
| 5 months | 0.70 ± 0.57 | 0.43 ± 0.32 | 121 ± 61 | 1.22 ± 0.19 |
| 6 months | 0.67 ± 0.52 | 0.44 ± 0.31 | 124 ± 58 | 1.23 ± 0.22 |
| 7 months | 0.69 ± 0.55 | 0.43 ± 0.34 | 122 ± 64 | 1.23 ± 0.23 |
| 8 months | 0.71 ± 0.54 | 0.42 ± 0.28 | 119 ± 68 | 1.25 ± 0.20 |
| 9 months | 0.69 ± 0.54 | 0.43 ± 0.33 | 126 ± 63 | 1.24 ± 0.24 |
| 10 months | 0.81 ± 0.62 | 0.44 ± 0.35 | 116 ± 70 | 1.25 ± 0.20 |
| 11 months | 0.66 ± 0.52 | 0.42 ± 0.32 | 125 ± 65 | 1.24 ± 0.27 |
| 12 months | 0.80 ± 0.61 | 0.46 ± 0.36 | 111 ± 66 | 1.22 ± 0.22 |
| Absolute Scotoma Size a (mm 2 ) | Severe Relative Scotoma Size b (mm 2 ) | Absolute Scotoma c (n) | Severe Relative Scotoma d (n) | Mild Relative Scotoma e (n) | Normal Function Loci f (n) | Mean CRS (dB) | |
|---|---|---|---|---|---|---|---|
| Baseline | 4.7 ± 4.9 | 8.9 ± 5.4 | 10.5 ± 10.0 | 8.5 ± 5.9 | 9.1 ± 6.5 | 5.0 ± 6.8 | 7.3 ± 4.5 |
| 1 day | 5.1 ± 5.5 | 9.1 ± 5.7 | 9.3 ± 10.6 | 8.7 ± 7.6 | 9.0 ± 6.8 | 5.5 ± 8.1 | 6.9 ± 4.6 |
| 1 week | 3.6 ± 4.1 | 7.6 ± 5.3 | 8.5 ± 9.8 | 8.9 ± 6.4 | 9.6 ± 6.4 | 5.7 ± 7.6 | 7.8 ± 4.5 |
| 1 month | 0.82 ± 0.57 | 0.50 ± 0.29 | 7.4 ± 8.4 | 8.0 ± 6.0 | 9.0 ± 5.3 | 8.0 ± 8.9 | 8.8 ± 4.7 |
| 2 months | 3.4 ± 3.8 | 6.4 ± 5.2 | 6.8 ± 7.6 | 6.2 ± 5.1 | 9.7 ± 6.0 | 9.9 ± 9.5 | 9.6 ± 4.7 |
| 3 months | 2 ± 2.5 | 5.1 ± 4.6 | 5.0 ± 6.1 | 6.6 ± 5.9 | 11.3 ± 7.1 | 9.9 ± 9.7 | 10.2 ± 4.3 |
| 4 months | 2.4 ± 3.4 | 4.5 ± 4.7 | 5.2 ± 7.2 | 4.8 ± 4.8 | 9.9 ± 5.8 | 13.1 ± 10.4 | 11.2 ± 4.2 |
| 5 months | 2.2 ± 2.5 | 4.7 ± 4.3 | 5.1 ± 6.3 | 4.3 ± 4.4 | 10.5 ± 6.3 | 13.1 ± 10 | 10.8 ± 4.4 |
| 6 months | 2.6 ± 3.7 | 4.8 ± 5 | 6.0 ± 8.2 | 4.3 ± 4.7 | 10.1 ± 6.8 | 12.6 ± 10.1 | 10.8 ± 4.3 |
| 7 months | 2.6 ± 3.4 | 5.4 ± 5.8 | 6.4 ± 7. 7 | 5.7 ± 5.8 | 9.7 ± 6.2 | 11.5 ± 10.2 | 10.5 ± 4.9 |
| 8 months | 2.4 ± 3.2 | 4.8 ± 4.8 | 5.1 ± 7.3 | 4.5 ± 5.4 | 9.7 ± 6.6 | 13.7 ± 10.9 | 11.0 ± 4.5 |
| 9 months | 3 ± 3.7 | 5.4 ± 5.3 | 5.9 ± 7.8 | 4.67 ± 4.9 | 9.7 ± 6.5 | 12.7 ± 10.5 | 10.6 ± 4.7 |
| 10 months | 2.7 ± 3.2 | 5 ± 4.5 | 6.1 ± 7.6 | 4.4 ± 4.3 | 8.9 ± 5.8 | 13.6 ± 11.1 | 10.8 ± 4.8 |
| 11 months | 7,9 | 3.7 ± 3.8 | 4.8 ± 7.3 | 4.0 ± 4.3 | 9.9 ± 7.2 | 14.3 ± 11.0 | 11.6 ± 4.4 |
| 12 months | 2.4 ± 3.2 | 4.7 ± 4.5 | 5.8 ± 7.9 | 4.3 ± 3.8 | 9.9 ± 6.8 | 13.1 ± 10.8 | 10.8 ± 4.5 |
a Mean corresponding area of microperimetry test points presenting 0 dB threshold value at respective visit.
b Mean corresponding area of microperimetry test points presenting a 0-6 dB threshold value.
c Mean number of microperimetry test points (max. number: 33) presenting 0 dB threshold value at respective visit.
d Mean number of microperimetry test-points (max. number: 33) presenting a 1-6 dB threshold value.
e Mean number of microperimetry test points presenting a 7-12 dB threshold value.
f Mean number of microperimetry test points presenting a 13-20 dB threshold value.
| logRAD Score | Reading Speed (wpm) | |||
|---|---|---|---|---|
| Effect | Estimate [95% CI] | P Value | Estimate [95% CI] | P Value |
| Time | −0.005 [−0.01; 0.005] | .31 | −0.04 [−1.2; 1.11] | .94 |
| Age | −0.009 [−0.005; 0.025] | .21 | −0.37 [−2.0; 1.2] | .65 |
| Type II vs type I | 0.2 [−0.09; 0.49] | .17 | −29.18 [−60.3; 1.91] | .065 |
| Contrast Sensitivity Score | logMAR | |||
|---|---|---|---|---|
| Effect | Estimate [95% CI] | P Value | Estimate [95% CI] | P Value |
| Time | 0.011 [0.007; 0.015] | <.0001 | −0.007 [−0.01; −0.002] | .011 |
| Age | −0.008 [−0.01; −0.002] | .0046 | 0.008 [−0.001; 0.016] | .07 |
| Type II vs type I | 0.015 [−0.09; 012] | .78 | 0.08 [−0.08; 0.25] | .29 |
Stay updated, free articles. Join our Telegram channel

Full access? Get Clinical Tree


