Purpose
To predict the development of glaucomatous visual field (VF) defects using Fourier-domain optical coherence tomography (FD OCT) measurements at baseline visit.
Design
Multicenter longitudinal observational study. Glaucoma suspects and preperimetric glaucoma participants in the Advanced Imaging for Glaucoma Study.
Methods
The optic disc, peripapillary retinal nerve fiber layer (NFL), and macular ganglion cell complex (GCC) were imaged with FD OCT. VF was assessed every 6 months. Conversion to perimetric glaucoma was defined by VF pattern standard deviation (PSD) or glaucoma hemifield test (GHT) outside normal limits on 3 consecutive tests. Hazard ratios were calculated with the Cox proportional hazard model. Predictive accuracy was measured by the area under the receiver operating characteristic curve (AUC).
Results
Of 513 eyes (309 participants), 55 eyes (46 participants) experienced VF conversion during 41 ± 23 months of follow-up. Significant ( P < .05, Cox regression) FD OCT risk factors included all GCC, NFL, and disc variables, except for horizontal cup-to-disc ratio. GCC focal loss volume (FLV) was the best single predictor of conversion (AUC = 0.753, P < .001 for test against AUC = 0.5). Those with borderline or abnormal GCC-FLV had a 4-fold increase in conversion risk after 6 years (Kaplan-Meier). Optimal prediction of conversion was obtained using the glaucoma composite conversion index (GCCI) based on a multivariate Cox regression model that included GCC-FLV, inferior NFL quadrant thickness, age, and VF PSD. GCCI significantly improved predictive accuracy (AUC = 0.783) over any single variable ( P = .04).
Conclusions
Reductions in NFL and GCC thickness can predict the development of glaucomatous VF loss in glaucoma suspects and preperimetric glaucoma patients.
A fundamental challenge with glaucoma suspects is to estimate glaucoma progression risks and to intervene before significant damage to vision occurs. The appearance of risk factors on initial presentation can vary greatly. For instance, an individual with ocular hypertension may have a normal-appearing disc while another patient might have an abnormally high cup-to-disc ratio (CDR) but a low to normal intraocular pressure (IOP). Several studies have tried to identify and combine anatomic, visual field (VF), and epidemiologic variables to create a risk calculator. Investigators in the Ocular Hypertension Treatment Study (OHTS) and in OHTS validation studies developed a formula that tries to predict the onset of primary open-angle glaucoma (POAG) using a number of standard glaucoma variables: IOP, central corneal thickness (CCT), CDR, and VF indices. Although this formula summarizes standard clinical observations, the accuracy of predicting glaucoma conversion (ie, development of definitive glaucomatous damage in a suspect) was only fair, with the area under the receiver operating characteristic curve (AUC) of 0.68, according to an independent study. The accuracy of the OHTS calculator is limited by the variability of component variables, especially IOP, VF, and the CDR derived from subjective clinician grading. Song and associates found that within the same individual, the estimated risk can vary almost 10-fold.
Using digital imaging–derived variables to predict glaucoma conversion may provide greater accuracy owing to their objective and automated nature. Imaging also requires less sustained attentiveness from the test subject, a consideration that is especially relevant in the older age group affected by glaucoma. In this study, we investigate the use of Fourier-domain optical coherence tomography (FD OCT) anatomic measurements to predict the development of glaucomatous VF damage.
Methods
Participants
The data used for the study were taken from participants enrolled in the Advanced Imaging for Glaucoma (AIG) Study, a multisite bioengineering partnership and longitudinal prospective clinical study sponsored by the National Eye Institute ( ClinicalTrials.gov identifier: NCT01314326 ). The study design and baseline participant characteristics have been published in a separate paper, and the Manual of Procedures is available online ( www.AIGStudy.net ). Clinical data for the AIG Study were collected from 3 clinical centers, including the Doheny Eye Institute then at the University of Southern California (Now at University of California, Los Angeles), the University of Pittsburgh Medical Center, and the Bascom Palmer Eye Institute at the University of Miami. The study procedures adhered to the Declaration of Helsinki, which guides studies involving human subjects. Written consent was obtained from all of the participants and proper institutional review board approvals were obtained from all of the participating institutions.
One of the specific aims of the study was to predict conversion in glaucoma suspect and preperimetric glaucoma (GSPPG) eyes. The eyes categorized as glaucoma suspect (GS) do not have abnormal VF pattern standard deviation (PSD) or glaucoma hemifield test (GHT), and either the eye had ocular hypertension (IOP ≥22 mm Hg) or the fellow eye had perimetric glaucoma. Preperimetric glaucoma (PPG) eyes do not have abnormal VF PSD or GHT, but have a glaucomatous appearance of the disc or nerve fiber layer (NFL) on dilated ophthalmoscopy, defined as vertical cup-to-disc asymmetry greater than 0.2, notch or thinning of the neuroretinal rim, optic disc hemorrhage, or NFL defect. GS and PPG participants were seen every 6 months and received a comprehensive eye examination, VF tests, and imaging using FD OCT that was included in the AIG Study as a standard imaging procedure in 2006. Cataract patients were not excluded from the AIG Study. Details about inclusion and exclusion criteria are available online ( www.AIGStudy.net ). The VF tests were done on standard automated perimetry and repeated at least twice to get a reliable reading.
Optical Coherence Tomography Imaging
Three anatomic regions—the optic disc, peripapillary NFL, and macular ganglion cell complex (GCC)—were imaged and measured by FD OCT (RTVue; Optovue, Inc, Fremont, California, USA). During each visit, participants had 3 GCC and optic nerve head (ONH) scans. Only ONH scans with a signal strength index (SSI) above 37 and GCC scans above 42 were selected for analysis. Measurements in qualified scans in the same visit were averaged.
The macular GCC scan covered a 7 × 7-mm 2 area in the macula. Scans were centered 0.75 mm temporal to the fovea to improve the coverage of the temporal macula. The macular GCC thickness was defined as the combination of NFL, GCL, and inner plexiform layer. The automated Optovue software derived a 6-mm-diameter GCC thickness map centered 0.75 mm temporal to the fovea.
The ONH scans consisted of concentric (1.3–4.9 mm diameter) scans and radial scans (3.4 mm length) centered on the optic disc and automatically registered with the 3-dimensional disc scan to provide the disc margin information. The NFL thickness profile at D = 3.4 mm was resampled on the NFL map recentered according to the detected optic disc center. The radial scans were segmented to calculate the CDRs and optic disc rim area.
The RTVue software (version 6.12) was used to provide the following OCT image–derived measurements: (1) the overall, superior, and inferior hemisphere averages of the GCC thickness map; (2) the overall, superior, and inferior quadrant averages of the NFL thickness profiles; (3) CDRs and rim area; and (4) the pattern analysis of the GCC thickness map. In pattern analysis, the global loss volume (GLV) was used to measure a pattern of diffuse loss, whereas the focal loss volume (FLV) was used to measure more focal losses. Pattern analysis was also applied to the NFL using custom software by coauthor Ou Tan. The NFL pattern analysis is analogous to the RTVue GCC pattern analysis, but based on the NFL profile instead of the GCC map.
Glaucoma Conversion Event
The primary outcome event for participants in the GSPPG group was conversion to a confirmed abnormal VF, where PSD became abnormal ( P < 5%) or GHT fell outside of normal limits on 3 consecutive tests. This required a minimum of 4 total visits including the baseline visit, equivalent to a minimum of 1.5 years in follow-up time. Confirmation of VF conversion also required the clinical investigator to review the most recent eye examinations and determine that the VF change was likely due to glaucoma rather than confounding conditions such as cataract, macular disease, or other nonglaucomatous conditions. The conversion time was defined at the time of final confirmation.
Statistical Analysis
All statistical analyses were performed by SAS 9.3 (SAS Institute, Cary, North Carolina, USA). The primary analysis used Cox regression, which is suitable for time-to-event data. The participants had to have at least 3 follow-up visits to be eligible for inclusion in the analysis. For each of the covariates in the analysis, we provided a hazard ratio (HR) estimate and the corresponding P value. We also provided the AUC for the covariate to compare its relative predictive power in glaucomatous conversion.
For each of the FD OCT measurements, such as GCC overall thickness, borderline and abnormal categories were defined against normal values. Such categories are shown in yellow (borderline), red (abnormal), and green (normal) on the printout from the Optovue device. These categories were determined by cutoff values based on the proprietary database maintained by Optovue, Inc. Typically “borderline” represents values between the first and fifth percentile of the normal population, and “abnormal” represents values below the 1 percentile cutoff.
For categorical covariates, Kaplan-Meier survival curves were produced, and log-rank tests were used to compare risks among categories. We also provided HRs for IOP analysis, which, unlike other covariates, were recorded at the baseline visit. Four of the 5 IOP covariates were summaries from the baseline to the time of the conversion event or censoring (described below), including average, peak, range, and variation. It should be noted that the IOPs were measured from a mix of treated and untreated eyes, according to the decision of the patient and treating physician, as the treatment regimen is not mandated or randomized in the AIG Study.
Because many participants had both eyes enrolled in this study, we used a robust sandwich covariance estimation method in the Cox regression to adjust for this potential correlation. For other analyses, the generalized estimating equations method was used when applicable to adjust for intereye correlation.
All of the potential covariates were evaluated to build an optimal multivariate Cox regression model through a combination of manual elimination and automatic stepwise selection processes. When the optimal combination of the covariates was determined, the linear form was transformed through a logistic function. The resulting value, which ranged from 0 to 1, was defined as the glaucoma composite conversion index (GCCI). Values closer to 1 implied a higher risk of conversion. To avoid overestimate prediction accuracy of the GCCI, leave-one-out cross-validation (LOOCV) was used to calculate the AUC for GCCI.
All statistical analyses were performed with the SAS 9.3 software package (Cary, North Carolina, USA). The level of significance was set at P < .05.
Results
Among the GSPPG group consisting of 664 eyes from 394 participants, 513 eyes of 305 participants were included in the analysis while 151 eyes from 89 participants were excluded owing to fewer than 3 follow-up visits. In 21 participants, data following glaucoma surgeries were censored, while data preceding the surgeries were used. These surgeries included trabeculectomy, laser trabeculoplasty, glaucoma drainage device implantation, or laser iridotomy. After 41 ± 23 months of follow-up, 55 eyes from 46 participants experienced VF conversion.
The Venn diagram ( Figure 1 ) details the distribution of PPG and perimetric glaucoma (PG) participants based on enrollment criteria. Notably, the cohort had a majority of PPG (n = 359, 70%). Most GS participants (n = 154) had ocular hypertension, with a small fraction having PG in the fellow eye.
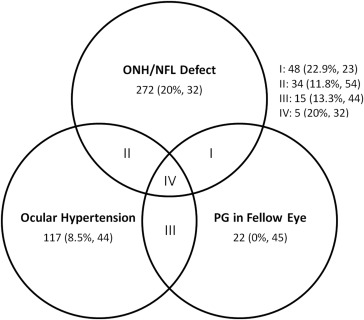
Table 1 summarizes the demographic characteristics of the cohort. Glaucomatous converters were significantly more likely to be female and to be treated with topical glaucoma medication. Older age was a risk factor of borderline significance. Race, systemic hypertension, diabetes, and family history of glaucoma were not significantly associated with conversion. Univariate Cox analysis also showed that these covariates were not significant risk factors.
| No Conversion N = 458 | Conversion N = 55 | P Value a | |
|---|---|---|---|
| Age | 61.0 ± 9.3 | 63.8 ± 8.5 | .058 |
| Female | 271 (59.2%) | 41 (74.5%) | .0027 |
| African origin | 55 (12.0%) | 8 (14.5%) | .82 |
| Hispanic ethnicity | 40 (8.7%) | 6 (10.9%) | .69 |
| Systemic hypertension | 128 (27.9%) | 18 (32.7%) | .46 |
| Diabetes mellitus | 28 (6.1%) | 5 (9.1%) | .4 |
| Family history of glaucoma | 215 (46.9%) | 24 (43.6%) | .19 |
| Baseline eye drops used: 0 | 314 (68.6%) | 23 (41.8%) | <.001 |
| 1 | 98 (21.4%) | 27 (49.1%) | |
| 2 or more | 46 (10%) | 5 (11%) | |
| Average number of eye drops used | 0.43 ± 0.72 | 0.67 ± 0.64 | .02 |
a P values were calculated from χ 2 tests; significance level set at .05.
Table 2 describes ocular characteristics. Univariate Cox regression analysis showed that female sex (HR = 2.0, P = .04) was a significant risk factor. CCT and axial length were similar in converters and nonconverters. There were also no differences between IOP averages and peaks of either group, but participants who converted had a wider IOP range and variation. Visual field stage, mean deviation (MD), PSD, and visual field index (VFI) were worse in participants who converted. Except for horizontal CDR, all FD OCT variables under study were significantly worse among converters.
| No Conversion N = 458 | Conversion N = 55 | P Value | |
|---|---|---|---|
| Anatomic variables | |||
| Central corneal thickness (μm) | 557.11 ± 39.70 | 558.80 ± 36.30 | .860 |
| Axial length (mm) | 24.19 ± 1.32 | 24.28 ± 1.52 | .946 |
| IOP | |||
| Ocular hypertension (frequency) | 154 (33.6%) | 17 (30.9%) | .57 |
| Baseline IOP (mm Hg) | 16.10 ± 3.93 | 16.78 ± 4.35 | .0755 |
| IOP average (mm Hg) | 15.53 ± 3.30 | 15.32 ± 2.87 | .2226 |
| IOP peak (mm Hg) | 18.60 ± 4.55 | 19.71 ± 5.02 | .2106 |
| IOP range (mm Hg) | 5.72 ± 3.41 | 8.37 ± 5.23 | .0062 |
| IOP variation (mm Hg) | 1.96 ± 1.12 | 2.69 ± 1.69 | .0066 |
| Visual field | |||
| GSS II VF stage 0 | 213 (46.5%) | 15 (27.3%) | <.001 |
| Borderline | 158 (34.5%) | 15 (27.3%) | |
| 1 | 80 (17.5%) | 21 (38.2%) | |
| 2 | 7 (1.5%) | 4 (7.3%) | |
| MD (dB) | −0.27 ± 1.27 | −1.05 ± 1.39 | <.0001 |
| PSD (dB) | 1.62 ± 0.39 | 1.92 ± 0.70 | .0033 |
| VFI (%) | 98.99 ± 1.89 | 98.32 ± 1.26 | .0008 |
| FD OCT | |||
| Rim area (mm 2 ) | 1.09 ± 0.32 | 0.90 ± 0.36 | .0013 |
| CDR, vertical (ratio) | 0.66 ± 0.16 | 0.74 ± 0.16 | .0001 |
| CDR, horizontal (ratio) | 0.74 ± 0.18 | 0.80 ± 0.16 | .0883 |
| CDR, area (ratio) | 0.45 ± 0.17 | 0.53 ± 0.20 | .0005 |
| NFL overall (μm) | 94.25 ± 10.09 | 88.72 ± 8.97 | .0002 |
| NFL inferior Q (μm) | 115.70 ± 14.82 | 107.13 ± 14.95 | .0003 |
| NFL superior Q (μm) | 114.56 ± 14.43 | 107.79 ± 14.52 | .0006 |
| NFL nasal Q (μm) | |||
| NFL temporal Q (μm) | |||
| NFL-GLV (%) | 9.31 ± 6.75 | 13.55 ± 6.82 | <.0001 |
| NFL-FLV (%) | 2.70 ± 2.85 | 4.08 ± 2.99 | <.0001 |
| GCC overall (μm) | 93.43 ± 8.17 | 88.87 ± 6.04 | <.0001 |
| GCC inferior H (μm) | 93.72 ± 8.53 | 88.47 ± 6.58 | <.0001 |
| GCC superior H (μm) | 93.15 ± 8.47 | 89.29 ± 7.41 | <.0001 |
| GCC-GLV (%) | 4.81 ± 4.82 | 7.63 ± 4.62 | <.0001 |
| GCC-FLV (%) | 1.00 ± 1.33 | 2.38 ± 2.14 | <.0001 |
Among the continuous baseline clinical variables ( Table 3 ), age and VFI were significant risk factors. Baseline IOP and CCT were not significant risk factors. Judging by the AUC, the VFI was the strongest non-OCT baseline predictive factor.
| Unit | Hazard Ratio | P Value | AUC (95% CI) | |
|---|---|---|---|---|
| Age (year) | 10 | 1.45 | .012 | 0.586 (0.508, 0.665) |
| Axial length (mm) | 1 | 1.06 | .566 | 0.509 (0.425, 0.593) |
| Central corneal thickness (μm) | −10 | 0.98 | .643 | 0.504 (0.410, 0.576) |
| IOP baseline (mm Hg) | 1 | 1.04 | .256 | 0.534 (0.454, 0.614) |
| IOP average (mm Hg) a | 1 | 0.99 | .749 | 0.516 (0.442, 0.591) |
| IOP peak (mm Hg) a | 1 | 1.05 | .108 | 0.565 (0.489, 0.640) |
| IOP range (mm Hg) a | 1 | 1.13 | <.001 | 0.676 (0.601, 0.751) |
| IOP variation (mm Hg) a | 1 | 1.48 | <.001 | 0.646 (0.571, 0.722) |
| VF MD (dB) | −1 | 1.57 | <.001 | 0.664 (0.584, 0.744) |
| VF PSD (dB) | 1 | 2.25 | <.001 | 0.691 (0.625, 0.757) |
| VFI (%) | −5 | 1.46 | .011 | 0.714 (0.644, 0.784) |
| FD OCT | ||||
| Rim area (mm 2 ) | −0.05 | 1.08 | .010 | 0.646 (0.559, 0.734) |
| CDR, vertical | 0.1 | 1.44 | .016 | 0.657 (0.567, 0.748) |
| CDR, horizontal | 0.1 | 1.15 | .156 | 0.586 (0.498, 0.674) |
| CDR, area | 0.1 | 1.27 | .024 | 0.623 (0.536, 0.713) |
| NFL overall (μm) | −10 | 1.58 | .001 | 0.662 (0.587, 0.736) |
| NFL inferior Q (μm) | −10 | 1.41 | .001 | 0.653 (0.573, 0.733) |
| NFL superior Q (μm) | −10 | 1.29 | .038 | 0.635 (0.553, 0.717) |
| NFL nasal Q (μm) | −10 | 1.38 | .017 | 0.600 (0.522, 0.678) |
| NFL temporal Q (μm) | −10 | 1.33 | .046 | 0.598 (0.519, 0.677) |
| NFL-GLV % | 1 | 1.06 | <.001 | 0.667 (0.594, 0.740) |
| NFL-FLV % | 1 | 1.12 | .004 | 0.655 (0.583, 0.728) |
| GCC overall (μm) | −10 | 2.04 | <.001 | 0.677 (0.609, 0.745) |
| GCC inferior H (μm) | −10 | 2.15 | <.001 | 0.689 (0.621, 0.756) |
| GCC superior H (μm) | −10 | 1.70 | .004 | 0.634 (0.556, 0.711) |
| GCC-GLV % | 1 | 1.09 | <.001 | 0.696 (0.631, 0.761) |
| GCC-FLV % | 1 | 1.49 | <.001 | 0.753 (0.683, 0.814) |
Stay updated, free articles. Join our Telegram channel

Full access? Get Clinical Tree


