Purpose
To investigate the appearance of postoperative spectral-domain optical coherence tomography (SD-OCT) and the relationship of the findings to visual acuity in myopic foveoschisis.
Design
Retrospective observational case series.
Methods
We studied 17 eyes (17 women; mean age, 66.4 years) with myopic foveoschisis. SD-OCT was performed preoperatively and 1, 3, 6, and 12 months after vitrectomy. The average central foveal thickness and choroidal thickness and the integrity of the foveal photoreceptor inner segment/outer segment junction as well as the external limiting membrane were correlated with the postoperative best-corrected visual acuity (BCVA).
Results
The mean refractive error was −11.9 diopters, axial length 29.7 mm, choroidal thickness 29.9 μm, and logarithm of the maximum angle of resolution (logMAR) visual acuity 0.52 at baseline. The mean preoperative central foveal thickness was 470.8 μm, which was not associated with age, refractive error, symptom duration, or BCVA. The mean postoperative retinal thicknesses at 1, 3, 6, and 12 months were 310.4, 251.8, 218.2, and 218.7 μm, respectively ( P < 0.01 at all time points). The final BCVA improved significantly ( P < 0.001). The preoperative BCVA ( P < 0.0001) difference in central foveal thickness between 3 and 12 months postoperatively ( P < 0.05), the final integrity of the inner segment/outer segment junction ( P < 0.05), and the ELM ( P < 0.05) were significantly associated with the final BCVA. The preoperative choroidal thickness was negatively associated with axial length ( P < 0.05) but not with postoperative central foveal thickness or BCVA.
Conclusions
The final BCVA in myopic foveoschisis is associated with the retinal thickness changes postoperatively and recovery of the photoreceptor cells as seen in OCT images.
Myopia causes various macular diseases, such as macular holes, foveoschisis, choroidal neovascularization, and chorioretinal atrophies, and often leads to blindness. Myopic foveoschisis, first described by Takano and Kishi, was recognized as a result of the development of optical coherence tomography (OCT). The prevalence of myopic foveoschisis has been reported to range from 8% to 34% in highly myopic eyes.
The pathogenesis of the disease remains uncertain but is believed to be associated with axial length elongation resulting from various tractional forces such as vitreous cortex, epiretinal membranes (ERMs), internal limiting membranes (ILMs), and retinal vessels. Vitrectomy, which reduces traction, is a reasonable treatment, and many studies have shown that vitrectomy results in good visual outcomes.
OCT is a useful modality for diagnosing and monitoring the morphologic recovery of the retina and, therefore, for predicting the postoperative visual acuity. For instance, OCT is useful in determining the visual recovery level after vitrectomy for ERMs or idiopathic macular holes. An intact photoreceptor inner segment-outer segment (IS/OS) junction is a good predictor of good visual outcomes after surgery for ERMs or idiopathic macular holes. Wakabayashi and associates reported that reconstruction of the foveal external limiting membrane (ELM) in the early postoperative period helps to predict subsequent restoration of the foveal photoreceptor layer and the potential for better visual outcomes. However, the relationships between visual recovery after surgery for myopic foveoschisis and morphologic characteristics have not yet been well investigated.
The purpose of the current study was to investigate the postoperative appearance on OCT and its relationship to visual acuity in patients with myopic foveoschisis. We measured the central foveal thickness and investigated the integrity of the photoreceptor IS/OS junction preoperatively and postoperatively.
Methods
Patients
We retrospectively reviewed the records of 103 eyes of patients who underwent vitrectomy for myopic foveoschisis at Osaka University Hospital, Osaka, Japan, between 2007 (after the introduction of spectral-domain [SD] OCT) and 2011. There are no drug dosages in the subjects. We defined high myopia as a refractive error exceeding −6.0 diopters (D) or an axial length exceeding 26.5 mm. Patients who underwent vitrectomy for myopic foveoschisis and who were followed longer than 12 months after the initial surgery were included. The exclusion criteria included a follow-up period shorter than 12 months, missing data such as the visual acuity measurement, SD-OCT images, poor-quality OCT images of the IS/OS or ELM line, severe chorioretinal atrophy affecting the OCT images, and the presence of an ERM. Eyes also were excluded if there was a macular hole of any size on a preoperative OCT image. The absence of a macular hole was confirmed by evaluating a 6 × 6 mm cube scan centered on the macula. We excluded 37 because of short follow-up periods, 31 eyes because of macular holes, 12 eyes because of missing data, and 6 eyes because of poor OCT image quality. Of 17 subjects, 17 eyes were included in this study. The internal review board of Osaka University Hospital approved this retrospective study protocol, and all patients provided written informed consent for undergoing the surgeries. The study adhered to the tenets of the Declaration of Helsinki.
Surgical Techniques
One surgeon (Y.I.) performed all surgeries. Cataract surgery was performed on all 12 phakic eyes. A three-port conventional 23- or 25-gauge vitrectomy was performed. Triamcinolone acetonide (0.2 ml of 20 mg/ml) first was injected into the vitreous cavity to visualize the vitreous. The vitreous cortex adhering to the inner retinal surface was removed gently with intraocular forceps or a vitreous cutter; 0.5 ml of 0.5% indocyanine green or 0.025% Brilliant Blue G was sprayed onto the posterior retina to stain the ILM. The ILM was visualized with indocyanine green in 12 (71%) eyes, with Brilliant Blue G in one (6%) eye, and with triamcinolone acetonide in four (23%) eyes. The ILMs of two- to three-disk diameters were peeled with forceps. Finally, fluid was exchanged with an air and gas tamponade using either 20% sulfur hexafluoride in 14 (82%) eyes or 14% or 16% perfluoropropane (2 eyes, 12%, and 1 eye, 6%, respectively). Postoperatively, the patients were instructed to remain in a prone position for 1 week.
Examinations
The best-corrected visual acuity (BCVA) measurements, color fundus photography (TRC-50, Topcon, Tokyo, Japan), and SD-OCT examinations (Cirrus HD-OCT, Carl Zeiss Meditec, La Jolla, CA, and RS-3000, Nidek, Gamagori, Japan) were performed during all preoperative and postoperative visits.
The retinal thickness was measured using SD-OCT preoperatively and 1, 3, 6, and 12 months postoperatively using the software in the instrument. A cube scan generated retinal thickness maps that showed the average retinal thickness in nine macular sectors. The central area (1-mm circle) was defined as the central foveal thickness used for statistical analysis, and we looked for associated factors such as the BCVA, symptom duration, axial length, intraocular pressure (IOP), and refractive error. The choroid also was depicted by SD-OCT. One author (S.F.) measured the choroidal thickness from the retinal pigment epithelium to the chorioscleral interface. The axial length was measured using the IOLMaster (Carl Zeiss Meditec); the IOP was measured using a noncontact tonometer (CT-90A, Topcon); and the refractive error was measured using an autorefractometer (ARK-530, Nidek).
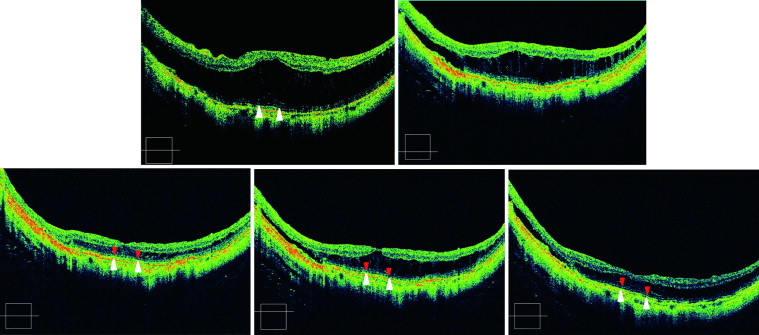
Optical Coherence Tomography Image Grading
One author (S.F.) evaluated the OCT images. We used a 5-raster scan with a high definition and high-quality image to score the IS/OS and ELM lines in order to maximize the signals. The scanned line, including the fovea, was always selected and evaluated. The continuity of the photoreceptor IS/OS line and ELM line was rated as positive (totally or partially continuous) or negative (totally absent) within 1 mm centered at the fovea. Figure 1 shows a representative example preoperatively and at 1, 3, 6, and 12 months postoperatively.
Statistical Analysis
The data were analyzed using JMP version 9.0 (SAS Institute, Cary, NC). One-way analysis of variance and the paired t test were performed as appropriate. P < 0.05 was considered significant.
Results
Demographic Data
The mean patient age was 66.4 ± 8.6 (mean ± standard deviation) years (range, 51 to 80 years), and the mean baseline IOP was 14.7 ± 3.5 mm Hg (range, 9 to 20 mm Hg). Twelve eyes were phakic and five eyes were pseudophakic. The mean refractive error of the phakic eyes was −11.9 ± 4.1 D (range, −4 to −16 D); the mean axial length was 29.7 ± 1.5 mm (range, 27.1 to 32.2 mm); the mean duration of symptoms was 12.2 ± 22.7 months (range, 1 to 96 months); and the mean preoperative choroidal thickness was 29.9 ± 15.9 μm (range, 0 to 68 μm). The preoperative choroidal thickness was negatively ( P < 0.05) associated with the axial length.
Time Course of Visual Acuity
Figure 2 shows the changes in the BCVA. The preoperative BCVA was 0.52 ± 0.39 logMAR unit. At 1, 3, 6, and 12 months, postoperatively, the BCVA values were 0.56 ± 0.49, 0.37 ± 0.33, 0.29 ± 0.31, and 0.30 ± 0.35, respectively. The postoperative BCVA was significantly better than the preoperative BCVA (3 months, P = 0.02; 6 months, P = 0.0005; 12 months, P = 0.0004 vs baseline) except at 1 month ( P = 0.73). The BCVA levels at 6 months ( P < 0.05) and 12 months ( P < 0.05 for both comparisons) were significantly better than at 1 and 3 months postoperatively. However, there was no significant ( P = 0.75) change in the BCVA between months 6 and 12 postoperatively.
Time Course of Retinal Thickness Changes
Figure 3 shows the changes in the central retinal thickness up to 12 months postoperatively. The retinal thickness at the central fovea was 470.8 ± 135.2 μm (range, 236 to 721 μm) preoperatively; 310.4 ± 115.3 μm (range, 163 to 556 μm) 1 month postoperatively; 251.8 ± 102.8 μm (range, 114 to 546 μm) 3 months postoperatively; 218.2 ± 86.8 μm (range, 25 to 439 μm) 6 months postoperatively; and 218.7 ± 65.4 μm (range, 151 to 396 μm) 12 months postoperatively. The postoperative retinal thickness values at 1 ( P = 0.0006), 3 ( P < 0.0001), 6 ( P < 0.0001), and 12 months ( P < 0.0001) were significantly smaller than the preoperative values. The differences in the central retinal thicknesses between preoperative values and 12-month postoperative values were −252.1 ± 127.0 μm (range, −85 to −538 μm). The retinal thickness values at 6 months ( P < 0.05) and 12 months ( P < 0.05) postoperatively were significantly smaller than at 1 month postoperatively. The retinal thickness values at 6 months ( P < 0.05) and 12 months ( P < 0.05) postoperatively were also significantly smaller than at 3 months postoperatively. However, there was no significant ( P = 0.97) change between 6 and 12 months.
No preoperative factors, such as age ( P = 0.47); refractive error ( P = 0.13); IOP ( P = 0.79); axial length ( P = 0.97); duration of symptoms ( P = 0.41); choroidal thickness ( P = 0.88); or preoperative BCVA ( P = 0.48) were associated with the preoperative retinal thickness. There was no significant relationship between the reduction of retinal thickness and age ( P = 0.17); refractive error (phakic eyes only) ( P = 0.54); IOP ( P = 0.58); axial length ( P = 0.84); duration of symptoms ( P = 0.72); preoperative choroidal thicknesses ( P = 0.86); preoperative BCVA ( P = 0.15); or BCVA changes ( P = 0.93).
Inner and Outer Segment Junction Line and External Limiting Membrane Line Recovery After Surgery
Figure 4 shows the percentage of eyes with intact foveal photoreceptor IS/OS junction and ELM. The IS/OS junction and ELM were visible preoperatively in four eyes (24%). One month postoperatively, there were no visible IS/OS lines in any subjects, and the ELM line was visible in only one eye (6%). The lines reappeared gradually in nine (53%) eyes on the images at the final visit. The IS/OS or ELM lines were not visible in seven (41%) eyes at the final visit. In one (6%) eye, the IS/OS line and ELM line were visible preoperatively but were not visible postoperatively.


