Purpose
To assess photoreceptor structure using adaptive optics scanning laser ophthalmoscopy (AO SLO) and spectral-domain optical coherence tomography (SD OCT) and to evaluate the relationship between structural abnormalities and foveal sensitivity in eyes with surgically closed macular hole (MH).
Design
Prospective, interventional case series.
Methods
Twenty-one eyes of 19 patients with idiopathic MH underwent a full ophthalmologic examination, including SD OCT at baseline. Imaging with SD OCT, an original prototype AO SLO system, and microperimetry were performed at 6 months after surgery.
Results
All patients underwent anatomically successful MH closure. On AO SLO, dark areas (0.004 to 0.754 mm 2 ) were seen in all eyes after MH repair. Lower cone density correlated with poorer postoperative visual acuity and lower mean foveal sensitivity (both P < .001). Larger dark areas on AO SLO correlated with poorer postoperative visual acuity ( P = .003) and lower mean foveal sensitivity ( P = .006). Cone density was significantly lower and dark areas were significantly larger in eyes that had defects of the outer segments in the fluid cuff before surgery ( P = .018 and P = .001, respectively) and moderately reflective foveal lesions after surgery ( P < .001 and P < .001, respectively). Larger dark areas correlated with longer symptom duration before surgery ( P < .001).
Conclusions
Structural damage to the photoreceptor layer correlated with greater decreases in visual function in eyes with surgically closed MH. AO SLO imaging is a useful and quantitative tool for detecting photoreceptor abnormalities and their association with visual acuity and retinal sensitivity in eyes with closed MH.
Idiopathic macular hole (MH) generally occurs in otherwise healthy individuals, is more common in women, and usually decreases previously normal visual acuity to less than 20/100. MH can be closed successfully with vitreoretinal surgical techniques, but complete anatomic closure does not always result in satisfactory recovery of visual acuity. In addition, some patients with closed MH continue to have symptoms such as relative scotoma and metamorphopsia.
Optical coherence tomography (OCT) has become the gold standard for the diagnosis of MH and for confirming anatomic closure after surgery. Structural changes in the photoreceptor layers of eyes with surgically closed MH, such as varying degrees of disruption of the junction between the photoreceptor inner segment and outer segment (IS/OS) and of the external limiting membrane (ELM), have been identified using time-domain OCT, ultra–high-resolution OCT, and spectral-domain (SD) OCT. These imaging methods, however, have not provided sufficiently clear images of individual photoreceptor cells to allow identification of a specific structural abnormality that may explain persistent visual disturbance in eyes with closed MH.
The primary reason for this failure is that ocular optics possess aberrations that can be compensated for by incorporating adaptive optics (AO)—specifically, either OCT or another imaging technique such as scanning laser ophthalmoscopy (SLO)—into the imaging system. An AO system consists of a wavefront sensor that measures aberrations of the entire eye and a deformable mirror or a spatial light modulator that compensates for these aberrations in living eyes. The addition of AO to imaging systems such as flood-illuminated ophthalmoscopes or SLO equipment has allowed researchers to obtain clear images of microstructural details in living eyes, including abnormalities in individual cone photoreceptors in patients with various retinal diseases.
In the current study, we used the AO SLO system to investigate relationships between structural abnormalities (decreased cone density and areas of cone loss) and visual function (foveal sensitivity, as measured by microperimetry and visual acuity) after surgical closure of MH, as well as relationships between structural abnormalities before and after surgery.
Methods
Participants
There were a total of 34 participants in this prospective, interventional case study. Nineteen were patients (21 eyes; 6 men and 13 women; mean age, 67.5 years; range, 55 to 82 years) with idiopathic MH, but without any other macular abnormality, glaucoma, or inherited color blindness; all patients visited the Kyoto University Hospital, Kyoto, Japan, between February 2010 and October 2010. The other 15 participants were healthy volunteers (15 eyes; 5 men and 10 women; mean age, 61.2 years; range, 35 to 72 years) with no eye diseases.
All patients had a diagnosis of primary stage 2, 3, or 4 idiopathic MH according to the staging system proposed by Gass ; we excluded eyes with secondary MH (eg, resulting from trauma; occurring after laser treatment; or because of cystoid macular edema resulting from inflammation, retinal vascular disease, macular pucker, or retinal detachment). We also excluded eyes with high myopia (axial length, > 26.5 mm). Finally, we excluded from the final study data analysis 1 eye of a study patient in which foveal detachment was diagnosed at the 6-month postoperative visit, because this condition precluded our evaluation of photoreceptors via AO SLO imaging.
Ophthalmologic Examinations
All patients in this study underwent comprehensive ophthalmologic examinations at baseline and 6 months after surgical closure of MH. The following characteristics were measured during baseline evaluations: best-corrected visual acuity (BCVA), assessed with the Landolt chart and expressed as the logarithm of the minimal angle of resolution (logMAR); intraocular pressure; and axial length, assessed using an IOL Master (Carl Zeiss Meditec, Dublin, California, USA). At the baseline, we also performed indirect ophthalmoscopy, slit-lamp biomicroscopy with a contact lens, color fundus photography, and SD OCT. At the 6-month postoperative evaluation, we measured BCVA and performed indirect ophthalmoscopy, slit-lamp biomicroscopy with a contact lens, color fundus photography, SD OCT, AO SLO, and fundus-monitoring microperimetry (MP-1; NIDEK, Padova, Italy).
All volunteers underwent a comprehensive ophthalmologic examination, including measurements of BCVA, intraocular pressure, and axial length; indirect ophthalmoscopy, color fundus photography; SD OCT; AO SLO; and microperimetry.
The Adaptive Optics Scanning Laser Ophthalmoscopy System
The AO SLO system used here was a simplified version designed and constructed in our laboratory based on previous reports detailing the usefulness of incorporating a wide-field SLO with an AO SLO. The AO SLO system is confocal, enabling creation of high-contrast en face images in any plane; these images show individual cone photoreceptor cells. The system comprises 4 primary optical subsystems: the AO subsystem, which includes the wavefront sensor and the spatial light modulator; the high-resolution confocal SLO imaging subsystem; the wide-field imaging subsystem; and the pupil observation subsystem, which facilitates the initial alignment of the subject’s pupil with respect to the optical axis of the AO SLO system through adjustment of the chin rest position. The wavefront sensor measures aberrations in the entire eye, and the spatial light modulator compensates for these aberrations. The details of the AO SLO system are described in the Supplemental Material ( Supplemental Material at AJO.com ).
Adaptive Optics Scanning Laser Ophthalmoscopy Imaging of Cone Mosaic Features
For each eye, we acquired a series of AO SLO images at each of several locations in the macula. The series at each location was acquired by shifting the focus from the retinal nerve fiber layer to the retinal pigmented epithelium (RPE), with particular attention being paid to acquisition of images that showed the cone mosaic. Then, offline, we created a montage of AO SLO images for each eye by selecting the area of interest and generating each image to be included in the montage from a single frame, without averaging. We verified correspondence between each montage and the area of interest by comparing the AO SLO image with the wide-field images for that eye.
To evaluate cones, we applied the automated cone labeling process of Li and Roorda, which uses an algorithm implemented in MATLAB (Mathworks, Inc, Natick, Massachusetts, USA) and a function from the MATLAB Image Processing Toolbox. After automated cone labeling, 2 independent experienced observers (S.O., K.T.) examined each image; if cones were visible, but had not been labeled, the observer manually labeled the areas where cones were visible and entered this area into the computer software program.
As has been reported for similar systems, we found that our system did not always allow clear visualization of individual cones within much of the central fovea. However, we could distinguish clearly individual cones more than 0.2 mm from the center of the fovea. Therefore, we obtained an estimate of cone density in areas 0.5 mm from the foveal center by instructing the computer software program to divide the number of cones in each imaging area by the size of the area. We measured cone density in each of 4 directions (superior, lower, nasal, and temporal), and the mean density was calculated from the densities in all 4 directions. To obtain accurate lengths of scans, we corrected the magnification effect in each eye by using the adjusted axial length method reported by Bennett and associates.
We quantified the extent of the dark areas (areas lacking cones) in AO SLO images by having the aforementioned independent experienced observers define and measure the dark areas in each eye using the Java-based image-processing software program ImageJ (National Institutes of Health, Bethesda, Maryland, USA). The total dark area in each eye was calculated as the mean of the total dark areas measured by the 2 observers.
Spectral-Domain Optical Coherence Tomography Evaluation of Photoreceptor Layer Features and Retinal Thickness Measurements
We used the Spectralis HRA+OCT (Heidelberg Engineering, Dossenheim, Germany) to perform SD OCT before and after surgery in all patient eyes. We obtained and evaluated 12 serial radial B-scan images through the fovea of each eye.
Photoreceptor inner and outer segment junction disruptions
We identified 2 abnormalities in the IS/OS junction on preoperative SD OCT images ( Figure 1 ) : (1) diffuse decreased reflectivity that extended to the outside of the MH (designated as preoperative IS/OS decreased reflectivity ); and (2) a focal disruption or defect in the line of reflectivity representing the OS, along with the ELM, curling toward the top of the image (externally), along the sides of the defect in the fovea (designated as preoperative OS defect in the fluid cuff ).
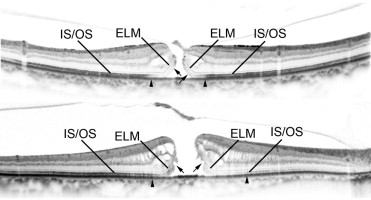
On postoperative SD OCT images, we defined abnormalities such as postoperative IS/OS junction disruption in a healed MH as decreased reflectivity of the IS/OS junction in the fovea ( Figure 2 ) . We also identified moderately reflective foveal lesions ( Figure 2 ).

We measured IS/OS junction reflectivity using the plot profile analysis function of ImageJ. This function displays a 2-dimensional graph of the intensities of pixels along a line within the image, with the x-axis representing distance along the line and the y-axis representing pixel intensity. The border of the IS/OS junction decreased reflectivity was defined as the line on the gray-scale image along which IS/OS junction reflectivity had diminished by 2 standard deviations from IS/OS junction reflectivity in the unaffected peripheral macula. We calculated the mean diameter of the decreased reflectivity areas from 12 radial B-scan images.
Preoperative OS defects in the fluid cuff and postoperative moderately reflective foveal lesions were evaluated independently by 2 graders in the Kyoto University OCT Reading Center, both experienced in evaluating OCT images and unaware of any clinical information, including AO SLO findings. When their evaluations did not agree, a third grader (S.O.) was consulted, and the results were discussed until consensus was reached.
Other measurements
We manually measured additional anatomic parameters (see below) on SD OCT images, both before and after surgery to close MH. For all measurements, reports and analyses were based on 12 radial B-scan images through the center of the fovea.
On preoperative images, we measured the basal diameter of the MH (averaged across all 12 B-scan images), MH height (maximal height of elevated foveal retina), and minimum diameter of the MH (minimum distance between the separated outer segments) by using the digital caliper tool built into the SD OCT system ( Figure 3 ) .
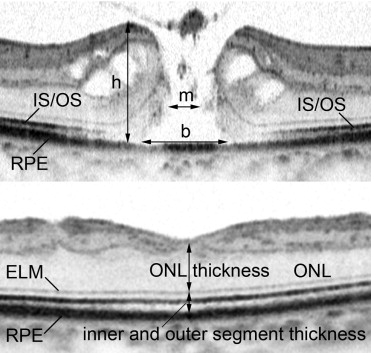
On postoperative images (obtained concurrently with AO SLO), we measured the thickness of the outer nuclear layer (ONL; the distance between the vitreoretinal interface and ELM) and the thickness of inner and outer segments (the distance between the ELM and the inner border of the RPE) at the center of the fovea ( Figure 3 ).
Retinal Sensitivity Measurements by Microperimetry
We used fundus-monitoring microperimetry to measure retinal sensitivity. The MP-1 software can be set to track fundus movements automatically and to evaluate every acquired frame for shifts in the directions of the x-axis and y-axis of the fundus with respect to a reference image obtained by an infrared camera at the beginning of the examination.
We used a 4–2-staircase strategy with a Goldmann size III stimulus against a white background with illumination of 1.27 cd/m 2 to examine 33 stimulus locations covering the central 6 degrees. The differential luminance, defined as the difference between stimulus and background luminances, was 127 cd/m 2 at 0 decibels (dB) of stimulation. Maximum stimulus attenuation was 20 dB, and the duration of the stimulus was 200 ms. In the current study, mean foveal sensitivity was defined as the mean of retinal sensitivities measured at 9 different points in the fovea.
Macular Hole Repair
MH was repaired in each case by standard 3-port pars plana vitrectomy (23-gauge system). Before vitrectomy, all phakic eyes underwent phacoemulsification and implantation of a posterior chamber intraocular lens. After core vitrectomy with intravitreal injection of triamcinolone acetonide to visualize the vitreous gel, we detached the posterior vitreous if detachment had not yet occurred, peeled the internal limiting membrane using 0.05% indocyanine green dye or triamcinolone acetonide, and performed fluid–gas exchange followed by flushing with a mixed nonexpansile solution of 25% sulfur hexafluoride. After surgery, patients were instructed to remain facedown for 7 days. Surgical MH repair was considered anatomically successful when postoperative biomicroscopy and SD OCT revealed a closed MH.
Statistical Analysis
We used paired t tests to compare preoperative and postoperative measurements of mean BCVA, foveal sensitivity, and IS/OS junction abnormality. Student t tests were used to evaluate cone density and the area of cone loss (dark area). We calculated the Pearson product moment correlation coefficient to determine associations between cone density/dark (cone loss) area and other variables. All statistical evaluations were performed using the commercially available software program SPSS version 17 (SPSS, Inc, Chicago, Illinois, USA). Significance was defined as P < .05.
Results
All patients underwent anatomically successful MH closure with no complications. Table 1 summarizes characteristics of patients and eyes before and during surgery. The median time from onset of visual symptoms to MH surgery was 2 months, and mean preoperative logMAR visual acuity was 0.584. Almost half of eyes had stage 2 MH; the mean minimum diameter of the MH was 303.5 μm. Before surgery, the mean IS/OS junction decreased reflectivity size was 1447.8 μm.
| Characteristic | Value |
|---|---|
| Patient age (y), mean ± 1 SD (range) | 67.6 ± 6.1 (55 to 82) |
| Patient gender, no. (%) | |
| Men | 6 (32%) |
| Women | 13 (68%) |
| Visual acuity (logMAR), mean ± 1 SD (range) | 0.584 ± 0.288 (0.155 to 1.301) |
| Axial length (mm), mean ± 1 SD (range) | 23.98 ± 1.30 (22.3 to 25.9) |
| Symptom duration (mos), mean ± 1 SD (range) | 2.5 ± 2.44 (0.5 to 12.0) |
| MH stage, no. (%) | |
| 2 | 10 (48%) |
| 3 | 6 (29%) |
| 4 | 5 (24%) |
| ILM staining, no. (%) | |
| With TA | 8 (38%) |
| With ICG | 13 (62%) |
| Minimum diameter of MH (μm), mean ± 1 SD (range) | 303.5 ± 153.6 (148 to 726) |
| Basal diameter of MH (μm), mean ± 1 SD (range) | 672.7 ± 323.2 (173 to 1482) |
| MH height (μm), mean ± 1 SD (range) | 376.2 ± 107.0 (160 to 532) |
| IS/OS decreased reflectivity size (μm), mean ± 1 SD (range), reflectivity decreased ≥ 2 SD | 1447.8 ± 894.6 (261 to 2514) |
| OS defect in the fluid cuff, no. (%) | 7 (33%) |
Table 2 summarizes characteristics of eyes at 6 months after surgical repair of MH. Surgical treatment of MH significantly improved mean visual acuity (logMAR values) and reduced mean diameter of IS/OS junction decreased reflectivity (both P < .001). The ONL and the inner and outer segments at the foveal center were thinner in surgically treated eyes than in normal eyes ( P = .038 and P = .002, respectively). The postoperative diameter of the IS/OS junction decreased reflectivity was smaller than the preoperative basal diameter of the MH in all eyes.
| Characteristic | Postoperative Value (MH Patients) | Preoperative Value (MH Patients) | Normal Eyes |
|---|---|---|---|
| Visual acuity (logMAR), mean ± 1 SD (range) | 0.225 ± 0.326 (−0.079 to 1.000) | P < .001 a | −0.127 ± 0.07, P < .001 b |
| Foveal sensitivity (dB), mean ± 1 SD (range) | 14.0 ± 4.3 | N/A | 19.5 ± 0.7, P < .001 b |
| Thickness of ONL at the foveal center (μm), mean ± 1 SD (range) | 97.8 ± 39.0 (37 to 197) | N/A | 122.1 ± 23.3, P = .038 b |
| Thickness of inner and outer segments at the foveal center (μm), mean ± 1 SD (range) | 67.0 ± 23.2 (21 to 92) | N/A | 86.0 ± 5.6, P = .002 b |
| IS/OS decreased reflectivity size (μm), mean ± 1 SD (range), reflectivity decreased ≥ 2 SD | 104.2 ± 150.9 (0 to 554) | P < .001 a | 0 |
| Cone density .5 mm from the foveal center (cones/mm 2 ), mean ± 1 SD (range) | 19 650 ± 10 970 (3182 to 43 198) | N/A | 31 775 ± 11 418, P = .003 b |
| Dark area within cone mosaic (mm 2 ), mean ± 1 SD (range) | 0.203 ± 0.222 (0.004 to 0.754) | N/A | 0 |
| Moderately reflective foveal lesion, no. (%) | 7 (33%) | N/A | 0 |
After MH repair, AO SLO revealed the presence of dark areas totaling 0.004 to 0.754 mm 2 in the foveae of all treated eyes ( Figures 4–7 ) . This was true even in eyes for which the postoperative SD OCT did not reveal any visible defects in the IS/OS junction ( Figure 4 ). Mean cone density in eyes with surgically closed MH was 19 650 cones/mm 2 , which was significantly lower than that of normal eyes ( P = .003; Table 2 ).
Stay updated, free articles. Join our Telegram channel

Full access? Get Clinical Tree


