Purpose
To investigate functional abnormalities in eyes with central serous chorioretinopathy (CSC).
Design
Observational case series.
Methods
Sixteen eyes with CSC were enrolled. Autofluorescence densitometry was performed to measure the optical density of the photopigments. Serial fundus autofluorescence (FAF) images were obtained by Heidelberg Retina Angiogram 2. We calculated the autofluorescence optical density difference from the FAF images. To compare the distribution pattern of autofluorescence optical density difference to the findings of outer retina, spectral-domain optical coherence tomography (SD-OCT) was performed in the acute phase and after resolution of CSC.
Results
The autofluorescence optical density difference decreased at the serous retinal detachment (SRD) in all 16 eyes. After resolution, the photoreceptor inner and outer segment junction (IS/OS) was irregular in 13 eyes and defective in 3 eyes on SD-OCT. The autofluorescence optical density difference did not improve in any eyes. Five eyes were reexamined 3 month after resolution. In 4 of the 5 eyes, SD-OCT showed that the IS/OS was well delineated and 1 eye defective. The autofluorescence optical density difference improved in 2 of the 4 eyes, but not in the other 2 eyes. In the 1 eye without well-delineated IS/OS, the autofluorescence optical density difference did not improve.
Conclusion
In eyes with CSC, the photopigment density decreased at the SRD. The density remained decreased immediately after resolution and showed delayed recovery. The photopigments decreased even in eyes with morphologic recovery of the outer retina.
Central serous chorioretinopathy (CSC) is characterized by serous retinal detachment (SRD) in the macular area. Focal dye leakage at the level of the retinal pigment epithelium (RPE) is seen on fluorescein angiography. In most eyes, the SRD resolves spontaneously, and the visual acuity (VA) recovers fully in these eyes. However, patients often complain about relative scotoma, abnormal color sensation, and micropsia despite resolution of the SRD.
Morphologic retinal abnormalities in CSC have been observed on optical coherence tomography (OCT). In the acute phase of CSC, thickened neurosensory retina and elongated photoreceptor outer segments are seen at the area of the SRD. In the quiescent phase, defects of the photoreceptor inner and outer segment junction (IS/OS) are sometimes seen. Thinning of the outer photoreceptor layer and the defects in the subfoveal IS/OS may be associated with VA loss.
Some studies using microperimetry have reported that retinal sensitivity was attenuated in eyes with CSC even after resolution of the SRD. Spectral-domain OCT (SD-OCT) showed loss of retinal sensitivity in areas with an irregular RPE or a defect of the IS/OS. Reduced amplitudes of the multifocal electroretinogram were observed not only in the acute phase but also after resolution of the SRD. Although these functional disorders seem to be associated with loss of the IS/OS or RPE atrophy, some patients complain about blurred vision even after complete morphologic recovery of the IS/OS. The role of the OCT findings in visual function is uncertain. In these cases, functional impairment might be attributed to decreases in the visual photopigments.
Retinal densitometry is the only objective method for investigating visual photopigments in vivo. Liem and associates, using reflective densitometry in eyes with CSC, reported that the rhodopsin concentration decreased in the area of the SRD. Since that method requires special equipment, it is not used clinically.
In a previous study, we reported other methods of retinal densitometry using the fundus autofluorescence (FAF) examination by commercially available scanning laser ophthalmoscope. We recorded serial FAF images using the Heidelberg Retina Angiogram 2 (HRA2; Heidelberg Engineering, Dossenheim, Germany), and calculated the photopigment density from the time-dependent changes in intensity of FAF during excitation. We named the technique autofluorescence densitometry. The density is measured as the autofluorescence optical density difference of the photopigments. This new technique can examine a much broader macular area than in previous studies and create a distribution map of optical density of the photopigments. It is also easy to compare the distributions of the photopigment densities with other retinal imaging devices such as SD-OCT. We used autofluorescence densitometry to evaluate changes in the photopigments in acute and quiescent phase of CSC.
Methods
Among 26 consecutive patients with CSC examined by both autofluorescence densitometry and SD-OCT, 16 eyes of 16 patients were included in this study (14 men, 2 women; mean age, 50.1 years; range, 31–71 years). All patients visited the Department of Ophthalmology at Fukushima Medical University Hospital between August 1, 2008 and May 31, 2009. The 16 eyes met the following criteria: the maximum diameter of the SRD exceeded 3 disc diameters including the fovea; autofluorescence densitometry was performed during the acute and quiescent phases; and resolution of the SRD was observed on SD-OCT during the follow-up period. The remaining 10 patients did not meet these criteria. In the 10 patients who were excluded, 8 patients had small SRD with maximum diameter less than 3 disc diameters, and 2 patients could not be followed up.
All patients underwent a comprehensive ophthalmologic examination, including measurement of the best-corrected VA, slit-lamp biomicroscopy, fundus photography, fluorescein angiography, SD-OCT, and FAF. The best-corrected VA was measured with a Japanese standard decimal visual chart and converted to logarithm of the minimal angle of resolution for statistical analysis. SD-OCT was performed with a 3-dimensional OCT system (Topcon, Tokyo, Japan) or Spectralis OCT system (Heidelberg Engineering, Heidelberg, Germany). The diagnosis of CSC was confirmed by the presence of a macular SRD and leakage from the level of the RPE on fluorescein angiography. Patients with other pathologies that can cause retinal detachment, such as age-related macular degeneration, Harada’s disease, posterior scleritis, and any other macular diseases, were excluded. All data were collected prospectively and reviewed in a masked fashion.
We also examined 10 control subjects (mean age, 40 years; age range, 31–55 years) who were free from retinal diseases, significant cataract, or corneal opacity. All subjects underwent the same examination as above except for fluorescein angiography.
Patients who needed good vision because of their occupations or desired treatment underwent laser photocoagulation after being informed of the risks and benefits. Treatment was performed using a DPSS yellow laser (561 nm; Nidek, Gamagori, Japan) with a spot size of 200 μm, power of 70 to 100 mW, and application time of 0.20 second. The endpoint of laser photocoagulation was slight graying of the RPE.
The autofluorescence optical density difference of the photopigments was measured repeatedly by the autofluorescence densitometry technique of the FAF examination to investigate time-dependent changes. We also evaluated the morphologic changes of the outer retina on the horizontal and vertical images of the SD-OCT. The area of interest was examined by raster scan. We classified the OCT findings of IS/OS in the area of SRD into 3 groups: clear, irregular, and defect. “Clear” indicates normal IS/OS line; “irregular” is discontinuous or blurred IS/OS line; “defect” means lack of IS/OS line.
The autofluorescence densitometry technique was described previously. The FAF images were recorded using HRA2. After pupil dilation with topical tropicamide and phenylephrine, the patients were dark-adapted for at least 30 minutes before the examination. Serial FAF images were obtained over 40 seconds using high-speed movie mode. The angle of field was 30 degrees. The intensity of excitation was 100% and the gain was 94%. The FAF images were aligned to fix the viewpoint using the software in the HRA2 system and were output as audio video interleaved (AVI) files for measurement. We measured the distribution of the FAF intensity in a 6 × 6-mm-square area around the fovea. The area was divided into 9 × 9 grids, and the intensity of each point was measured as an 8-bit grayscale value on the frame of the AVI files (Gray-val; Library Inc, Tokyo, Japan).
To estimate the autofluorescence optical density difference of the photopigments, the grayscale value during light exposure was fitted to the following formula. The intensity of the FAF at time t was described as:
where F(t) is the measured autofluorescence at time t, F(∞) is the autofluorescence at an infinite time when the F(t) approaches a constant level, fODD is the optical density difference of the pigment between the dark-adapted density and the density of the pigment after an infinitely long duration, and k is the time constant relating the chromophore properties and the intensity of light at the measurement site. We fitted the value of the FAF intensity to the equation on a least-squares basis with the Levenberg-Marquardt method, which provides the 3 unknown parameters (log[F(∞)], fODD, and k), using Origin 8.0 computer software (OriginLab Corporation, Northampton, Massachusetts, USA). The results were displayed using a contour map classified into 11 phases (autofluorescence optical density difference map). When the intensity of the autofluorescence decreased or the change in the autofluorescence intensity was too small to fit the equation at the measurement site, the autofluorescence optical density difference of the site was treated as zero.
Results
The Table shows the clinical patient profiles. The duration of symptoms from the subjective onset ranged from 1 to 49 months (mean, 10.4 months). Six patients with symptom duration of more than 6 months were diagnosed with chronic CSC. The other 16 patients were diagnosed with acute CSC.
In the current study, we observed all 16 eyes in the acute phase and immediately after resolution of the SRD. Five of the 16 eyes were reexamined 3 months after resolution. All eyes in the acute phase had focal leakage at the macular area on fluorescein angiography and a SRD that included the fovea. Eleven of the 16 eyes had an elongated photoreceptor outer segment on SD-OCT. Twelve of the 16 eyes were treated with laser photocoagulation. The SRDs resolved on SD-OCT between 3 and 54 months (mean, 13.4 months) from the subjective onset of symptoms.
The autofluorescence optical density difference map showed a concentric pattern in all 10 control subjects. Figure 1 shows a normal autofluorescence optical density difference map of a healthy subject (33-year-old man). All FAF and SD-OCT findings were normal ( Figure 1 , Top left, Middle). To calculate the autofluorescence optical density difference, time-dependent changes in the FAF intensity inside 9 × 9 grids were measured ( Figure 1 , Top left). Each grid was 60 × 60 pixels. The autofluorescence optical density difference map showed a normal concentric pattern ( Figure 1 , Top right). As the wavelength of the excitation light was 488 nm, the map mainly represented the distribution of rhodopsin.
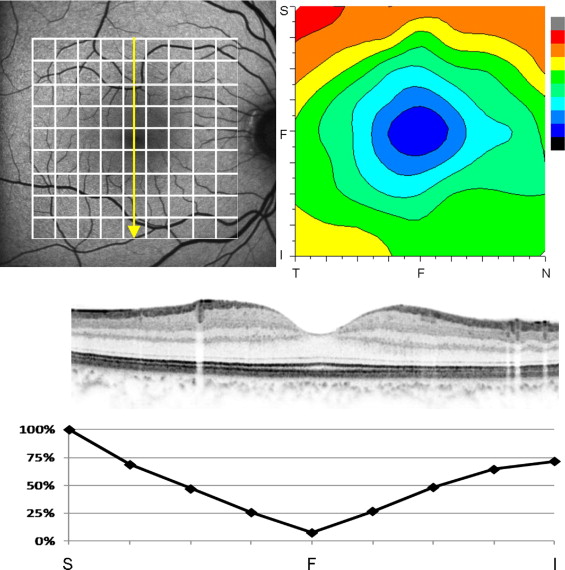
To evaluate the autofluorescence optical density difference at the affected area or to compare SD-OCT findings with autofluorescence optical density difference on the scanned line, we calculated the autofluorescence optical density difference percentage in each grid when the maximum value in the referred area was defined as 100% (% autofluorescence optical density difference). We defined the area in which the % autofluorescence optical density difference was 25% or lower as the low autofluorescence optical density difference area. Figure 1 , Bottom shows the % autofluorescence optical density difference along the vertical scan of SD-OCT ( Figure 1 , Middle) in a representative case.
The photopigments decreased in the detached retina during excitation in acute CSC ( Figure 2 ). Figure 2 , Right indicates the time-dependent changes in intensity during light exposure at the corresponding normal area, the SRD, the fovea, and the disc. In the normal area, the retina was bleached and the intensity gradually increased to a plateau. However, the intensity did not increase in the SRD area, indicating a decrease in the photopigments at the detached retina. The intensity remained constant at the fovea and disc.
In the acute phase of eyes with an SRD on SD-OCT, the autofluorescence optical density difference map showed an eccentric pattern in all 16 eyes ( Figures 3, 4, 5, and 6 ) . An area of low autofluorescence optical density difference (dense blue) was broader than that in normal eyes, and the area corresponded to the SRD ( Figure 4 , Top, and Figure 6 , Top). An area of high autofluorescence optical density difference (green, yellow, and orange) surrounded the area of low autofluorescence optical density difference. The % autofluorescence optical density difference also showed decrease in intensity corresponding to the area of the SRD on SD-OCT.
Stay updated, free articles. Join our Telegram channel

Full access? Get Clinical Tree


