Purpose
To determine whether patients with a sickle-cell hemoglobinopathy without glaucoma have peripapillary retinal nerve fiber layer (RNFL) thinning by spectral-domain optical coherence tomography.
Design
Prospective study.
Methods
All patients with a sickle cell hemoglobinopathy (sickle-cell disease, sickle-cell hemoglobin C disease, and sickle-cell thalassemia) and age-similar, race-matched controls underwent a comprehensive eye examination and spectral-domain optical coherence tomography of the macula and optic nerve head using the Heidelberg Spectralis (Heidelberg Engineering, Inc, Carlsbad, California, USA). Participants with prior retinal treatments (laser or surgery), diabetes mellitus, glaucoma, or other ocular diseases were excluded. The sickle-cell disease patients were grouped into those with focal macular thinning and those without. Those with macular thinning were grouped further into mild, moderate, and severe thinning groups based on temporal macular thickness. Analysis of variance testing and post hoc analysis with the Tukey test and Pearson correlation were performed to assess for peripapillary RNFL thickness differences among different groups.
Results
One hundred fifty-one eyes of 88 sickle-cell patients and 55 eyes of 30 age-similar and race-matched (black) controls were included. Sickle-cell patient eyes with macular thinning (n = 81) had thinner mean peripapillary RNFL thicknesses in the nasal sector ( P = .01) compared with non–sickle-cell control eyes and in the superotemporal sector ( P = .01) compared with sickle-cell patient eyes without macular thinning (n = 70). In the severe macular thinning subgroup (n = 55), the mean peripapillary RNFL thickness was significantly thinner than that of controls ( P < .05) in 6 of 7 sectors. There is a positive linear relationship between temporal macular thickness and global peripapillary RNFL thickness with a Pearson correlation coefficient of 0.60 ( P < .0001).
Conclusions
Nonglaucomatous, black sickle-cell patients with focal macular thinning on spectral-domain optical coherence tomography have significantly thinner peripapillary RNFL than those without macular thinning or controls. The degree of thinning correlates with severity of temporal macular thinning. These patients may require different peripapillary RNFL thickness thresholds for future glaucoma evaluations.
Patients with a sickle-cell hemoglobinopathy inherit an abnormal globin protein chain that results in occlusions in various vascular systems. Vascular occlusions occur from sickling of the erythrocytes, increased viscosity, and venostasis, especially in the setting of hypoxia, acidosis, and inflammation. Although sickle retinopathy occurs primarily in the retinal periphery, structural macular changes have been well documented by clinical examination, fluorescein angiography, histopathologic analysis, and more recently, spectral-domain optical coherence tomography (SD OCT). Previous studies from our group using SD OCT showed focal macular thinning in approximately 50% of eyes with sickle-cell hemoglobinopathy with no clinically significant maculopathy (Chau FY, et al. Invest Ophthalmol Vis Sci 2010;51:ARVO E-Abstract 3554). In those sickle-cell disease patients without obvious focal macular thinning based on SD OCT results, we found subclinical foveal thinning and splaying, as well as thinning in the outer retina in the central foveal subfield and the temporal parafoveal regions when compared to the SD OCT results of age-matched controls. The focally thinned areas in the macula correlate with decreased retinal sensitivities by microperimetry. However, knowledge about peripapillary retinal nerve fiber layer (RNFL) changes in sickle-cell patients, who are primarily black, is limited.
The goal of this study was to determine whether sickle-cell patients without glaucoma have peripapillary RNFL thinning and to correlate any changes with macular thinning on SD OCT. Our hypothesis was that macular thinning resulting from vaso-occlusion could lead to peripapillary RNFL thinning. In addition, sickle-cell patients are known to have more dilated and tortuous vessels. Because retinal vessels run within the RNFL and could contribute to the thickness of peripapillary RNFL, we determined if these factors could affect peripapillary RNFL measurements.
Methods
This was a prospective study design. The University of Illinois at Chicago Institutional Review Board approved this study. All patients gave informed consent to participate in this research before enrollment.
Patient Selection
All patients were referred to the University of Illinois at Chicago Ophthalmology Department from the Sickle Cell Clinic and had electrophoretic confirmation of sickle-cell disease, sickle-cell hemoglobin C disease, or sickle-cell thalassemia. Medical histories and sickle hemoglobinopathy type were recorded from the medical record. Initial evaluation included Snellen best-corrected visual acuity measurement, Goldmann applanation tonometry, slit-lamp biomicroscopy, and dilated fundus examination. Patients with lens or other ocular media opacities, extensive laser or cryotherapy treatment, diabetes mellitus, uncontrolled systemic hypertension, glaucoma, or clinical evidence of any other maculopathies were excluded from the current study. Healthy black patients between 18 and 70 years of age (the same age range as our study subjects) who sought treatment at the general eye clinic for routine eye examinations and were without ocular disease, glaucomatous optic nerve changes, macular disease, or sickle-cell hemoglobinopathy served as controls.
Macular and Peripapillary Retinal Nerve Fiber Layer Optical Coherence Tomography Measurements
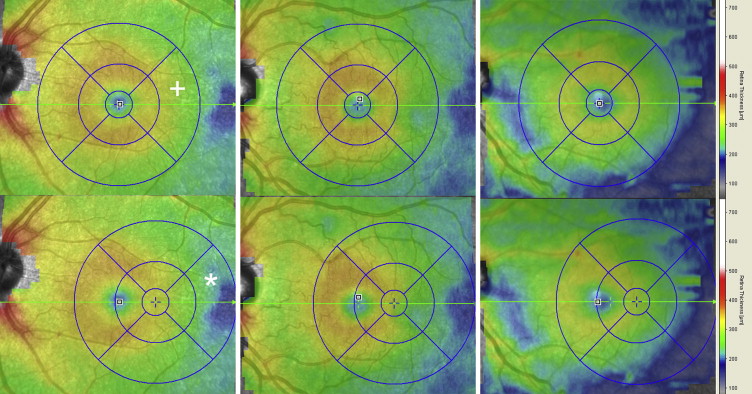
All patients underwent SD OCT imaging (Spectralis; Heidelberg Engineering, Inc, Carlsbad, California, USA) of the macula and optic nerve head at the time of enrollment. All images were obtained by trained ophthalmic photographers. For macular scans, large scans (9 × 7.5 mm, 31-line scans) encompassing the entire Early Treatment Diabetic Retinopathy Study (ETDRS) subfields as well as the neighboring more temporal regions were obtained. Focal macular thinning was defined as an abrupt asymmetric decrease in retinal thickness confirmed on the thickness map and B-scan as described previously by our group. The sickle-cell disease patients were grouped into those with and without focal macular thinning. Clinically, focal thinning occurred almost exclusively in the temporal and far temporal region, and the severity of macular thinning can be distinguished by the area of thinning as well as color (darker blue equals thinner) on the thickness map. However, because there are no published standards in grading the severity of macular thinning, we elected to categorize patients into mild, moderate, and severe groups based on retinal thickness in the far temporal region as follows. On the thickness map screen within native Heidelberg software, the ETDRS subfield target was moved horizontally to as far temporally as possible. The mean thickness value in the temporally shifted, perifoveal temporal (outer ring) subfield was recorded for all patients ( Figure 1 ). Mild was defined as a mean value within 1 standard deviation of the mean of the control group, moderate was defined as between 1 and 2 standard deviations less than the control mean, and severe was defined as thinner than 2 standard deviations of the control mean.
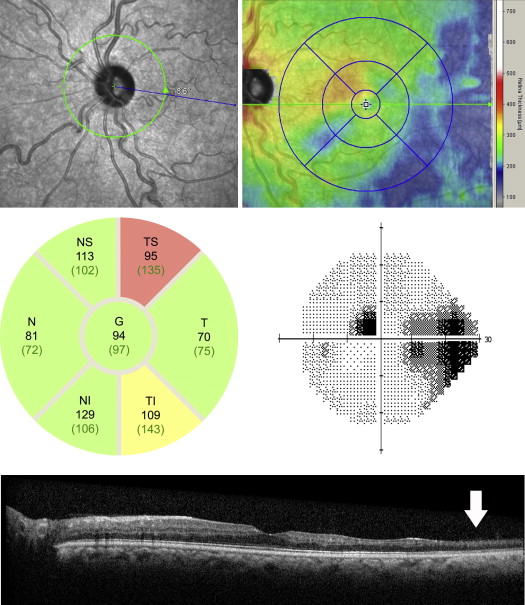
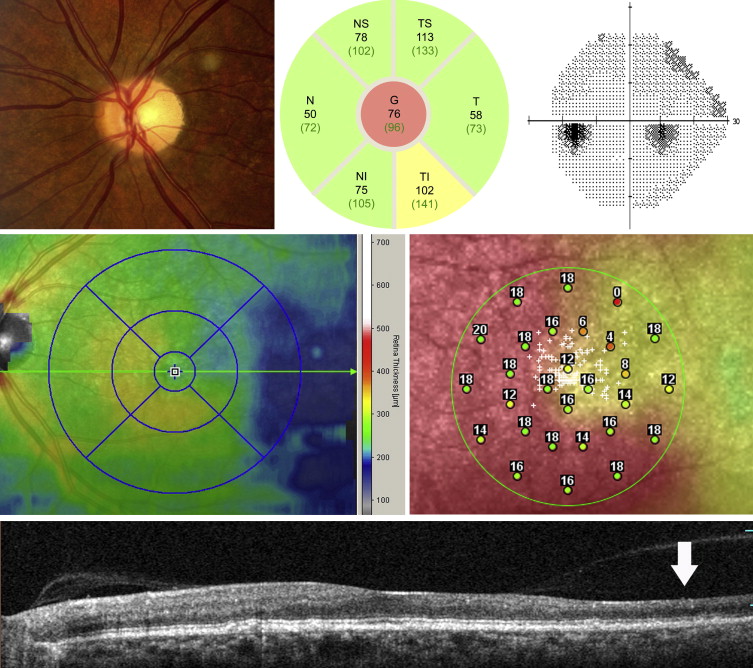
For the optic nerve head scans, a scan circle with a diameter of 3.45 mm was positioned manually at the center of the optic disc. Three images at the same location were obtained and averaged. Segmentation of the peripapillary RNFL was checked and adjusted manually if necessary to ensure accuracy. The measurements used for analysis included global (central) as well as 6 regional subfields (nasal, inferonasal, inferotemporal, temporal, supertemporal, and supranasal), as shown in the native analysis report ( Figures 2 and 3 ). The number of values that the SD OCT instrument determined as abnormal (which was based on a population of European descent; yellow, < ninety-fifth percentile; red, < ninety-ninth percentile) also was recorded. Poor-quality scans (quality score < 11 or those in which the images prevented accurate segmentation of the peripapillary RNFL) were excluded.
Vessel Tortuosity and Vessel Diameter Measurements
The effect of vessel tortuosity was analyzed as a potential confounder. Vessel tortuosity was graded by 2 masked retinal specialists (J.I.L. and F.Y.C.). To avoid confounding effects of macular thinning, we analyzed only the patients with and without tortuosity in the no macular thinning group. The vessel diameters at the disc margin also were measured as follows. From the optic nerve images in the SD OCT instrument, the superior and inferior arcade arteries and veins were measured using native software (Heidelberg Engineering, Inc) near the disc margin.
Data Analysis
Peripapillary RNFL thickness measurements within each of the 7 subfields of the optic nerve head as displayed on the SD OCT report were recorded for patients with macular thinning, patients without macular thinning, and controls. Analysis of variance testing and post hoc analysis with the Tukey test were performed to assess for differences in patient demographics, including age, visual acuity, intraocular pressure at presentation, refractive error, cup-to-disc ratio, ETDRS temporal macular thickness, and far temporal macular thickness, as well as peripapillary RNFL thickness in each subfield among the 3 groups. For data analysis purposes, Snellen chart best-corrected visual acuity was converted to logarithm of the minimal angle of resolution visual acuity. An independent 2-tailed t test of means was performed to assess for peripapillary RNFL thickness differences between those with and without vessel tortuosity in the no macular thinning group. In the macular thinning group, a Pearson correlation coefficient was determined between far temporal macular thickness and each of the 7 peripapillary RNFL subfields. A P value of less than .05 was considered statistically significant.
Results
One hundred fifty-one eyes of 88 sickle-cell patients and 55 eyes of 30 age-similar and race-matched controls were included. Table 1 summarizes the demographics and baseline characteristics of the 3 groups (macular thinning, no macular thinning, and control eyes). There were no statistically significant differences in age, refractive error, or cup-to-disc ratio among the 3 groups. There were statistically significant differences in mean logarithm of the minimal angle of resolution best-corrected visual acuity, although clinically all 3 groups had visual acuity of less than 0.1 (better than 20/25). Sickle-cell patients with macular thinning had significantly lower intraocular pressure, thinner ETDRS perifoveal temporal macular thickness, and thinner far temporal macular thickness than those without macular thinning or controls.
| Control (n = 57) | No Thinning (n = 70) | Thinning (n = 81) | P Value a | |||
|---|---|---|---|---|---|---|
| Control vs No Thinning | Control vs Thinning | No Thinning vs Thinning | ||||
| Mean age (range), years | 38 (18 to 65) | 34.5 (18 to 67) | 33.7 (19 to 59) | 0.19 | 0.08 | 0.92 |
| Mean cup-to-disc ratio | 0.35 | 0.32 | 0.34 | 0.3 | 0.83 | 0.06 |
| Mean best-corrected visual acuity, logMAR | 0.01 | 0.05 | 0.06 | 0.05 | 0.01 | 0.83 |
| Mean intraocular pressure (range), mm Hg | 16.2 (9 to 23) | 16.1 (9 to 22) | 14.7 (10 to 23) | 0.95 | 0.02 | 0.02 |
| Mean spherical equivalent, diopters | −0.82 | −0.62 | −1.22 | 0.87 | 0.59 | 0.24 |
| Mean ETDRS temporal thickness, μm | 283.1 | 276.1 | 259.7 | 0.16 | <0.0001 | <0.0001 |
| Mean far temporal thickness, μm | 243.3 | 238.9 | 216.1 | 0.22 | <0.0001 | <0.0001 |
a Analysis of variance testing and post hoc analysis with the Tukey test.
Table 2 summarizes the peripapillary RNFL thickness differences among the 3 groups. Those with macular thinning had significantly thinner peripapillary RNFLs in the nasal sector compared with controls ( P = .01) and in the superotemporal sector compared with those without macular thinning ( P = .01). Further comparison of the macular thinning and control groups demonstrated marginal differences in the superotemporal and inferotemporal sectors as well as global peripapillary RNFL, but these did not reach statistical significance ( P = .07, P = .09, and P = .08, respectively).
| Mean Peripapillary Retinal Nerve Fiber Layer Thicknesses by Sector (μm) | |||||||
|---|---|---|---|---|---|---|---|
| Nasal | Inferonasal | Inferotemporal | Temporal | Superotemporal | Superonasal | Global | |
| Controls (n = 55) | 80.5 | 128.3 | 151.6 | 71.9 | 133.7 | 117.5 | 104.6 |
| No macular thinning (n = 70) | 73.2 | 123.2 | 150.7 | 75.3 | 135.9 | 115.3 | 102.8 |
| Macular thinning (n = 81) | 72.7 | 126.0 | 142.1 | 70.4 | 125.5 | 114.4 | 99.4 |
| P values a | |||||||
| Control vs no thinning | 0.03 | 0.58 | 0.98 | 0.16 | 0.84 | 0.91 | 0.74 |
| Control vs thinning | 0.01 | 0.88 | 0.07 | 0.96 | 0.09 | 0.81 | 0.08 |
| No thinning vs thinning | 0.75 | 0.82 | 0.08 | 0.12 | 0.01 | 0.98 | 0.30 |
a Analysis of variance testing and post hoc analysis with the Tukey test.
A subgroup analysis based on far temporal macular thickness as described earlier was performed. Table 3 shows the peripapillary RNFL thicknesses of those with mild, moderate, and severe macular thinning as well as Pearson correlation coefficient in each sector. The peripapillary RNFL was significantly thinner in the severe group (n = 55) in 6 of 7 subfields compared with controls.


