Purpose
To evaluate visual and optical quality of the implantable collamer lens for different powers and sizes of incision surgery.
Design
Prospective study in humans.
Methods
An adaptive optics visual simulator was used to measure 3 powers of implantable collamer lenses and simulate the implantable collamer lens wavefront aberration’s pattern for small- and large-incision surgery. Visual acuity (VA) and contrast sensitivity were measured in 11 observers for 3- and 5-mm pupils. Modulation transfer function, point spread function, and Strehl ratio were calculated.
Results
At 3 mm pupil, no statistically significant differences were found between both incision sizes for any implantable collamer lens power, except for −15 diopter (D) implantable collamer lens at 25 cycles/degree (cpd) ( P < .05). At 5 mm pupil, statistically significant differences in Strehl ratio, VA, and contrast sensitivity were found between both incision sizes for all implantable collamer lens powers ( P < .05). The outcomes were better with small incision. Implantable collamer lens power also affected the optical and visual quality. At 3 mm pupil, no statistically significant differences were found in VA and contrast sensitivity between implantable collamer lens powers, except between −3 and −15 D at low-contrast VA and at 20 and 25 cpd ( P < .05). At 5 mm pupil, no statistically significant differences were found in Strehl ratio, VA, and contrast sensitivity between −3 and −6 D implantable collamer lens, but they did become apparent for −15 D implantable collamer lens for both incision sizes, all contrasts and spatial frequencies ( P < .05).
Conclusions
The implantable collamer lens provides good optical and visual quality, although these outcomes decreased with large-incision surgery because of the increase of aberrations.
There is an increasing number of patients who wish to correct their refractive error by means of refractive surgery. Even though nowadays the most popular option is still laser in situ keratomileusis (LASIK), there are other options available, such as the implantation of phakic intraocular lenses, which is a good alternative when high levels of myopia or hyperopia are to be corrected, since patients with high refractive errors or thin corneas may not be good candidates for LASIK because of the risk for corneal ectasia.
The Visian implantable collamer lens (ICL; STAAR Surgical, Nidau, Switzerland) is a posterior chamber phakic intraocular lens approved by the United States Food and Drug Administration (FDA) for the treatment of moderate to severe myopia. Research studies have shown that the ICL is effective for the correction of myopia, hyperopia, and astigmatism. Moreover, other comparative studies concluded that this surgical procedure outperforms LASIK in all measures of safety, efficacy, predictability, and stability, even in eyes with low levels of myopia. These results are probably attributable to the fact that, since ICL treatment does not include any surgical tissue ablation, it induces significantly lower amounts of ocular high-order aberrations (HOAs) than LASIK does. HOAs could increase after ICL implantation due to the intrinsic properties of the lens (ie, spherical aberration increases with ICL power) and also depending on the particular type of incision made during the surgical procedure.
The aim of the present study was to evaluate the optical and visual quality provided by ICL of various powers, and the effect of small- and large-incision surgery. For this purpose we used an adaptive-optics system to simulate vision from the ICL’s aberration pattern itself. Visual acuity (VA) for different contrasts, as well as contrast sensitivity, were evaluated for 3 mm and 5 mm pupils.
Patients and Methods
This prospective study was approved by the Institutional Review Board at the University of Valencia–Research Group of Optometry and followed the tenets of the Declaration of Helsinki. Informed consent was obtained from each participant after verbal and written explanation of the nature and possible consequences of the study. The patients gave informed consent to participate in this research.
This study included 11 eyes of 11 individuals, aged 18 to 29, all having experience in psychophysical experiments. Spherical refractive errors ranged between −2.50 and +1.50 diopters (D) with astigmatism <0.75 D. They had all clear intraocular media and no known ocular pathology. Wavefront aberrations were measured with natural pupil. The pupil diameter was almost always larger than 5 mm, as the room’s light was off during the experiments.
The Visian ICL is a plate-haptic single-piece lens designed to be implanted in the posterior chamber with support on the ciliary sulcus. It is made partly from collamer, a flexible, hydrophilic, and biocompatible material. The optic is 6 mm in diameter and the overall size comes in 5 diameters (11.0, 11.5, 12.0, 12.5, and 13.0 mm). The lens has a central convex–concave optic zone whose diameter ranges from 4.5 to 5.5 mm, depending on the lens’ dioptric power. The ICL design has evolved over time; in this particular study we analyzed the V4 model.
Adaptive-Optics Visual Simulator
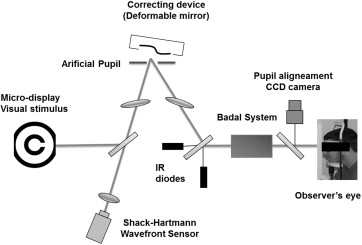
We used the crx adaptive-optics system (Imagine Eyes, Orsay, France), which comprises 2 basic elements: a wavefront sensor and a correcting device. The system optically conjugates the exit pupil plane of the individual with the correcting device, the wavefront sensor, and an artificial pupil. The Shack-Hartmann wavefront sensor has a square array of 1024 lenslets. The wavefront aberration measurements are made at a wavelength of 850 nm. The deformable mirror is a correcting system made up of 52 independent magnetic actuators used to either partially or totally correct the aberrations up to the fifth order (18 Zernike coefficients) and to add different values of aberrations (up to the fourth order). The deformable mirror’s surface is controlled with a commercially available computer program (HASO; Imagine Eyes), which reshapes the deformable mirror from its normally flat surface to the desired shape. The observer viewed visual tests generated on a micro-display through the adaptive-optics system and an artificial pupil ( Figure 1 ). The micro-display subtended a visual angle of 114 × 86 arcmin with a resolution of 800 × 600 pixels (pixel size = 0.143 arcmin). The experiments’ luminance conditions were manually adjustable.
Experimental Procedure
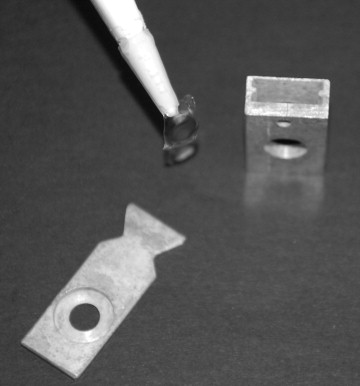
The irx3 Shack-Hartmann wavefront aberrometer (Imagine Eyes), together with a custom-made wet cell, was used to obtain the in vitro wavefront aberration pattern of the type of phakic intraocular lens assessed in this work, the Visian ICL (ICL + wet cell). The aberrations of the wet cell alone were also measured and subtracted from the aberrations of the joint system ICL + wet cell. Three different ICLs were assessed, having a power of −3, −6, and −15 D, respectively ( Figure 2 ). Each measurement was repeated 10 times for each lens and the results were computed for both a 3 mm and a 5 mm pupil diameter.
Once we had obtained each ICL’s aberration pattern, the crx1 was programmed to measure and compensate for that particular eye’s wavefront error up to the fifth order. In order to simulate in each individual the vision achieved after ICL implantation, the ICL’s wavefront pattern was induced, adding also the wavefront pattern of the myopic eye and the HOAs caused by the incision. The natural pupil diameter was monitored for each individual (≥5 mm), and the pupil size was controlled using the simulator’s artificial pupil. The HOAs resulting from a small or a large surgical incision were obtained from the study carried out by Kim and associates. They analyzed the eye’s HOAs both before and after surgery, when either a small (<3.2 mm) or a large corneal incision (3.2-4.5 mm) was made. Note that values were adjusted to 3 mm and 5 mm pupil sizes following the formula developed by Schwiegerling for the optical and visual simulation analysis.
Optical Quality Evaluation
To evaluate the optical quality of the whole eye (phakic intraocular lens + eye) the modulation transfer function, point spread function, and Strehl ratio were computed from the wavefront data obtained by the irx3 Shack-Hartmann sensor. For the purpose of the present study, the mean 1-dimensional modulation transfer function was calculated as the average over all orientations of the 2-dimensional modulation transfer function. All the calculations were performed using a custom-made MATLAB program (Mathworks, Inc, Natick, Massachusetts, USA).
Visual Quality Measurement
High- (100%), medium- (50%), and low-contrast (10%) VA was measured using the Freiburg Visual Acuity Test software (Michael Bach, Germany) with a white background and luminance of 51 cd/m 2 . The acuity threshold was determined by the best-parameter estimation by sequential testing procedure based on 30 presentations. It was an 8-alternative, forced-choice method. The individual’s task was to identify the Landolt-C gap position using a keypad. The VA value that was retained was the average of 3 measurements.
The contrast sensitivity was measured for 3 spatial frequencies: 10, 20, and 25 cycles/degree (cpd). Oriented sinusoidal gratings (0, 45, 90, and 135 degrees) were randomly generated and displayed on the micro-display using a 4-alternative, forced-choice method. A modified best-parameter estimation by sequential testing method based on 30 presentations was used to determine contrast thresholds.
Data Analysis
The analysis of variance (ANOVA) was used to reveal differences between ICL powers. Post hoc multiple comparison testing was performed using the Holm-Sidak method. A Student t test for unpaired data was used for the comparison of different incision sizes. Differences were considered to be statistically significant if the P value was below .05.
Results
Optical Quality of the Whole Eye
Figure 3 shows the normalized 5 mm pupil modulation transfer function for the 3 ICL powers under analysis and for the small and large incision size. The diffraction-limited modulation transfer function has been included for comparison purposes. Similar curves were obtained for the −3 D and the −6 D ICL for both incision sizes, whereas modulation transfer function values were considerably lower for the −15 D lens. In all cases the modulation transfer function was worse (ie, it differed more from the diffraction-limited modulation transfer function) for a large than for a small incision. The figure also shows the retinal contrast threshold curve at a retinal illuminance of 500 td.
Figure 4 shows the 5 mm pupil point spread function computed for the 3 powers of ICL and for small and large incision sizes. The point spread function was worse for higher ICL powers and larger surgical incision sizes.
Regarding 5 mm pupil Strehl ratio values, they were significantly better for a small incision size than for a large incision size, for all powers evaluated: 0.77 ± 0.05 vs 0.25 ± 0.08 ( P = .03), 0.77 ± 0.06 vs 0.25 ± 0.06 ( P = .03), and 0.39 ± 0.06 vs 0.12 ± 0.07 ( P = .01) for −3 D, −6 D, and −15 D ICLs, respectively. Strehl ratio values for −3 D and −6 D ICLs are extremely similar, for both incision sizes (0.77 for a large and 0.25 for a small incision size). However, for the −15 D ICL Strehl ratio values decreased in a significant manner for both incision sizes: from 0.77 to 0.39 ( P = .006) for small-incision surgery and from 0.25 to 0.12 ( P = .009) for large-incision surgery. The best optical quality was achieved in the case of a small-incision surgery and for −3 D and −6 D ICLs.
Visual Quality
Figures 5 and 6 show 3 mm and 5 mm pupil (respectively) VA results for the 3 ICL powers and for small and large incision sizes. No statistically significant differences were found in VA between the 2 incision sizes for a 3 mm pupil, for all ICL powers and contrast values ( Figure 5 , P > .05). On the contrary, for a 5 mm pupil, statistically significant differences were found in logMAR VA between small and large incision sizes for all ICL powers and contrast values evaluated ( Figure 6 , P < .05). In all cases the VA was better for a small-incision than for a large-incision surgery. Regarding the effect of the ICL power upon visual outcome, we did not find statistically significant differences between ICLs for a 3 mm pupil ( P > .05). However, at low contrast we found statistically significant differences in logMAR VA between −3 D and −15 D ICLs for both incision sizes ( P < .05). For a 5 mm pupil no significant differences were observed between −3 D and −6 D ICLs, but those values did differ significantly from those obtained for the −15 D ICL for both incision sizes and contrasts evaluated ( P < .05). In all cases the VA obtained with the −15 D ICL was worse.
Figures 7 and 8 show the mean log10 contrast sensitivity values for 3 mm and 5 mm pupils, respectively. For a 3 mm pupil no statistically significant differences were found between small and large incision sizes for all spatial frequencies and ICL powers ( P > .05), except for the case of 25 cpd with the −15 D ICL, where better outcomes are attained with a small incision ( P = .016). For a 5 mm pupil statistically significant differences were found for all scenarios (incision sizes, ICL power, and all spatial frequencies, P < .05); in all cases better outcomes were obtained for the small-incision surgery. Figure 9 was devised to properly compare the effect of ICL power upon contrast sensitivity. This figure shows contrast sensitivity for all ICL powers and both incision sizes, for 3 mm and 5 mm pupils. For a 3 mm pupil, statistically significant differences were found only between −3 D and −15 D ICLs for both incision sizes at 20 and 25 cpd ( P < .05). On the other hand, for a 5 mm pupil no statistically significant differences were found between −3 D and −6 D ( P > .05), but they did become apparent for the −15 D ICL for both incision sizes and all spatial frequencies evaluated ( P < .05). In all cases, contrast sensitivity was worse with the −15 D ICL.


