Purpose
To investigate whether peripapillary choroidal thickness in perimetrically affected eyes of primary open-angle glaucoma (POAG) patients differs from that in perimetrically unaffected fellow eyes and eyes of healthy controls.
Design
Retrospective, comparative, cross-sectional study.
Methods
Thirty-one POAG patients with unilateral visual field loss and 31 healthy controls were included. Eyes were divided into 3 groups: 31 eyes in group A (eyes with visual field loss), 31 eyes in group B (perimetrically unaffected fellow eyes), and 31 eyes in group C (age- and sex-matched controls). A 360-degree 3.4-mm diameter peripapillary circle scan was performed for retinal nerve fiber layer (RNFL) assessment using enhanced depth imaging optical coherence tomography. The observer used the manual segmentation function to delineate the posterior edge of the retinal pigment epithelium and the sclerochoroidal interface. The RNFL thickness algorithm function was used to generate the choroidal thickness automatically in corresponding sectors. Statistical analysis was conducted to compare mean choroidal thickness and RNFL thickness among 3 groups and to correlate choroidal thickness with age, RNFL thickness, and visual field mean deviation.
Results
The global mean RNFL and choroidal thickness measurements were 62.3 ± 16.7 μm and 154.3 ± 69.7 μm in group A, 90.4 ± 12.2 μm and 154.7 ± 68.9 μm in group B, and 106.6 ± 9.2 μm and 154.2 ± 60.9 μm in group C. The RNFL thickness was significantly thinner in group A than in groups B and C globally and at all peripapillary locations (all P = .000). The RNFL thickness also was significantly thinner in group B than in group C ( P = .000 to .021). However, choroidal thickness measurements did not differ among 3 groups globally or at any peripapillary location ( P = .273 to .934, P = .757 to .994, and P = .808 to .975, respectively). Age was the only significant factor associated with peripapillary choroidal thickness in each group ( r = −0.418 to −0.641, r = −0.569 to −0.690, and r = −0.689 to −0.827, respectively; all P < .05).
Conclusions
There was no significant difference in peripapillary choroidal thickness of POAG eyes with visual field loss compared with that of perimetrically unaffected fellow eyes and eyes of healthy controls, which does not support using peripapillary choroidal thickness as a clinical parameter in POAG diagnosis or management.
Two principal theories have been described for the pathogenesis of glaucomatous optic neuropathy (GON): the mechanical and the vascular theory. The latter considers GON as a consequence of insufficient blood supply to the prelaminar optic nerve either because of increased intraocular pressure (IOP) or other risk factors. Because the centripetal branches of the peripapillary choroidal arterioles contribute to the blood supply of the optic nerve head, the peripapillary choroid may play an important role in the cause of glaucoma.
Primary open-angle glaucoma (POAG) is essentially a bilateral disease, but it is often asymmetric at presentation. The percentage of normal-tension glaucoma and high-tension glaucoma patients with unilateral visual field (VF) loss has been estimated to be approximately 25% and 31%, respectively. In addition to asymmetric aqueous humor dynamics, several studies have reported that asymmetric POAG was associated with asymmetric ocular hemodynamics. Some investigators have suggested that evaluation of peripapillary choroidal thickness as a marker of choroidal blood flow also may be a useful tool in the detection of glaucoma or in diagnosing a few subsets of glaucoma. However, 2 other studies recently showed that there are no differences between peripapillary choroidal thickness in glaucoma patients and glaucoma suspects. Thus, demonstrating the lack or presence of asymmetry in peripapillary choroidal thickness in POAG patients with asymmetric VF would corroborate further or would refute the above-mentioned findings. In this study, the peripapillary choroid was imaged in POAG patients with unilateral VF loss using a recently developed method called enhanced depth imaging (EDI) spectral-domain optical coherence tomography (OCT), and the peripapillary choroidal thickness was measured and compared with that in perimetrically unaffected fellow eyes and in the eyes of age- and gender-matched healthy controls.
Methods
Subjects
This was a retrospective, comparative cross-sectional study. The study was approved by the Institutional Review Board at Peking Union Medical College Hospital and adhered to the tenets of the Declaration of Helsinki. We reviewed data from 31 POAG patients with unilateral VF loss who were referred to the Department of Ophthalmology, Peking Union Medical College Hospital, between June 2012 and December 2012. POAG was diagnosed in the presence of open iridocorneal angles accompanied by glaucomatous optic disc changes (with notching or thinning of the neuroretinal rim) and a corresponding nerve fiber bundle VF defect in at least 1 eye, accompanied by elevated IOP without secondary causes. All VF tests were performed with the Octopus 101 G2 program (Interzeag, Schlieren, Switzerland). At least 2 reliable, consecutive VF test results were required, with the most recent test performed within 3 months of enrollment. The reliability criteria that were applied were as follows: false-positive and false-negative response rates were 20% or less or a reliability factor of less than 15%. A VF defect was defined as one in which at least 3 adjacent points had at least a 5-dB loss, or at least 1 point had at least a 10-dB loss, or a difference of at least 10 dB across the nasal horizontal meridian in 2 adjacent points in a compared numerical map. Any detected VF defect had to be confirmed in at least 1 other attempt to be classified as abnormal. A normal VF was taken to be one in which there were no sensitivity losses matching the criteria for glaucoma. All POAG patients were receiving IOP-lowering therapy at the time of EDI OCT. None had any significant history of ocular disease other than glaucoma, ocular trauma, or intraocular surgery. Both eyes were enrolled for the study. In Octopus perimetry, a pathologic mean deviation (MD) is a positive value, and subjects were classified further as having mild (MD <4.5 dB), moderate (MD 4.5 to 9.5), or severe (MD >9.5) glaucoma. For each POAG patient, an age- and sex-matched healthy subject who visited the clinic during the same recruitment period was enrolled and served as a control. All of them had healthy-looking optic discs, IOP of 21 mm Hg or less in both eyes, no previous history of intraocular disease or surgery, and no family history of glaucoma. One eye was selected randomly if both were eligible. Healthy subjects did not undergo VF testing. Exclusion criteria for both POAG and healthy subjects were age younger than 18 years, refractive error of more than −6 diopters (D) of sphere or 3 D of cylinder, severe cataract (visual acuity <20/40), a history of systemic hypertension, diabetes mellitus, or any other systemic disease and systemic medications known to affect choroidal thickness, the optic nerve, the VF, or a combination thereof. All eyes were divided into 3 groups: 31 eyes in group A (POAG eyes with VF loss), 31 eyes in group B (perimetrically unaffected fellow eyes), and 31 eyes in group C (age- and sex-matched controls).
Image Acquisition and Choroidal Thickness Measurement
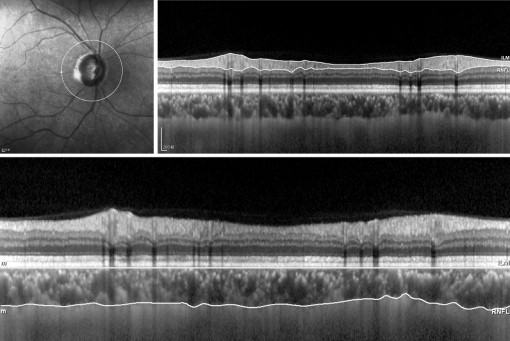
The same operator (Q.Z.) performed imaging on all subjects in the morning with Spectralis OCT (software version 1.6.4.0; Heidelberg Engineering, Heidelberg, Germany) using EDI techniques as described originally by Spaide and associates. A 360-degree 3.4-mm diameter peripapillary circle scan centered on the optic disc was performed for retinal nerve fiber layer (RNFL) assessment ( Figure 1 , Top). The automatic real-time (100 frames) averaging mode was applied to ensure good-quality images. Using the manual segmentation function, 2 readers (L.L., A.B.) who were masked to the clinical patient data delineated the posterior edge of the retinal pigment epithelium and the sclerochoroidal interface to represent the inner and outer boundaries of the choroid, respectively ( Figure 1 , Bottom). The RNFL thickness algorithm function then was used to generate the choroidal thickness automatically in corresponding sectors. To determine the reliability of choroidal thickness measurements, the first reader repeated this procedure twice in a masked way at a 1-month interval, and the second reader obtained 1 measurement independently on a different day.
Statistical Analysis
All statistical analyses were performed using SPSS software version 15.0 (SPSS, Inc, Chicago, Illinois, USA). The intraobserver and interobserver reproducibility were evaluated by intraclass correlation coefficient. The values of choroidal thickness and RNFL thickness detected in glaucomatous eyes with VF loss and perimetrically unaffected fellow eyes were compared by a paired t test. An independent t test was used to compare choroidal thickness and RNFL thickness between POAG patients and healthy subjects. A Pearson correlation was calculated for variation in choroidal thickness relative to age and RNFL. Spearman rank correlation was calculated to test the strength of the relationship between global mean choroidal thickness and VF MD. A P value of less than .05 was considered to be statistically significant.
Results
Demographic and Clinical Characteristics of Subjects
The mean age of the POAG patients and the healthy subjects was 57.2 ± 14.7 years (range, 27 to 80 years) and 57.9 ± 14.6 years (range, 27 to 78 years), respectively. In each group, 17 (54.8%) of the 31 subjects were male. Mean spherical equivalent was −1.17 ± 1.85 D in group A, −0.99 ± 1.79 D in group B, and −0.43 ± 1.15 D in group C. The IOP at imaging was 16.4 ± 3.0 mm Hg in group A, 16.6 ± 2.4 mm Hg in group B, and 15.8 ± 2.3 mm Hg in group C. The horizontal and vertical diameters of the optic disc were 1558.1 ± 205.4 μm and 1678.9 ± 170.7 μm in group A, 1554.4 ± 168.6 μm and 1654.4 ± 199.4 μm in group B, and 1571.5 ± 96.6 μm and 1690.9 ± 102.9 μm in group C. No statistical differences in age, sex, refractive error, IOP, or horizontal or vertical disc diameter were noted among the 3 groups (all P > .05). Among 31 eyes with VF loss, 9 (29.0%) were mildly affected (MD <4.5 dB), 13 (41.9%) were moderately affected (MD 4.5 to 9.5 dB), and 9 (29.0%) were severely affected (MD >9.5 dB). The VF MD was significantly greater in group A (9.20 ± 7.65 dB) than in group B (−0.37 ± 0.99 dB; P < .05). The study population characteristics are summarized in Table 1 .
| Parameter | Group A | Group B | Group C | P Value A–B a | P Value A–C b | P Value B–C b |
|---|---|---|---|---|---|---|
| No. of eyes | 31 | 31 | 31 | |||
| Age (y) | 57.2 ± 14.7 | 57.2 ± 14.7 | 57.9 ± 14.6 | — | .843 | .843 |
| Sex (male/female) | 17/14 | 17/14 | 17/14 | — | 1.000 c | 1.000 c |
| Spherical equivalent refractive error (diopters) | −1.17 ± 1.85 | −0.99 ± 1.79 | −0.43 ± 1.15 | .147 | .070 | .154 |
| IOP (mm Hg) | 16.4 ± 3.0 | 16.6 ± 2.4 | 15.8 ± 2.3 | .764 | .469 | .301 |
| Disc diameter horizontal (μm) | 1558.1 ± 205.4 | 1554.4 ± 168.6 | 1571.5 ± 96.6 | .811 | .751 | .637 |
| Vertical (μm) | 1678.9 ± 170.7 | 1654.4 ± 199.4 | 1690.9 ± 102.9 | .234 | .748 | .384 |
| MD (dB) | 9.20 ± 7.65 | −0.37 ± 0.99 | — | .000 d | — | — |
Interindividual and Intraindividual Choroidal Thickness Comparison
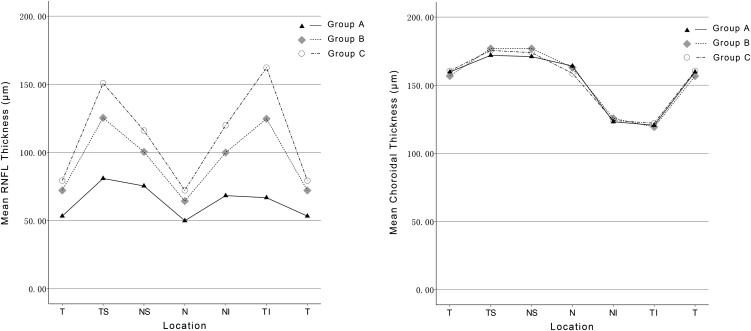
The sclerochoroidal junction was visualized in all eyes, and no image was excluded because of an inability to delineate the posterior border of the choroid. The intraobserver and interobserver intraclass correlation coefficients ranged from 0.993 to 0.999 and 0.993 to 0.998, respectively ( Table 2 ), showing good agreement for choroidal thickness measurements within and between observers. There was 90% power to detect a global choroidal thickness difference of 15 μm between POAG eyes with VF loss and perimetrically unaffected fellow eyes at a significance of 5%, for a standard deviation of 26 μm. The global mean RNFL and choroidal thickness measurements were 62.3 ± 16.7 μm and 154.3 ± 69.7 μm in group A, 90.4 ± 12.2 μm and 154.7 ± 68.9 μm in group B, and 106.6 ± 9.2 μm and 154.2 ± 60.9 μm in group C. The RNFL thickness was significantly thinner in group A than in groups B and C globally and at all peripapillary locations (all P = .000). The RNFL thickness also was significantly thinner in group B than in group C ( P = .000 to 0.021; Table 3 ; Figure 2 , Left). But choroidal thickness measurements did not differ among 3 groups globally or at any peripapillary location ( P = .273 to .934, P = .757 to .994, and P = .808 to .975, respectively; Table 3 ; Figure 2 , Right).
| Location | Intraobserver ICC | 95% CI | Interobserver ICC | 95% CI |
|---|---|---|---|---|
| Temporal | 0.999 | 0.997 to 1.000 | 0.998 | 0.995 to 0.999 |
| Superotemporal | 0.993 | 0.982 to 0.997 | 0.994 | 0.985 to 0.998 |
| Superonasal | 0.997 | 0.992 to 0.999 | 0.994 | 0.985 to 0.998 |
| Nasal | 0.997 | 0.993 to 0.999 | 0.995 | 0.987 to 0.998 |
| Inferonasal | 0.995 | 0.989 to 0.998 | 0.994 | 0.985 to 0.998 |
| Inferotemporal | 0.996 | 0.989 to 0.998 | 0.993 | 0.983 to 0.997 |
| Global | 0.999 | 0.997 to 1.000 | 0.998 | 0.995 to 0.999 |
| Location | Thickness | Group A | Group B | Group C | t Test A–B a | P Value A–B a | t Test A–C b | P Value A–C b | t Test B–C b | P Value B–C b |
|---|---|---|---|---|---|---|---|---|---|---|
| Temporal | RNFL | 53.3 ± 18.8 | 72.1 ± 12.7 | 79.3 ± 11.3 | 6.400 | .000 | 6.605 | .000 | 2.368 | .021 |
| Choroidal | 159.7 ± 82.3 | 156.7 ± 81.0 | 160.5 ± 67.9 | −0.382 | .705 | 0.045 | .964 | 0.204 | .839 | |
| Superotemporal | RNFL | 80.9 ± 37.6 | 125.4 ± 25.3 | 150.8 ± 20.5 | 6.927 | .000 | 9.085 | .000 | 4.344 | .000 |
| Choroidal | 171.9 ± 79.3 | 176.9 ± 82.3 | 175.5 ± 61.7 | 0.747 | .461 | 0.202 | .841 | −0.072 | .943 | |
| Superonasal | RNFL | 75.4 ± 28.3 | 100.4 ± 23.0 | 116.1 ± 17.4 | 4.748 | .000 | 6.824 | .000 | 3.025 | .004 |
| Choroidal | 171.0 ± 76.4 | 176.9 ± 80.3 | 173.9 ± 62.5 | 1.116 | .273 | 0.162 | .872 | −0.162 | .872 | |
| Nasal | RNFL | 49.9 ± 15.4 | 64.3 ± 12.8 | 72.2 ± 12.4 | 4.893 | .000 | 6.261 | .000 | 2.463 | .017 |
| Choroidal | 164.1 ± 72.7 | 162.9 ± 69.4 | 158.7 ± 64.5 | −0.267 | .791 | −0.310 | .757 | −0.245 | .808 | |
| Inferonasal | RNFL | 68.3 ± 24.5 | 99.9 ± 22.3 | 119.9 ± 14.7 | 6.006 | .000 | 10.052 | .000 | 4.164 | .000 |
| Choroidal | 123.2 ± 57.1 | 125.7 ± 58.2 | 124.1 ± 57.7 | 0.470 | .642 | 0.064 | .949 | −0.107 | .915 | |
| Inferotemporal | RNFL | 66.8 ± 41.6 | 124.7 ± 34.0 | 162.2 ± 16.9 | 8.676 | .000 | 11.812 | .000 | 5.488 | .000 |
| Choroidal | 120.6 ± 62.0 | 119.3 ± 56.2 | 122.1 ± 59.7 | −0.209 | .836 | 0.100 | .921 | 0.193 | .848 | |
| Global | RNFL | 62.3 ± 16.7 | 90.4 ± 12.2 | 106.6 ± 9.2 | 8.859 | .000 | 12.930 | .000 | 5.908 | .000 |
| Choroidal | 154.3 ± 69.7 | 154.7 ± 68.9 | 154.2 ± 60.9 | 0.083 | .934 | −0.008 | .994 | −0.031 | .975 |
Stay updated, free articles. Join our Telegram channel

Full access? Get Clinical Tree


