Purpose
To explore the relationship between the visual field index (VFI) and the visual field mean deviation (MD) in glaucoma patients with moderately advanced perimetric damage and to identify the magnitude of the boundary effect of VFI that occurred when the VFI estimation strategy changed from pattern deviation probability value to total deviation probability value as the MD crossed −20 dB in longitudinal visual field (VF) series.
Design
A retrospective cohort study of longitudinal data analysis.
Methods
The MD and VFI values obtained from VF tests conducted on 148 eyes of 148 glaucoma patients having an MD around −20 dB were studied. A total of 1286 VFs with MD values within the range of −16 dB to −24 dB were included. The eyes were divided into 2 groups, with the first having serial MDs all better than or all worse than −20 dB and the second with serial MDs crossing the −20 dB value. Change in MD (ΔMD) was defined as the absolute difference between the MD values of 2 consecutive VFs. Based on the 2 VFI values of the same VFs, the absolute value of change in VFI (ΔVFI) was calculated.
Results
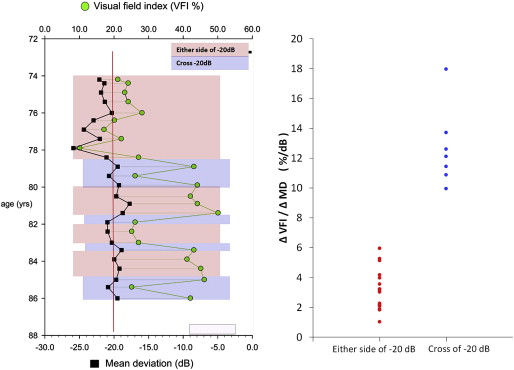
The means (± standard deviation) for the ΔVFI were 4.17% (± 3.3%) in the group of eyes with MDs on either side of −20 dB, and were 15.8% (± 8.4%) in the group with MDs crossing −20 dB ( P < .0001). For ΔVFI/ΔMD, these values were 6.8%/dB (± 10.5%) when the range of MD falls on either side of −20 dB, and 7.9%/dB (± 6.2%) when the range of MD crosses the −20 dB values ( P = .042).
Conclusions
The values of the VFI become highly variable in serial VFs of eyes with MDs crossing −20 dB, in comparison to those VFIs associated with MDs on either side of −20 dB. The likelihood for this effect is the change from use of pattern deviation probability value to total deviation probability value in the points included in the calculation of VFI at −20 dB of MD. The development of indices to measure VF rates that are free from this boundary effect in moderately advanced glaucoma is desirable.
Current interest in the care of glaucoma patients is to detect early glaucoma damage and to estimate rate of decay of glaucoma progression. Statistical analyses of the trend of a single summary index of the visual field (VF) provide a simple and intuitive approach with which to judge the course of glaucoma patients and treatment effects. Knowing the rate of disease progression is fundamental to our long-term goal of preservation of vision in patients with glaucoma. Change in visual field mean deviation (MD) is often used to measure the rate of glaucomatous deterioration. However, MD is affected not only by glaucoma but also by cataract and other nonglaucomatous causes. To complement this measure, Bengtsson and Heijl introduced a method of using linear regression of the visual field index (VFI) to estimate the rate of progression. VFI is incorporated into the Statpac software of the Humphrey Field Analyzer (HFA; Carl Zeiss Meditec, Dublin, California, USA). The selection of points to be included in the VFI is largely based on the pattern deviation probability value of the visual field. This analysis was designed originally to reduce the effects of diffuse depression caused by cataract. In addition, estimates of the cortical representation of test locations were used to adjust VFI to be more heavily weighted to central areas of the visual field. VFI is calculated as a percentage from 100% to 0% and covers the entire measurable range of perimetric values from normal visual field to absolute perimetric loss. However, the reliance of VFI on the pattern deviation probability value causes a ceiling effect that may reduce its sensitivity to change in eyes with early damage. In addition, VFI is calculated from the pattern deviation probability value in eyes with MD better than −20 dB and from the total deviation probability values in eyes with MD worse than −20 dB. Therefore, VFI may also demonstrate a boundary effect at MD values around the −20 dB threshold with large fluctuations in its value, a pattern not seen, for instance, with MD values on either side of −20 dB.
The purpose of this study is to explore the relationship between VFI and MD, determined by analyzing the change in VFI (ΔVFI) with change in MD (ΔMD) in patients with moderately advanced glaucomatous perimetric damage. Furthermore, we aim to identify the magnitude of the boundary effect of VFI around MD values of −20 dB in longitudinal visual field series, and to characterize the patterns of its behavior.
Methods
This study is a retrospective cohort study of longitudinal data analysis. Our study was approved by the Institutional Review Board of the University of California, Los Angeles, and all study procedures adhered to the tenets of the Declaration of Helsinki and Health Insurance Portability and Accountability Act (HIPAA) regulations.
All visual field data analyzed in the current study were retrieved from the records of glaucoma patients of the University of California, Los Angeles’ (UCLA) Jules Stein Eye Institute, and from data collected during the conduct of the Advanced Glaucoma Intervention Study (AGIS). AGIS design and methods are described in detail elsewhere. In this study, all patients who had 6 or more years of follow-up and who underwent 12 or more visual field examinations were included. We listed all glaucoma patients who had been followed with the Humphrey Field Analyzer (HFA; Carl Zeiss Meditec Inc, Dublin, California, USA) with the 24-2 test pattern and a Goldmann size III target and the Swedish Interactive Threshold Algorithm (SITA) Standard algorithms. Unreliable visual fields were discarded according to the following criteria: 15% or more fixation losses or 15% or more false-positive errors. Tests with high frequencies of false-negative error were not excluded, because a high number of false-negative errors is associated with visual field status more strongly than with patient reliability.
The study reviews patients whose change of MD value straddles −20 dB at least once during the follow-up period. We looked at the serial VFs of these patients and included only the VFs that were between −16 dB and −24 dB. Change in MD (ΔMD) was defined as the absolute difference between MD values of 2 consecutive VFs. Based on the 2 VFI values of the same VFs, the absolute value of change in VFI (ΔVFI) was calculated. The serial VFs were then divided into 2 divisions based on the MD value of 2 consecutive VFs; the first had serial MDs all better than or worse than −20 dB, and the second had serial MDs crossing −20 dB. For each division, we computed the ratio of ΔVFI to ΔMD. Linear regression model was used to evaluate the factors (serial MDs all better than or worse than −20 dB and serial MDs crossing −20 dB) responsible for the ratio of ΔVFI to ΔMD. Because the standard errors allow for intra-group correlation, a cluster (each patient) of data for the study subject was considered the primary sampling unit during the estimation of standard errors. Statistical analyses were performed using Stata (version 12; Stata Corp, College Station, Texas, USA). The left panel of Figure 1 is an example of a patient’s pattern of serial MD and corresponding VFI measurements. The red-shaded areas include serial MDs all better than or worse than −20 dB, and the blue-shaded areas include fields with serial MDs crossing −20 dB.
Results
One hundred forty-eight eyes of 148 patients had a change in MD values of −16 dB to −24 dB, with at least 1 episode of crossing the −20 dB MD value during follow-up. The mean (± SD) age was 67.8 (± 13.0) years and mean follow-up was 6.4 (± 3.2) years. The mean number of visual field tests and 1286 visual fields were studied; 1090 paired ΔMDs and corresponding ΔVFIs were calculated.
The Table provides characteristics of the paired VFs with MD values within the range of −16 dB to −24 dB. The mean MD for serial MDs better than −20 dB was −18.2 (± 1.2) dB, the mean MD for 2 consecutive MDs crossing −20 dB was −19.8 (± 1.5) dB, and the mean MD for serial MDs worse than −20 dB was −21.5 (± 1.1) dB. The mean VFI for serial MDs better than −20 dB was 51.0% (± 7.8%), the mean VFI for 2 consecutive MDs crossing −20 dB was 41.3% (± 10.8%), and the mean VFI for serial MDs worse than −20 dB was 31.2% (± 6.8%).
| VFs With MDs Better Than −20 dB | VFs With 2 Consecutive MDs Crossing −20 dB | VFs With MDs Worse Than −20 dB | |
|---|---|---|---|
| ΔMD and corresponding ΔVFI number (n) | 441 | 343 | 306 |
| MD (dB), mean ± SD | −18.2 ± 1.2 | −19.8 ± 1.5 | −21.5 ± 1.1 |
| ΔMD (dB), mean ± SD | 1.1 ± 0.8 | 2.4 ± 1.2 | 1.0 ± 0.8 |
| VFI (%), mean ± SD | 51.0 ± 7.8 | 41.3 ± 10.8 | 31.2 ± 6.8 |
| ΔVFI (%), mean ± SD | 4.6 ± 3.6 | 15.8 ± 8.4 | 3.6 ± 2.7 |
| ΔVFI/ΔMD (%/dB), mean ± SD | 7.7 ± 11.4 | 7.9 ± 6.2 | 5.6 ± 8.8 |
Stay updated, free articles. Join our Telegram channel

Full access? Get Clinical Tree


