Purpose
To investigate the association between peripheral and central ischemia in diabetic retinopathy.
Design
Retrospective, cross-sectional.
Methods
Consecutive ultra-widefield fluorescein angiography images were collected from patients with diabetes over a 12-month period. Parameters quantified include the foveal avascular zone (FAZ) area, peripheral ischemic index, peripheral leakage index, and central retinal thickness measurements, as well as visual acuity. The peripheral ischemia or leakage index was calculated as the area of capillary nonperfusion or leakage, expressed as a percentage of the total retinal area.
Results
Forty-seven eyes of 47 patients were included. A moderate correlation was observed between the peripheral ischemia index and FAZ area (r = 0.49, P = .0001). A moderate correlation was also observed between the peripheral leakage index and FAZ area, but only in eyes that were laser naïve (r = 0.44, P = .02). A thinner retina was observed in eyes with macular ischemia (217 ± 81.8 μm vs 272 ± 36.0 μm) ( P = .02), but not peripheral ischemia (258 ± 76.3 μm vs 276 ± 68.0 μm) ( P = .24). The relationships between different patterns of peripheral and central macular pathology and visual acuity were evaluated in a step-wise multivariable regression model, and the variables that remained independently associated were age (r = 0.33, P = .03), FAZ area (r = 0.45, P = .02), and central retinal thickness (r = 0.38, P = .01), (R 2 -adjusted = 0.36).
Conclusions
Ultra-widefield fluorescein angiography provides an insight into the relationships between diabetic vascular complications in the retinal periphery and central macula. Although we observed relationships between ischemia and vascular leakage in the macula and periphery, it was only macular ischemia and retinal thinning that was independently associated with a reduced visual function.
Diabetic retinopathy encompasses a group of predominantly vascular anomalies. If left untreated, diabetic retinopathy ultimately results in visual loss, with up to 28 million individuals worldwide affected by vision-threatening diabetic retinopathy. Broadly, the spectrum of disease has been classified according to the behavior of the retinal vasculature: (1) hyperpermeability (leakage and edema), which results in the development of lesions such as macular edema, peripheral hard exudates, and microaneurysms; and (2) hypoperfusion (ischemia), which results in enlargement of the foveal avascular zone (FAZ) in the macula and capillary nonperfusion and retinal neovascularization in the retinal periphery.
It is not known what causes the differential regional distribution of these vascular lesions (ie, peripheral vs central retina), why they occur in some patients but not others, and how they might affect visual function. Epidemiologic studies have suggested that age may be a key component to the different patterns of diabetic retinopathy observed—that is, the predominance of macular edema in older patients with type 2 and proliferative retinopathy in younger patients with type 1 diabetes. Several possible mechanisms have been suggested, including the loss of autoregulation in retinal arterioles, as well as microvascular degeneration in older persons causing capillary leakage with consequent macular edema. In the younger age group, it has been proposed that an intact posterior hyaloid serves as a scaffold for the formation of aberrant neovascularization. However, the pathobiology of the different patterns of diabetic retinopathy phenotypes remains unclear. It is unlikely that age alone is solely responsible.
The advent of ultra-widefield fluorescein angiography (FA) has for the first time provided the opportunity to visualize both the central and peripheral retina in a single examination. Although widefield imaging of the retina has been in development over the past 80 years, older systems encountered obstacles that precluded its wide application in patients with diabetic retinopathy, such as the requirement of a contact lens and clear ocular media for the acquisition of good peripheral images. In recent times, the Optos camera (Optos PLC, Dunfermline, Scotland, UK) has incorporated both a scanning laser ophthalmoscope (which permits imaging through moderate media opacities) and an optical system with an ellipsoid mirror, which allows reliable imaging of the peripheral retina up to the ora serrata. This provides visualization of up to 200 degrees, compared to the 75 degrees achieved by montaging the Early Treatment Diabetic Retinopathy Study (ETDRS) 7-standard fields, taken using the traditional 50-degree-view digital fundus camera.
Given that fluorescein angiography is superior to color photography in detecting vascular lesions, the logical next step was to investigate its applicability to ultra-widefield imaging. Several studies in diabetic eyes have already demonstrated greater detection (compared to conventional fluorescein angiography) of peripheral lesions such as areas of capillary nonperfusion and leakage. Therefore, the development of ultra-widefield FA offers the opportunity to examine, in the diabetic eye, the relationships between both peripheral and central vascular lesions, and may provide new insights into the pathophysiology behind the differential patterns of distribution of diabetic retinopathy lesions observed in these patients.
In this study, we performed qualitative and quantitative analyses of capillary nonperfusion and leakage, both in the central and peripheral retina. We also examine the relationships between these parameters and optical coherence tomography (OCT)-derived measurements of retinal thickness and visual acuity, in an effort to elucidate its clinical significance.
Materials and Methods
Inclusion Criteria and Data Collection
In this retrospective, consecutive, observational case series, imaging data were collected from patients who underwent ultra-widefield FA over a 12-month time period at a single center (tertiary-referral medical retina clinic). Approval for data collection and analysis was obtained from the institutional review board of Moorfields Eye Hospital, and the study adhered to the tenets set forth in the Declaration of Helsinki.
Patients with a primary diagnosis of type 1 or type 2 diabetes were included in the study. Demographic and clinical data, such as visual acuity and retinopathy/maculopathy grades, were obtained from standardized electronic reports in the United Kingdom National Screening Committee (UK NSC)—Diabetic Eye Screening Programme, a grading system based on color photography and clinical examination, which has been described in more detail elsewhere ( Table 1 ). Exclusion criteria included ocular comorbidities such as retinal arterial or venous occlusion, neovascular age-related macular degeneration, inherited macular disease, posterior segment inflammation, or macular scarring of any etiology.
| All Patients (n = 47) | |
|---|---|
| Age, median (IQR) | 55 (15.0) |
| Female sex, n (%) | 21 (44.7) |
| Affected eye—right, n (%) | 27 (57.4) |
| Diabetes, n (%) | |
| Type 1 | 12 (25.5) |
| Type 2 | 35 (74.5) |
| UK NSC retinopathy grade, n (%) | |
| Nonproliferative | 12 (25.5) |
| Proliferative | 35 (74.5) |
| UK NSC maculopathy grade, n (%) | |
| No DME | 21 (44.7) |
| DME | 26 (55.3) |
| uwFA macular edema grade, n (%) | |
| None | 15 (31.9) |
| Focal & diffuse | 32 (68.1) |
| PRP laser, n (%) | |
| Naïve | 27 (57.4) |
| Treated | 20 (42.6) |
| Retinal thickness, median μm (IQR) | 265 (81.0) |
| Median FAZ area, mm 2 (IQR) | 0.35 (0.28) |
| Visual acuity, median logMAR, (IQR) | |
| Test eye | 0.2 (0.45) |
| Contralateral eye | 0.2 (0.60) |
Acquisition and Analysis of Fluorescein Angiograms
Ultra-widefield fluorescein angiography image aquisition
All ultra-widefield FA images were acquired with the Optos C200 MA ultra-widefield retinal imaging system (Optos PLC, Dunfermline, Scotland, UK), which allows imaging of up to 200 degrees (82%) of the retina in a single image. All patients received a standard infusion of 5 mL of 20% sodium fluorescein through the anticubital vein. One early to mid-phase image (at 20–40 seconds) and a second late-phase image (at 5–7 minutes), centered on the optic disc, were chosen for analysis. The early to mid-phase image was graded for peripheral and macular ischemia and the late-phase image for peripheral leakage. All ultra-widefield FA images were exported as .tiff files and analyzed on commercially available software Adobe Photoshop CS4 extended (Photoshop; Adobe Systems, San Jose, California, USA). No image manipulation was performed prior to grading.
Quantification of peripheral ischemia and leakage
An ischemic index was calculated from the early to mid-phase FA using previously described methodology. Briefly, areas of capillary nonperfusion outside the temporal vascular arcades were expressed as a percentage of the total image area in pixels ( Figure 1 , First and second rows).
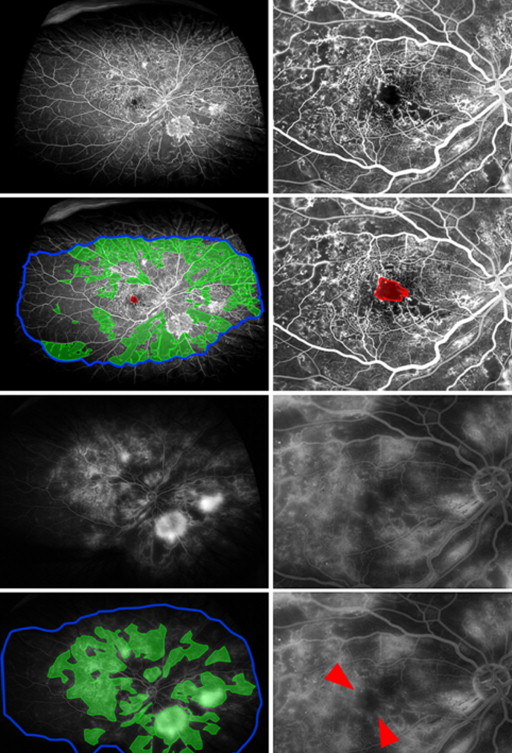
In addition, for this study, the “total area” was defined as an area in which retinal vasculature was in sharp focus, thereby allowing accurate visualization of smaller retinal capillaries ( Figure 1 , Second row, right). Owing to the spherical curvature of the eye, ultra-widefield images commonly exhibit “blurred” areas in the far periphery when the central portion of the image is in focus. In excluding these “blurred” areas from “total area” measurements, the resultant image is smaller than the 200 degree scanning angle that can be achieved by the ellipsoidal mirror within the Optos imaging system. However, it avoids underestimating the peripheral ischemic index by the inclusion of parts of the retina where capillary nonperfusion cannot be visualized.
A peripheral “leakage” index was adapted from the ischemic index, similarly calculated, where areas of FA leakage (both from neovascular fronds and retinal capillaries) outside the temporal vascular arcades were quantified in pixels and expressed as a percentage of the total area ( Figure 1 , Third and fourth rows).
Quantification of macular ischemia and leakage
Boundaries for the FAZ were manually delineated, and area measurements were calculated and analyzed in pixels but were subsequently converted into square millimeters (mm 2 ) for the purpose of clinical interpretation, using a scale factor based on the assumption that the disc area was 2.7 mm 2 .
Ultra-widefield FAs were graded for the presence of macular capillary leakage (ie, edema in late-phase angiograms). The ultra-widefield FA macular edema grades were classified as “none,” “focal leakage,” and “diffuse leakage.”
Definitions
The FAZ area, as measured using early to mid-phase ultra-widefield FA, was divided into “large” (>0.32 mm 2 ) and “small” (<0.32 mm 2 ) categories ( Table 2 ). As established in our previous study, a “large” FAZ area corresponds to an ETDRS-defined diabetic macular ischemia grade of “moderate” to “severe.” A low peripheral ischemia/leakage index was defined as less than 50% and a high peripheral ischemia/leakage index more than 50% of the total area.
| FAZ Area (mm ) | Peripheral Ischemia Index (%) | Peripheral Leakage Index (%) | |||||||
|---|---|---|---|---|---|---|---|---|---|
| Small (<0.32 mm 2 ) (n = 20) | Large (>0.32 mm 2 ) (n = 27) | P Value | Low (<50%) (n = 33) | High (>50%) (n = 14) | P Value | Low (<50%) (n = 35) | High (>50%) (n = 12) | P Value | |
| Age, median (IQR) | 51 (26.8) | 57 (12.5) | .09 | 56 (15.0) | 51 (9.3) | .40 | 55 (14.0) | 55 (27.8) | .17 |
| Female sex, n (%) | 7 (35.0) | 14 (51.9) | .39 | 15 (45.5) | 6 (42.9) | .88 | 13 (37.1) | 8 (66.7) | .08 |
| Affected eye—right, n (%) | 10 (50.0) | 17 (63.0) | .56 | 19 (57.6) | 8 (57.1) | .77 | 20 (57.1) | 7 (58.3) | .87 |
| Diabetes, n (%) | |||||||||
| Type 1 | 7 (35.0) | 5 (18.5) | .29 | 9 (27.3) | 3 (21.4) | .94 | 8 (22.9) | 4 (33.3) | .31 |
| Type 2 | 13 (65.0) | 22 (81.5) | 24 (72.7) | 11 (78.6) | 27 (77.1) | 8 (66.7) | |||
| UK NSC retinopathy grade, n (%) | |||||||||
| Nonproliferative | 3 (15.0) | 9 (33.3) | .28 | 10 (30.3) | 2 (14.3) | .43 | 10 (28.6) | 2 (16.7) | .04 a |
| Proliferative | 17 (85.0) | 18 (66.7) | 23 (69.7) | 12 (85.7) | 25 (71.4) | 10 (83.3) | |||
| UK NSC maculopathy grade, n (%) | |||||||||
| No DME | 12 (60.0) | 14 (51.9) | .80 | 18 (54.5) | 8 (57.1) | .88 | 19 (54.3) | 7 (58.3) | .60 |
| DME | 8 (40.0) | 13 (48.1) | 15 (45.5) | 6 (42.9) | 16 (45.7) | 5 (41.7) | |||
| uwFA macular edema grade, n (%) | |||||||||
| None | 11 (55.0) | 13 (48.1) | .87 | 16 (48.5) | 8 (57.1) | .82 | 19 (54.3) | 5 (41.7) | .94 |
| Focal & diffuse | 9 (45.0) | 14 (51.9) | 17 (51.5) | 6 (42.9) | 16 (45.7) | 7 (58.3) | |||
| PRP laser | |||||||||
| Naïve | 8 (40.0) | 19 (70.3) | .07 | 17 (51.5) | 10 (71.4) | .35 | 25 (71.4) | 2 (16.7) | .16 |
| Treated | 12 (60.0) | 8 (29.7) | 16 (48.5) | 4 (28.6) | 10 (28.6) | 10 (83.3) | |||
| Retinal thickness, median μm (IQR) | 272 (36.0) | 217 (81.8) | .02 a | 267 (75.0) | 226 (94.5) | .08 | 258 (76.3) | 276 (68.0) | .24 |
| Median FAZ area, mm 2 (IQR) | 0.24 (0.08) | 0.55 (0.54) | .0001 b | 0.32 (0.28) | 0.56 (0.86) | .02 a | 0.40 (0.41) | 0.28 (0.21) | .12 |
| Visual acuity, median logMAR (IQR) | |||||||||
| Test eye | 0 (0.20) | 0.2 (0.35) | .02 a | 0.2 (0.30) | 0.2 (0.60) | .21 | 0.2 (0.50) | 0.2 (0.23) | .53 |
| Contralateral eye | 0 (0.30) | 0.3 (0.60) | .02 a | 0.2 (0.50) | 0.2 (0.80) | .43 | 0.2 (0.75) | 0.3 (0.35) | .97 |
Stay updated, free articles. Join our Telegram channel

Full access? Get Clinical Tree


