Purpose
To evaluate retinal anatomy and segmentation errors from spectral-domain optical coherence tomography (SD-OCT) imaging in school-aged children.
Design
A prospective cohort study in a referral medical center.
Methods
One hundred thirty-three eyes of 133 patients were enrolled. Patients were grouped as those who were treated for retinopathy of prematurity (ROP) (ROP-Tx group); those with spontaneously regressed ROP (ROP-non-Tx group); other premature patients (premature group); and full-term age-matched children (full-term group). Anatomy and segmentation errors of retina were evaluated by SD-OCT.
Results
The mean age at assessment was 9.5 years (range, 4–16 years). The external limiting membrane (ELM) and the cone outer segment tips (COST) line were least frequently identified in patients of the ROP-Tx group (65.2% and 47.8%, P = .002 and P < .001, respectively). The visual acuity of the patients did not correlate significantly with the absence of COST line ( P = .140) but correlated with the absence of ELM ( P < .001). The presence of artifacts, including misidentification of the inner retina, misidentification of the outer retina, out-of-register artifacts, off-center scans, and degraded scan images, was observed to range from 0.6% to 50.0% in 4 groups of patients. All types of errors occurred more frequently in the ROP-Tx group than in the full-term group (all P < .05).
Conclusions
Outer retinal abnormalities were commonly observed in the ROP-Tx group. The higher segmentation errors in the ROP-Tx group might be related to fine structural abnormalities in the outer retina. Future studies are needed to investigate the mechanisms for these structural changes.
Optical coherence tomography (OCT) is a reliable diagnostic tool that provides information on macular volume and foveal thickness in retinal diseases. OCT is therefore useful in following the evolution of macular disease and serving as a guide for treatment. A newer version of OCT, high-resolution spectral-domain OCT (SD-OCT), which improves axial resolution, may provide more information on the abnormalities of the vitreoretinal junction and intraretinal changes.
One of the characteristics of OCT is its capability to quantify macular changes. Macular thickness is usually measured automatically by software attached to the OCT machine. Segmentation errors, such as misidentification of the inner retina or the outer retina, out-of-register artifacts, off-center scans, and degraded scan images, can occur when defining the inner and outer retinal boundary using the software, especially in pathologic conditions that disrupt the normal shape of retinal layers. The incidence of segmentation errors by OCT in measuring different retinopathies varies from 8.3% to 83.3%. A decreased frequency of segmentation errors was found in SD-OCT instruments compared with time-domain (TD) OCT because of the improved image quality, faster image acquisition, and increased sensitivity of SD-OCT.
Retinopathy of prematurity (ROP) is one of the leading causes of childhood blindness. Macular abnormalities—for example, increased fovea thickness and hypoplastic fovea in ROP patients—have been detected by OCT in recent studies. However, these studies did not find a correlation with the poor corrected vision in ROP patients. Previous literature reported that the development of photoreceptor inner and outer segment was delayed in very preterm infants when examined at 37–42 weeks of postmenstrual age. We hypothesize that retinal structure in patients with history of ROP may also be different from that of full-term infants at school age. This has implications for understanding the role of OCT in evaluation of premature infants, and for understanding the retinal anatomy in infants with ROP. To further study this, segmentation of the retina by OCT in these patients and the segmentation errors associated with these measurements must be examined. In the current study, we use SD-OCT to examine the retinal anatomy of patients with a history of ROP and record the artifacts in automatic retinal segmentation. The retinal anatomy was reviewed and the incidence and types of segmentation error and their possible association were studied.
Methods
Patients and Grouping
Approval for data collection and analysis was obtained from the institutional review board of the Chang Gung Memorial Hospital. The research adhered to the tenets set forth in the Declaration of Helsinki. Written informed consent was obtained from a parent or guardian for each participant.
This was a prospective cohort study that included children with a previous history of ROP who were followed up at our hospital and control patients without a previous ROP history. The study was conducted between December 1, 2009 and May 31, 2012. Patients born at our hospital were invited to participate in this study by telephone or by an invitation letter to their families. All patients were Asian. Patients were included if they had a normal posterior pole retina by ophthalmoscopic examination. Patients were excluded if they had opaque media or residual sequelae of ROP (eg, macular dragging, macular folding, retinal detachment), or if they were unable to cooperate for examination. All of the eyes were free from other ocular diseases. Both eyes of each participant were examined, but data from only the right eyes were included in the analysis. Birth history, previous ROP condition, and the best-corrected visual acuity of the patients were documented.
Patients were classified into the following 4 groups: children with a history of threshold ROP who had been treated using laser therapy or cryotherapy (ROP-Tx group); children with regressed ROP who did not receive any treatment (ROP-non-Tx group); other premature children without ROP (premature group); and full-term control group (full-term group). The full-term group was an age-matched group of healthy children who had been born at full term (gestational age [GA] ≥37 weeks and birthweight [BW] ≥2500 g) and were recruited from our clinics.
Scanning Protocol of Optical Coherence Tomography
OCT images from all participants were analyzed with RTVue-100 SD-OCT (software version 4.0; Optovue, Inc, Fremont, California, USA). The system had an axial resolution of 5 mm and could perform 26,000 A-scans per second. It was serviced regularly, in line with the manufacturer recommendations, by authorized technicians from Optovue to ensure that the machine was calibrated and operating correctly. For each eligible patient, both eyes were scanned using the RTVue-100, following pharmacologic pupillary dilation. The imaging was performed by an experienced technician.
The MM5 protocol (version A4, 0, 0, 143) was used. The scan area was 5 × 5 mm 2 centered on the fovea. This protocol scanned a 5 × 5 mm 2 grid of 11 horizontal and 11 vertical lines with 668 A-scans each and an inner 3 × 3 mm 2 grid of 6 horizontal and 6 vertical lines with 400 A-scans each. The image quality was checked carefully following each acquisition. Image quality on the RTVue-100 was determined using a signal strength index (SSI) parameter, ranging from nearly 0 (no signal) to approximately 90 (very strong signal). Only scans with SSI of at least 40 were used in the analyses.
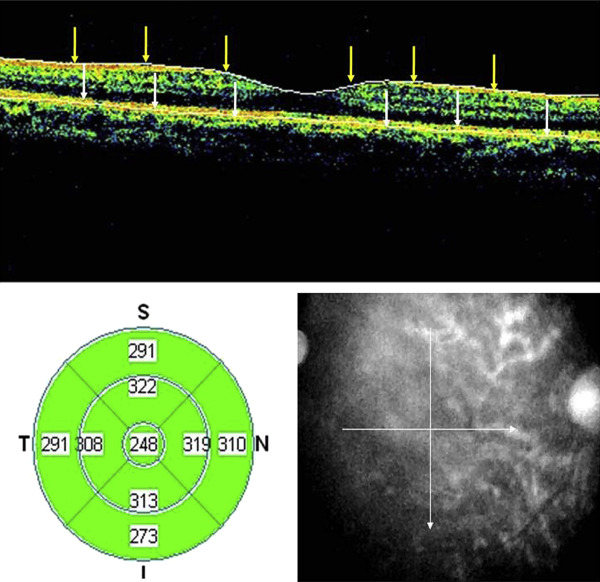
The standard output display for the MM5 protocol included a color topographic map that displayed numeric averages of the thickness measurements for each of the 9 map sectors, as defined by the Early Treatment Diabetic Retinopathy Study (ETDRS). Each line scan in the volume scan could be viewed individually. A set of cross-line scans of the fovea was displayed at output. Figure 1 shows an example of output display from artifact-free scans of a healthy eye of a patient in the full-term group.
Retinal Microstructures
Following each examination, the best images with no eye movement or blinking were selected. Only 1 volume scan per eye per patient was included in the study. For each volume scan included in the study, the total number of line scans was reviewed.
The RTvue-100 identified the inner retinal boundary as the first interferometric signal after the vitreous hyporeflective space, which corresponded to the internal limiting membrane, and identified the outer retinal boundary at the external limit of the retinal pigment epithelium (RPE). Retinal layers were evaluated and investigated to determine if there was a correlation with segmentation errors. The crossed line scans with gray-scale display images were used to evaluate the integrity of the external limiting membrane (ELM), the inner segment/outer segment (IS/OS) junction, the cone outer segment tips (COST) line, and the RPE layer in the foveal region. The images were magnified with the built-in zoom function to evaluate the foveal microstructures. The results of the 4 groups were compared.
Segmentation Errors
The artifacts of each line scan produced during automatic retinal segmentation were recorded. Individual line scans containing multiple examples of a particular artifact type were counted only once for that artifact type. However, line scans with more than 1 artifact type were counted for each different artifact type. Artifacts were defined as any incongruence greater than 5 μm between the position of the error and the real retinal boundaries.
Artifacts within the 5-mm area were graded according to the severity of segmentation errors as mild, moderate, and severe errors, according to a previous study. Artifacts that caused a segmentation error of less than one third of the retinal thickness at the point of the error were defined as mild; moderate and severe errors were those that resulted in segmentation errors one third to two thirds and more than two thirds of the retinal thicknesses, respectively.
Various types of image artifacts of OCT described by Ray and associates were investigated in the current study. These included the following: (1) misidentification of the inner retina, (2) misidentification of the outer retina, (3) out-of-register artifacts in which the inner retina was truncated because of a superiorly shifted scan, (4) off-center scans not properly centered on an identifiable foveal depression, (5) degraded scan images, and (6) cut-edge artifact.
Artifacts within the center 1-mm area were graded according to the severity of segmentation errors. RTVue-100 OCT allowed the user to re-center scans manually after image acquisition by repositioning the ETDRS grid on the fundus image. Retinal thickness measurements were recalculated automatically after segmentation line edits or scan re-centering. The clinical significance of artifacts was defined as any artifact resulting in automated segmentation errors of more than 10% of the actual center subfield thickness or any artifact resulting in an error of more than 50 μm. The 10% change cutoff point was selected based on prior studies.
The absence of foveal depression was defined according to a previous publication. The lower limit of the 95% confidence interval (CI) of the difference between the parafoveal and foveal thicknesses obtained from full-term group patients was used as the cutoff point. Values lower than 50.6 μm indicated an absence of foveal depression.
Statistical Analysis
The frequency of artifacts in volume scans or line scans was calculated. To determine the relative proportion of line scans with artifacts, the number of line scans with artifacts was divided by the total number of line scans per volume scan. These analyses were performed for each type of artifact and for scans by different groups. To compare the 4 groups, numerical variables were presented as the mean and standard deviation (SD), with P values calculated using a 1-way analysis of variance (ANOVA) test. χ 2 tests were applied to examine associations of categorical variables among the 4 groups. Statistical software (IBM SPSS v20.0, Chicago, IL, USA) was used for data analysis. A P value of less than .05 was considered statistically significant in all tests.
Results
Demographic Information
A total of 133 eyes in 133 patients (75 male and 58 female) met the screening criteria and completed the examinations. There were 23 patients who had cryotherapy treatment or laser photocoagulation (ROP-Tx group), 18 patients with prior ROP history who did not require treatment (ROP-non-Tx group), 44 patients with a preterm history but without ROP (premature group), and 48 normal full-term children (full-term group). The mean GA was, respectively, 25.8 ± 1.5 weeks, 28.7 ± 2.0 weeks, 31.3 ± 2.6 weeks, and 38.1 ± 2.3 weeks in these 4 groups ( P < .001). The mean BW was, respectively, 864.9 ± 219.6 g, 1129.3 ± 217.1 g, 1677.3 ± 523.2 g, and 3037.6 ± 321.1 g in the 4 groups ( P < .001). The mean GA and BW of patients in the ROP-Tx group were significantly lower than those of the other groups. The mean age at assessment was 9.5 years (range, 4–16 years). The distribution of sex and age at examination were similar among the 4 groups.
The best-corrected visual acuity (BCVA) in logMAR was, respectively, 0.17 ± 0.20, 0.09 ± 0.20, 0.04 ± 0.13, and 0.01 ± 0.05 in the 4 groups ( P < .001), and the respective spherical equivalent cycloplegic refractive errors were −5.9 ± 5.1, −1.2 ± 2.6, −1.7 ± 2.3, and −1.5 ± 1.9 diopters. Best-corrected vision was poorest and the extent of myopia was most severe in patients in the ROP-Tx group compared with patients in other groups (both P < .001). The measured full retinal thickness (μm) over the fovea was 284.7 ± 23.3, 263.7 ± 16.6, 263.2 ± 24.7, and 244.4 ± 17.0 in the 4 groups, respectively ( P < .001). Patients treated for ROP had the greatest full retinal thickness over the fovea. The mean SSI was 68.5 (range, 41.2–86.5). The SSI was lowest in ROP-Tx group patients compared with the other groups ( P < .001). The demographics and refractive information are presented in Table 1 .
| ROP-Tx Group (N = 23) | ROP-Non-Tx Group (N = 18) | Premature Group (N = 44) | Full-Term Group (N = 48) | P | |
|---|---|---|---|---|---|
| Demographics | |||||
| GA (wk) (mean ± SD) | 25.8 ± 1.5 | 28.7 ± 2.0 | 31.3 ± 2.6 | 38.1 ± 2.3 | <.001 |
| BW (g) (mean ± SD) | 864.9 ± 219.6 | 1129.3 ± 217.1 | 1677.3 ± 523.2 | 3037.6 ± 321.1 | <.001 |
| Sex | .892 | ||||
| Male n (%) | 11 (47.8) | 9 (50.0) | 26 (59.9) | 29 (60.4) | |
| Female n (%) | 12 (52.2) | 9 (50.0) | 18 (40.1) | 19 (39.6) | |
| Assessment age (year) | 9.9 ± 3.3 | 9.7 ± 2.8 | 9.4 ± 2.9 | 9.8 ± 2.4 | .774 |
| Visual acuity and refractive errors | |||||
| BCVA (logMAR) | 0.17 ± 0.20 | 0.09 ± 0.20 | 0.04 ± 0.13 | 0.01 ± 0.05 | <.001 |
| Spherical equivalence (D) | −5.94 ± 5.11 | −1.17 ± 2.62 | −1.67 ± 2.31 | −1.45 ± 1.88 | <.001 |
| Fovea OCT measurement | |||||
| Full retinal thickness (μm) | 284.7 ± 23.3 | 263.7 ± 16.6 | 263.2 ± 24.7 | 244.4 ± 17.0 | <.001 |
| Inner retina (μm) | 99.2 ± 15.5 | 87.2 ± 11.3 | 89.8 ± 19.0 | 76.8 ± 10.0 | <.001 |
| Outer retina (μm) | 185.5 ± 13.2 | 176.4 ± 9.6 | 173.6 ± 10.2 | 167.7 ± 10.4 | <.001 |
| Full retinal volume (mm 3 ) | 0.22 ± 0.02 | 0.20 ± 0.04 | 0.21 ± 0.02 | 0.19 ± 0.01 | <.001 |
| SSI | 57.1 ± 7.97 | 66.5 ± 9.2 | 69.8 ± 8.5 | 70.9 ± 7.6 | <.001 |
Evaluation of Retinal Anatomy
Table 2 illustrates the detection rates of ELM, IS/OS line, COST line, and RPE in each group of patients. The detection rates of ELM and COST lines were significantly lower in the patients in the ROP-Tx group than in the other groups of patients ( P = .002 and P < .001, respectively). The BCVA of the patients did not correlate significantly with the absence of COST line ( P = .140) but correlated with the absence of ELM ( P < .001). However, none of the patients in the ROP-Tx group had epiretinal membrane. Figure 2 demonstrates the examples of detection of all 4 lines.


