Purpose
To analyze type 1 neovascular membranes in age-related macular degeneration (AMD) using optical coherence tomography (OCT) angiography, to correlate morphologic characteristics with imaging and clinical criteria, and to analyze structural features of type 1 neovascularization sequentially after anti–vascular endothelial growth factor (VEGF) therapy.
Design
Prospective interventional case series.
Methods
Macular OCT angiography images were acquired using the RTVue XR Avanti with AngioVue. Distinct morphologic patterns and quantifiable features of the neovascular membranes were studied on en face projection images at baseline and follow-up.
Results
Thirty-three eyes of 25 patients were included. In 75% of the eyes, a highly organized vascular complex could be identified. A large main central vessel trunk/feeder vessel could be seen in 72% of these eyes, with vessels radiating in a branching pattern either in all directions from the center of the lesion (“medusa” pattern), or from one side of the lesion (“seafan” pattern). Of the 18 eyes with follow-up OCT angiography, the lesion area and vessel density remained unchanged, even after anti–vascular endothelial growth factor (VEGF) therapy, indicating a more mature longstanding neovascular complex resistant to anti-VEGF therapy.
Conclusions
OCT angiography provides a unique opportunity to study the morphology of occult type 1 neovascular membranes in AMD and allows precise structural and vascular assessment noninvasively. We identified a large mature neovascular complex in approximately 75% of eyes, typically consisting of a feeder vessel and large branching vessels resistant to anti-VEGF therapy. OCT angiography may better guide evaluation and treatment of neovascular AMD, and may contribute to the development of improved therapies.
Neovascular age-related macular degeneration (AMD) may be classified according to the localization of the new vessel complex by optical coherence tomography (OCT). Type 1 neovascularization originates from the choroid, is located under the retinal pigment epithelium (RPE), and is typically associated with a RPE detachment. Type 2 neovascularization also originates from the choroid but is present above the RPE in the subretinal compartment. Type 3 neovascularization originates from the deep retinal capillary plexus, and its initial location is intraretinal. Type 1 and type 3 membranes make up the vast majority (75%) of lesions in neovascular AMD. Because of the occult nature of type 1 membranes and their location under the RPE, it has been challenging to visualize the microvascular complex using conventional angiography or spectral-domain OCT.
OCT angiography is an advanced imaging modality that employs amplitude or phase decorrelation technology with high-frequency and dense volumetric scanning to detect erythrocyte movement, allowing direct visualization of blood vessels in vivo, without the use of exogenous dyes. In the present study, we applied this novel imaging modality to characterize eyes with type 1 neovascularization in AMD by correlating morphologic OCT angiography characteristics with various imaging and clinical criteria and to perform precise qualitative and quantitative analysis of the structural features of type 1 neovascularization at baseline and sequentially after anti–vascular endothelial growth factor (VEGF) therapy.
Methods
This prospective interventional case series adhered to the tenets of the Declaration of Helsinki and was approved by the UCLA Institutional Review Board, which allowed recruitment of patients, review of clinical charts, and the acquisition of OCT angiography scans with the RTVue XR Avanti with AngioVue. The study was carried out in accordance with HIPAA regulations. Patients diagnosed with AMD and RPE detachment associated with active or chronic type 1 neovascularization as identified with spectral-domain OCT analysis were consecutively enrolled and underwent OCT angiography. Informed consent was obtained from all participants for participation in the research and image acquisition. Follow-up images were obtained on patients who returned within 3 months. Fluorescein angiography was not built into the study protocol, because it would unlikely be informative given the chronicity of most of the lesions.
Chart review was performed and clinical data were collected for each subject. Patient demographics and history of intravitreal anti-VEGF injections were recorded. Snellen visual acuity was obtained and converted into logMAR equivalent for data analysis. Conversion charts were used for patients with low vision.
Enhanced depth imaging OCT was performed to assess lesion characteristics, such as the maximum height and width of the RPE detachment using the caliper tool provided in the software. The evidence of intraretinal, subretinal, and sub-RPE fluid (to determine whether the lesion was active or inactive); the presence of multilayered, highly organized material in the sub-RPE space; and the presence of RPE atrophy were also assessed on OCT imaging.
OCT angiography images were acquired using the RTVue XR Avanti with AngioVue (Optovue Inc, Fremont, California, USA), with an A-scan-rate of 70 000 scans per second, a light source of 840 nm, and a bandwidth of 45 nm. Macular cubes (3 × 3 mm) were acquired, each cube consisting of 304 clusters of 2 repeated B-scans containing 304 A-scans each. Split-spectrum amplitude-decorrelation technology was employed to improve the signal-to-noise ratio by splitting the spectrum to generate multiple repeat OCT frames from 2 original repeat OCT frames. Motion correction was performed using registration of 2 orthogonally captured imaging volumes. Automatic segmentation of the retinal layers was performed by the viewing software and was used to generate en face projection images after adjusting the level of the segmented layer on the B-scans to best visualize the type 1 neovascular complex.
On the en face images, distinct morphologic patterns and quantifiable features of the type 1 neovascular membranes were analyzed. The area of the type 1 neovascular complex, the width of the largest vessel of the lesion, and the vessel density of the lesion were assessed at baseline and at follow-up (when available) using the Free Select, Measure, and Threshold tools of the publicly available image processing software Image J (public domain software, National Institutes of Health, Bethesda, Maryland, USA) and GIMP 2.8.14 ( http://gimp.org ). Pixel measurements were converted to millimeters using the following equations: length (mm) = length (px) × 3/304, and area (mm 2 ) = area (px) × (3/304) 2 . The true size of a feature (on a fundus photograph) can be determined by its measured size, a correction factor that depends on the axial length or the corneal radius and the ametropia at the corneal vertex, and a numerical factor that depends on the device. In our pilot study, we did not measure these optical dimensions, nor has the numerical factor for the device been established. Eyes in which the membrane could not be measured entirely because it exceeded the size of the scanned area were noted. The vessel density was assessed for eyes with follow-up OCT angiography by converting the en face images into binary images using a threshold that was manually adjusted to best visualize the vessels of the membrane. The vessel density was then calculated as percent area of the lesion occupied by vessels. To assess differences between visits, the vessel density of the respective follow-up lesion was calculated using the same segmentation boundaries and threshold when generating the binary image. Additionally, qualitative characteristics of large and small blood vessels of the lesions were noted. En face OCT angiography images were also used to assess the presence of a choroidal flow void signal surrounding the vascular lesion as dark areas at the level of the choriocapillaris despite the absence of shadowing from the RPE detachment/thickened RPE.
Statistical analyses were performed with PASW Statistics for Windows, Version 18.0 (SPSS, Inc, Chicago, Illinois, USA), using Pearson coefficients and paired-samples t tests. The significance level was set at 5%.
Results
Thirty-three eyes of 25 patients were included in the study ( Table 1 ). The mean age at the baseline visit was 79 years (range, 64–97 years), and 14 patients (56%) were female. Snellen visual acuity at the baseline visit ranged from 20/25 to counting fingers at 1 foot with a median of 20/40. The most commonly administered treatment regimen was a combination of aflibercept and ranibizumab in 13 eyes (39%), whereas the remainder received a monotherapy of either aflibercept (n = 8; 24%), ranibizumab (n = 7; 21%), bevacizumab (n = 2; 6%), a combination of all 3 (n = 2; 6%), or aflibercept and bevacizumab (n = 1; 3%). The mean number of intravitreal anti-VEGF injections received before the baseline visit was 15.3 (range, 1–36 injections).
| Case | Age | Sex | Eye | Visual Acuity | Total Number of Injections | Lesion Type SD OCT | Lesion Type OCTA | Lesion Area (mm 2 ) | Lesion Extending a | PED Max Height (μm) | PED Max Width (μm) |
|---|---|---|---|---|---|---|---|---|---|---|---|
| 1 | 64 | M | OD | 20/25 | 6 | A | IND | * | * | 53 | 941 |
| 2 | 64 | M | OD | 20/2000 | 8 | I | M | 3.41 | 1 | 324 | 3150 |
| 3 | 66 | M | OD | 20/30 | 11 | A | M | 2.26 | 0 | 165 | 1790 |
| 4 | 66 | M | OS | 20/150 | 7 | I | SF | 4.30 | 1 | 79 | 2682 |
| 5 | 68 | F | OS | 20/25 | 13 | A | M | 3.98 | 1 | 308 | 3670 |
| 6 | 69 | M | OS | 20/30 | 6 | I | M | 8.46 | 1 | 106 | 3730 |
| 7 | 69 | F | OS | 20/40 | 14 | A | M | 1.29 | 0 | 546 | 6980 |
| 8 | 70 | F | OS | 20/40 | 26 | I | M | 8.79 | 1 | 186 | 4070 |
| 9 | 70 | M | OS | 20/50 | 2 | A | M | 2.61 | 0 | 549 | 3510 |
| 10 | 74 | M | OD | 20/40 | 7 | A | IND | 1.56 | 0 | 200 | 2250 |
| 11 | 75 | F | OD | 20/40 | 2 | A | IND | * | * | 251 | 2620 |
| 12 | 76 | F | OD | 20/25 | 36 | A | SF | 8.72 | 1 | 439 | 5500 |
| 13 | 76 | F | OS | 20/30 | 36 | A | M | 6.21 | 1 | 320 | 6150 |
| 14 | 77 | M | OD | 20/40 | 13 | A | SF | 3.08 | 0 | 179 | 2050 |
| 15 | 78 | F | OD | 20/30 | 3 | A | M | 5.50 | 0 | 356 | 2270 |
| 16 | 81 | F | OD | 20/40 | 24 | A | M | 6.95 | 1 | 159 | 3470 |
| 17 | 81 | F | OS | 20/50 | 26 | A | SF | 2.78 | 1 | 142 | 1950 |
| 18 | 83 | F | OD | 20/60 | 10 | I | M | 8.19 | 1 | 108 | 4430 |
| 19 | 83 | F | OS | 20/80 | 8 | I | M | 7.67 | 1 | 231 | 2940 |
| 20 | 85 | F | OD | 20/30 | 1 | A | IND | * | * | 91 | 938 |
| 21 | 85 | M | OD | 20/50 | 32 | A | IND | 0.80 | 0 | 398 | 846 |
| 22 | 85 | F | OD | 20/50 | 17 | A | M | 9.00 | 1 | 162 | 2360 |
| 23 | 87 | M | OD | 20/60 | 17 | I | SF | 7.75 | 1 | 184 | 3750 |
| 24 | 87 | M | OS | 20/30 | 13 | I | M | 7.73 | 1 | 197 | 3150 |
| 25 | 87 | F | OD | 20/70 | 27 | I | M | 9.00 | 1 | 145 | 4130 |
| 26 | 87 | F | OS | 20/50 | 15 | I | M | 9.00 | 1 | 99 | 3750 |
| 27 | 88 | F | OD | 20/40 | 29 | A | M | 5.05 | 1 | 135 | 3030 |
| 28 | 88 | F | OS | 20/25 | 25 | I | M | 6.91 | 1 | 101 | 3530 |
| 29 | 89 | M | OS | 20/30 | 25 | A | IND | * | * | 262 | 3090 |
| 30 | 91 | F | OD | 20/30 | 5 | A | IND | * | * | 84 | 2280 |
| 31 | 93 | F | OD | 20/100 | 17 | A | SF | 6.37 | 1 | 124 | 3245 |
| 32 | 93 | F | OS | 20/60 | 17 | A | SF | 9.00 | 1 | 279 | 4960 |
| 33 | 97 | M | OD | 20/70 | 6 | A | IND | * | * | 394 | 3310 |
On spectral-domain OCT imaging, 22 lesions (22/33; 67%) were classified as active with evidence of intraretinal, subretinal, and/or sub-RPE fluid. In 19 of 33 eyes (58%), the RPE detachment demonstrated a fusiform or spindle-shaped complex of highly organized, layered, homogenous hyperreflective material, which was termed a multilayered RPE detachment. The mean maximum RPE detachment height was 223 μm (range, 53–549 μm). The mean maximum RPE detachment width was 3228 μm (range, 846–6980 μm). RPE atrophy was present in 21 eyes (64%).
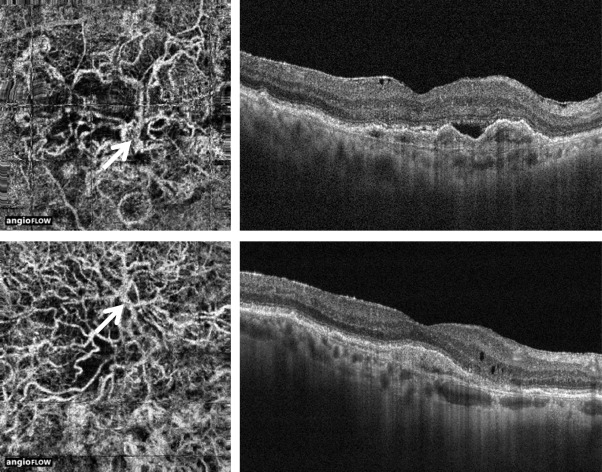
Two distinct type 1 membrane morphologies were identified. In the “medusa” form, the vessels branched in all directions from the center of the lesion, where a large main vessel trunk or feeder vessel could be identified ( Figures 1 and 2 ). In the “seafan” form, greater than 90% of the membrane radiated from 1 side of the lesion; again a large main vessel trunk or feeder vessel could be seen ( Figures 2 and 3 ). Lesions with lack of detail or absence of distinct vessels were determined to be “indistinct.” Of the 33 lesions, 18 (55%) were classified as “medusa,” thus the most common type in this study. Seven (21%) were classified as “seafan” and 8 (24%) as “indistinct.” Fourteen of the “medusa”-type lesions (14/18; 78%) had a visible feeder vessel, while 4 of the “seafan” type (4/7; 57%) had a visible feeder vessel. A choroidal flow void signal could be seen in 4 lesions (4/33; 12%), whereas no choroidal flow void signal was seen in 3 (3/33; 9%) ( Figure 4 ). Twenty-six lesions were not considered in the analysis of a choroidal flow void signal because the lesion extended beyond the scanned area (20/33, 61%), or the image quality was poor (6/33, 18%).
The mean area of the lesion at baseline was 5.79 mm 2 (range, 0.80–9.00 mm 2 for lesions covering the entire scanned area, n = 27). The mean width of the largest-caliber vessel within the neovascular membrane was 92 μm (range, 39–178 μm, n = 27).
The neovascularization area at baseline was found to have a negative correlation with visual acuity (Pearson coefficient -0.12) and a positive correlation with the number of intravitreal anti-VEGF injections received before imaging (Pearson coefficient +0.19), but neither of these was statistically significant ( P = .55 and P = .34).
The morphologic pattern of type 1 neovascularization on OCT angiography (“medusa” vs “seafan”) was found to have no statistically significant correlation with the RPE detachment type on OCT (active vs inactive, P = .21); the presence of multilayered, highly organized material in the sub-RPE space ( P = .07); or the number of intravitreal anti-VEGF injections received before imaging ( P = .11). Furthermore, the morphologic pattern of the lesion was not found to have a statistically significant correlation with the presence of RPE atrophy ( P = .17).
Of the 18 eyes for which both baseline and follow-up OCT angiography were acquired, 11 (61%) had been treated with intravitreal aflibercept injections. Qualitative analysis showed attenuation of the finer capillary plexus in 4 eyes after anti-VEGF therapy, whereas the large vessels remained unchanged in all lesions. No statistically significant difference was found in lesion area or vessel density between baseline and follow up ( P = .94 and P = .83) for all eyes. The mean ± SD difference in lesion area was 0.01 ± 0.56 mm 2 for all eyes, and the mean ± SD difference in vessel density was 0 ± 7% ( Table 2 , Figures 5 and 6 ). For eyes that underwent interim intravitreal anti-VEGF treatment, the mean ± SD difference in lesion area was −0.02 ± 0.33 mm 2 , and the mean ± SD difference in vessel density was 3% ± 6%. For eyes that did not undergo intravitreal anti-VEGF injections, the mean ± SD difference in lesion area was 0.06 ± 0.84 mm 2 , and the mean ± SD difference in vessel density was −4% ± 4%.


