Purpose
To investigate changes in limbal basal epithelial cell density in eyes with limbal stem cell deficiency (LSCD) using in vivo confocal laser scanning microscopy.
Design
Retrospective observational comparative study.
Methods
A total of 43 eyes of 30 patients diagnosed with LSCD were included in the study. Ten eyes from normal subjects were included as control. Confocal imaging of the central cornea, and the superior, nasal, inferior and temporal limbus were collected using the Heidelberg Retina Tomograph III Rostock Corneal Module. Basal cell density in all locations was measured by 2 independent observers.
Results
The mean basal cell density of the normal group was 9264 ± 598 cells/mm 2 in the cornea and 7120 ± 362 cells/mm 2 in the limbus. In the LSCD group, the mean basal cell density in the cornea decreased 31.0% (6389 ± 1820 cells/mm 2 , P < .001) and in the limbus decreased 23.6% (5440 ± 1123 cells/mm 2 , P < .001) compared to that in the control. There was a trend of basal cell density decline in more advanced stages of LSCD. The basal cell density declined in the unaffected regions at a similar degree as that in the affected region in sectoral LSCD ( P > .05). The basal cell diameter increased by 24.6% in the cornea (14.7 μm) and by 15.7% in the limbus (15.5 μm) compared to the control.
Conclusions
Basal cell density in both central cornea and limbus decreases in LSCD. Limbal stem cells (LSCs) are affected globally and basal cell density could be used as a parameter to measure LSC function at the early stages of the disease process.
Limbal stem cells (LSCs) are responsible for the normal homeostasis and wound repair of the corneal epithelium. When there is an insufficient number of functional stem cells, a normal transparent corneal epithelial surface cannot be maintained and the eventual result is limbal stem cell deficiency (LSCD). There are multiple etiologies of LSCD, and the hallmark is invasion of the conjunctival epithelium on the cornea. Etiologies of LSCD include multiple surgeries, Stevens-Johnson syndrome, chemical injury, chronic contact lens wear, aniridia, and chronic keratitis. Common signs of LSCD are opacity and irregularity of epithelium, recurrent epithelial defects, and neovascularization. Common symptoms include photophobia, pain, redness, tearing, and decreased vision.
The limbus harbors LSCs, and the palisades of Vogt are thought to be a site of the LSC niche. Damage to the stem cell niche and its population impairs long-term regeneration of corneal epithelial cells, although acute injury to the cornea epithelium may be healed in the short term by existing corneal transient amplifying cells. Damage to the limbus also leads to the loss of the barrier that prevents invasion of the conjunctiva onto the ocular surface. Conjunctivalization of the corneal surface leads to significant visual loss and eventually to blindness.
The diagnosis of LSCD is mostly based on clinical presentation. Persistent epithelial defect due to impaired epithelial wound healing that resulted from an insufficient number of functional LSCs is one common presentation. Stippled fluorescein staining in a vortex pattern and late fluorescein staining are indicative of abnormal corneal epithelium or conjunctival epithelium, which are typical early signs of LSCD. However, these clinical signs are often subtle and are not pathognomonic. Impression cytology can detect the presence of conjunctival goblet cells on the corneal surface and thus confirms the diagnosis of LSCD. However, goblet cells might be absent from some patients with chemical burns, Stevens-Johnson syndrome, or topical medication toxicity from long-term glaucoma medications. Sensitivity of impression cytology is also low. A negative result does not necessary rule out LSCD.
In vivo laser scanning confocal microscopy has been used to understand the microstructural changes in normal and pathologic conditions including various epithelial diseases, and to investigate quantifiable parameters, such as density and size. On the basis of previous work, corneal basal cell density and subbasal nerve density were identified as potential parameters for the diagnosis of LSCD and for the characterization of the severity of LSCD. In the current study, we investigated whether limbal basal cell density is another parameter in assessing LSCD.
Methods
This observational, cross-sectional comparative study was approved by the Institutional Review Board at the University of California, Los Angeles. Each patient underwent a comprehensive eye examination, slit-lamp microscopy, and in vivo laser scanning confocal microscopy. Twenty-five eyes also underwent impression cytology after in vivo confocal microscopy. Ten eyes of normal subjects without ocular pathology by slit-lamp examination and without previous history of ocular disease were selected as the control group.
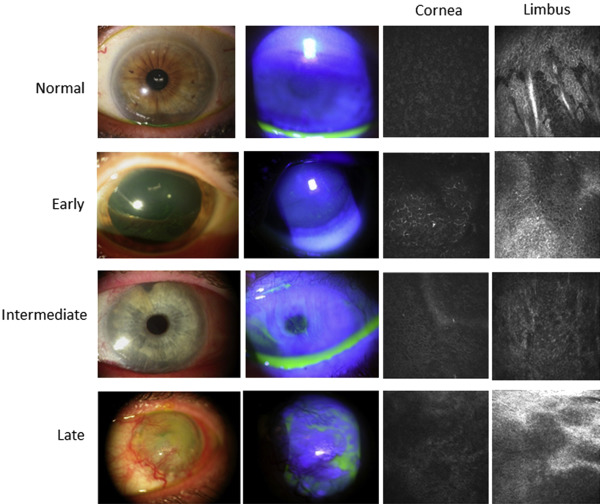
Based on the results of the slit-lamp examination and fluorescein staining, we characterized LSCD in the 43 affected eyes as early, intermediate, or late stage according to the criteria previously reported. Briefly, the early stage was characterized by stippling or late fluorescein staining; the intermediate stage was characterized by persistent, late fluorescein staining in a vortex pattern; and the late stage was characterized by the same vortex pattern of staining and a history of cornea epithelial defect or persistent epithelial defect. Representative slit-lamp photographs are shown in Figure 1 . Affected limbal and corneal areas were identified by the location of fluorescein staining observed during slit-lamp examination. Affected areas were then stratified into superior, nasal, inferior, and temporal limbal sections. Unaffected areas were determined as the limbal sections outside of the affected regions. Each patient’s chart was also reviewed to determine any underlying etiology and predisposing factors that led to LSCD.
Confocal Microscopy Analysis
Confocal images were taken by the Heidelberg Retina Tomograph III Rostock Corneal Module Confocal Microscope (Heidelberg Engineering GmBH, Dossenheim, Germany). A minimum of 3 scans of the central cornea and of the superior, nasal, inferior, and temporal limbus were collected. A minimum of 3 image frames of the corneal or limbal basal cell layer at each location were selected if the images clearly showed cellular morphology. Each image frame was 400 × 400 μm. Two independent, masked observers then proceeded to measure basal cell density in all 3 images as recommended by the manufacturer and as previously reported. Cell size was calculated by dividing the size of the area by the number of cells within this area. The average cell diameter was then derived from the calculated cell area.
Statistical Analysis
Statistical analyses were performed using SAS software version 9.4 (SAS, Inc, Cary, North Carolina, USA). Intraclass correlation coefficients were used to assess the reliability of density measurements obtained by 2 independent observers. Kruskal-Wallis tests and 2-tailed t tests were used for analysis when appropriate. Any P value less than .05 was considered to indicate statistical significance.
Results
Forty-three eyes of 30 patients diagnosed with LSCD from 2010 to 2014 were included in this study. Of those 30 patients with LSCD ( Supplemental Table 1 , available at AJO.com ), the mean age was 59.3 years (range, 24–94 years) for the LSCD group and 46.3 years (range, 27–88 years) for the control group ( P = .14). Twenty-two eyes in the LSCD group were of female patients and 21 were of male patients ( P = .38). The diagnosis of LSCD was confirmed in 11 eyes by impression cytology. The overall leading etiologies of LSCD were contact lens wear (32.6%) and multiple surgeries (27.9%).
Two independent observers performed the basal cell density measurements in a masked fashion. There was high agreement between the observers, with an intraclass correlation coefficient of 0.977 ( Supplemental Figure , available at AJO.com ). The mean basal cell density of the normal control group was 9264 ± 598 cells/mm 2 in the cornea and 7120 ± 362 cells/mm 2 in the limbus. The highest density was in the superior limbus (7458 ± 355 cells/mm 2 ), and lower densities were observed in the temporal limbus (7434 ± 653 cells/mm 2 ), the inferior limbus (7042 ± 775 cells/mm 2 ), and the nasal limbus (6782 ± 582 cells/mm 2 ). The mean basal cell density of the nasal limbus differed significantly from that of the superior limbus ( P = .031) and the temporal limbus ( P = .039). All other pairwise comparisons between limbal regions did not reveal significant differences ( Supplemental Table 2 , available at AJO.com ).
The mean basal cell density of the cornea (6389 ± 1820 cells/mm 2 ) was 31.0% lower in the LSCD group than in the control group ( P < .001; Figure 2 ). In addition, the mean basal cell density of all 4 limbal regions (5440 ± 1123 cells/mm 2 ) was 23.6% lower in the LSCD group than in the control group ( P < .001; Figure 2 ). Because contact lens wear was the leading cause of LSCD in our series, we compared basal cell density in contact lens wearers and non–contact lens wearers. There was no significant difference between the 2 groups in corneal basal cell density (6818 ± 1668 cells/mm 2 and 6068 ± 1845 cells/mm 2 , respectively; P = .22) or limbal basal cell density (5386 ± 690 cells/mm 2 and 5350 ± 1299 cells/mm 2 , respectively; P = .69). This result indicates that the decrease in basal cell density is a general phenomenon in LSCD and is not limited to the contact lens etiology.
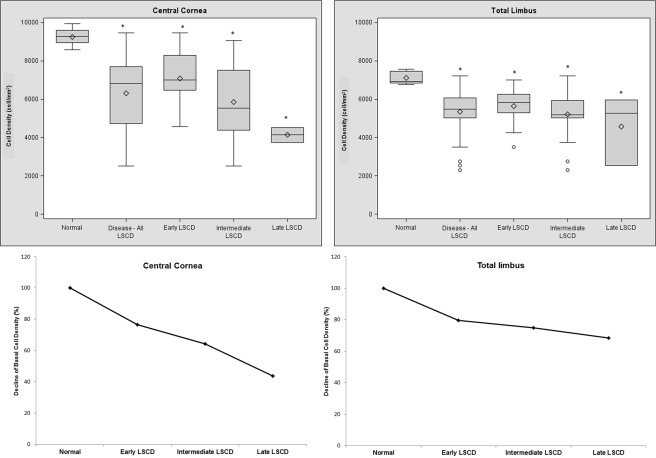
When the mean basal cell density of different stages of LSCD were compared, there was a trend toward a decrease in basal cell density in the cornea and limbal regions in more advanced disease. The mean basal cell density of the cornea was lower by 23.5% in the early stage, 35.6% in the intermediate stage, and 56.2% in the late stage. The differences in corneal basal cell density between respective stages were significant (for each comparison, P < .05). Compared with the mean basal cell density of all limbal regions in control subjects, the mean basal cell density of all 4 limbal regions of patients with LSCD was 20.5% lower in the early stage, 25.3% lower in the intermediate stage, and 31.7% lower in the late stage ( Figure 1 ). No significant differences in the mean limbal basal cell density were found among different stages.
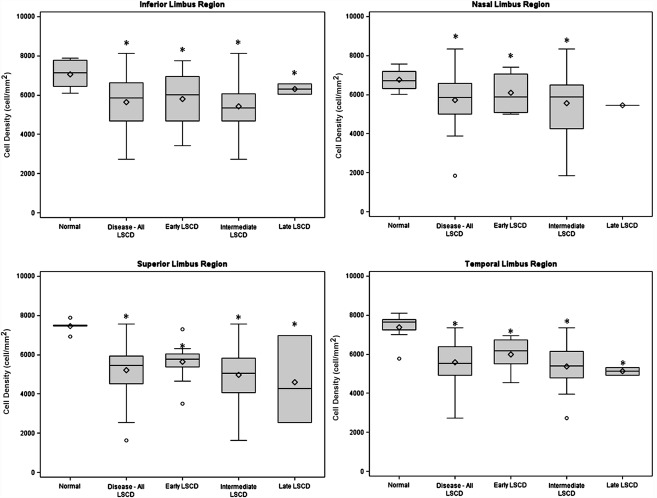
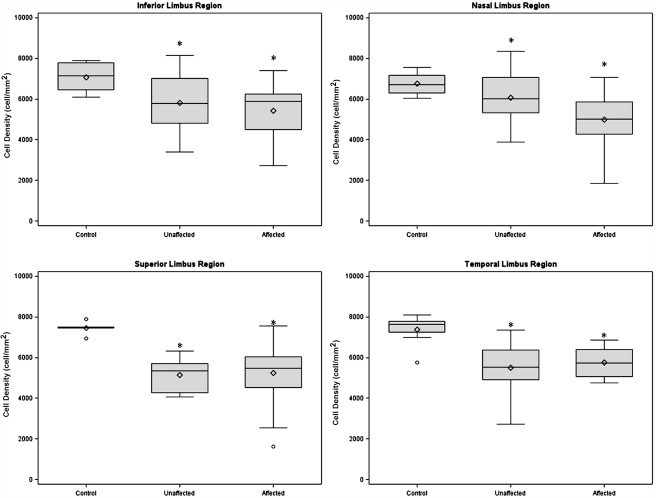
Significant decreases in densities were observed in all 4 limbal regions with LSCD when compared with those in the respective region in normal eyes (all P < .05, Figure 3 ). Additionally, we examined the basal cell density in limbal regions that appeared clinically unaffected by LSCD ( Supplemental Table 3 , available at AJO.com ). The mean basal cell density was also significantly decreased in the unaffected regions at a similar degree as in the affected regions (for each comparison, P < .05; Figure 4 ). The cell borders became indistinguishable in many of the eyes with late-stage LSCD; therefore, it was not feasible to reliably determine the cell density.
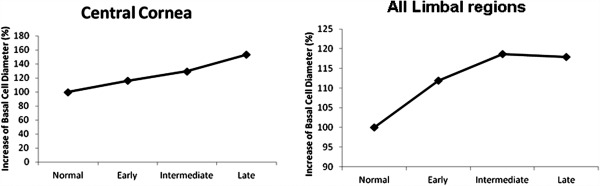
When cell density was converted to cell size, the mean cell diameters of the normal control group were 11.8 μm in the cornea and 13.4 μm in the limbus ( Supplemental Table 4 , available at AJO.com ). The cell diameter of the corneal and limbal basal cells increased in more advanced stages ( Figure 5 ).
Results
Forty-three eyes of 30 patients diagnosed with LSCD from 2010 to 2014 were included in this study. Of those 30 patients with LSCD ( Supplemental Table 1 , available at AJO.com ), the mean age was 59.3 years (range, 24–94 years) for the LSCD group and 46.3 years (range, 27–88 years) for the control group ( P = .14). Twenty-two eyes in the LSCD group were of female patients and 21 were of male patients ( P = .38). The diagnosis of LSCD was confirmed in 11 eyes by impression cytology. The overall leading etiologies of LSCD were contact lens wear (32.6%) and multiple surgeries (27.9%).
Two independent observers performed the basal cell density measurements in a masked fashion. There was high agreement between the observers, with an intraclass correlation coefficient of 0.977 ( Supplemental Figure , available at AJO.com ). The mean basal cell density of the normal control group was 9264 ± 598 cells/mm 2 in the cornea and 7120 ± 362 cells/mm 2 in the limbus. The highest density was in the superior limbus (7458 ± 355 cells/mm 2 ), and lower densities were observed in the temporal limbus (7434 ± 653 cells/mm 2 ), the inferior limbus (7042 ± 775 cells/mm 2 ), and the nasal limbus (6782 ± 582 cells/mm 2 ). The mean basal cell density of the nasal limbus differed significantly from that of the superior limbus ( P = .031) and the temporal limbus ( P = .039). All other pairwise comparisons between limbal regions did not reveal significant differences ( Supplemental Table 2 , available at AJO.com ).
The mean basal cell density of the cornea (6389 ± 1820 cells/mm 2 ) was 31.0% lower in the LSCD group than in the control group ( P < .001; Figure 2 ). In addition, the mean basal cell density of all 4 limbal regions (5440 ± 1123 cells/mm 2 ) was 23.6% lower in the LSCD group than in the control group ( P < .001; Figure 2 ). Because contact lens wear was the leading cause of LSCD in our series, we compared basal cell density in contact lens wearers and non–contact lens wearers. There was no significant difference between the 2 groups in corneal basal cell density (6818 ± 1668 cells/mm 2 and 6068 ± 1845 cells/mm 2 , respectively; P = .22) or limbal basal cell density (5386 ± 690 cells/mm 2 and 5350 ± 1299 cells/mm 2 , respectively; P = .69). This result indicates that the decrease in basal cell density is a general phenomenon in LSCD and is not limited to the contact lens etiology.
When the mean basal cell density of different stages of LSCD were compared, there was a trend toward a decrease in basal cell density in the cornea and limbal regions in more advanced disease. The mean basal cell density of the cornea was lower by 23.5% in the early stage, 35.6% in the intermediate stage, and 56.2% in the late stage. The differences in corneal basal cell density between respective stages were significant (for each comparison, P < .05). Compared with the mean basal cell density of all limbal regions in control subjects, the mean basal cell density of all 4 limbal regions of patients with LSCD was 20.5% lower in the early stage, 25.3% lower in the intermediate stage, and 31.7% lower in the late stage ( Figure 1 ). No significant differences in the mean limbal basal cell density were found among different stages.
Significant decreases in densities were observed in all 4 limbal regions with LSCD when compared with those in the respective region in normal eyes (all P < .05, Figure 3 ). Additionally, we examined the basal cell density in limbal regions that appeared clinically unaffected by LSCD ( Supplemental Table 3 , available at AJO.com ). The mean basal cell density was also significantly decreased in the unaffected regions at a similar degree as in the affected regions (for each comparison, P < .05; Figure 4 ). The cell borders became indistinguishable in many of the eyes with late-stage LSCD; therefore, it was not feasible to reliably determine the cell density.


