Purpose
To compare on-road driving performance of patients with moderate or advanced glaucoma to controls and evaluate factors associated with unsafe driving.
Design
Case-control pilot study.
Methods
A consecutive sample of 21 patients with bilateral moderate or advanced glaucoma from Washington University, St Louis, Missouri and 38 community-dwelling controls were enrolled. Participants, aged 55–90 years, underwent a comprehensive clinical evaluation by a trained occupational therapist and an on-road driving evaluation by a masked driver rehabilitation specialist. Overall driving performance of pass vs marginal/fail and number of wheel and/or brake interventions were recorded.
Results
Fifty-two percent of glaucoma participants scored a marginal/fail compared to 21% of controls (odds ratio [OR], 4.1; 95% CI, 1.30–13.14; P = .02). Glaucoma participants had a higher risk of wheel interventions than controls (OR, 4.67; 95% CI, 1.03–21.17; P = .046). There were no differences detected between glaucoma participants who scored a pass vs marginal/fail for visual field mean deviation of the better ( P = .62) or worse ( P = .88) eye, binocular distance ( P = .15) or near ( P = .23) visual acuity, contrast sensitivity ( P = .28), or glare ( P = .88). However, glaucoma participants with a marginal/fail score performed worse on Trail Making Tests A ( P = .03) and B ( P = .05), right-sided Jamar grip strength ( P = .02), Rapid Pace Walk ( P = .03), Braking Response Time ( P = .03), and identifying traffic signs ( P = .05).
Conclusions
Patients with bilateral moderate or advanced glaucoma are at risk for unsafe driving—particularly those with impairments on psychometric and mobility tests. A comprehensive clinical assessment and on-road driving evaluation is recommended to effectively evaluate driving safety of these patients.
Glaucoma patients, particularly those with more advanced disease, have a greater risk of a motor vehicle collision and of being at fault or injured in a motor vehicle collision than drivers without glaucoma. Many of these unsafe drivers pass state licensing examinations and continue to drive, possibly posing a significant public health risk and financial burden to society and themselves. Conversely, potentially safe drivers with glaucoma not meeting the state-mandated vision requirements for driving may be forced to relinquish their license and unduly suffer from the negative sequelae of driving cessation. A better understanding of factors associated with driving safety in glaucoma patients, particularly those with more advanced disease, is clearly needed.
An on-road driving assessment provides a valid, objective, and standardized method of assessing driving performance. Although it is considered the gold standard in driving assessment, relatively few on-road driving studies have been conducted in patients with glaucoma. To our knowledge, there are no studies that have comprehensively evaluated clinical factors and on-road driving performance in a high-risk sample of patients with bilateral moderate and advanced glaucoma. The purpose of this pilot study is to compare driving performance of patients with moderate or advanced glaucoma to age-matched controls using a validated on-road driving evaluation. This study also investigates the association between a comprehensive panel of vision and non-vision factors and unsafe driving.
Methods
This is a case-control pilot study in accordance with the Declaration of Helsinki and approved by the Human Research Protection Office at Washington University School of Medicine in St Louis, Missouri. A written informed consent was obtained from all eligible participants prior to study participation.
Participants
Patients, aged 55–90 years, with bilateral moderate or advanced glaucoma and age range–matched individuals with no ocular disease participated in this study. Glaucoma patients were recruited during their regularly scheduled clinic visits at Washington University School of Medicine. Individuals with no ocular disease were recruited from the volunteer database of healthy community-dwelling older adults maintained by Washington University Medical School and community centers and were screened for any major comorbidities. All participants completed their visits between March 31, 2010 and August 23, 2011.
Patients with glaucoma were determined based on glaucomatous optic nerve cupping and reproducible visual field defects on the Humphrey Visual Field (VF) Analyzer II (Carl Zeiss Meditec, Dublin, California, USA) equipped with the Swedish Interactive Threshold Algorithm (SITA) obtained within 6 months of the study. All glaucoma patients were required to have visual field defects in both eyes that met the criteria for the Glaucoma Staging System for stage 2 or worse (criteria including mean deviation of −6.01 or lower). Normal participants had no self-reported ocular disease. All study participants were required to be currently driving with a valid driver’s license, have a visual acuity of 20/70 or better in at least 1 eye in compliance with Missouri and Illinois licensure requirements for visual acuity, speak English, and have at least 10 years of driving experience.
Glaucoma patients and controls were excluded if they had a driving evaluation within 12 months prior to the study or comorbidities or conditions that may affect driving, including advanced cardiopulmonary disease, severe orthopedic or neuromuscular impairments, clinically diagnosed dementia, psychiatric illness, substance abuse, use of potentially sedating medications (eg, narcotics, anxiolytics), visually significant nonglaucomatous ocular conditions (eg, macular degeneration, cataracts), or neovascular, uveitic, or acute angle-closure glaucoma. Visually significant cataracts for the glaucoma patients were based on chart review and defined as the presence of a posterior subcapsular or nuclear sclerotic cataract graded 2 or greater. Glaucoma patients were excluded if they used a low vision driving aid or underwent ocular incisional surgery within 3 months prior to the study visit.
Study eligibility for glaucoma patients was determined by chart review of consecutive patients from selected glaucoma clinics. Potentially eligible patients were approached and, if currently driving, asked to participate. Individuals with no ocular disease (ie, controls) were contacted by telephone to confirm study eligibility. All potential participants underwent a telephone interview in which they were screened for dementia using the Alzheimer Disease-8 questionnaire and Short Blessed Test. Patients declining participation for the on-road driving study were asked the reason and later contacted for participation in the questionnaire-only part of the study.
Driving Evaluation
All consenting glaucoma patients and controls completed a comprehensive clinical assessment and an on-road driving evalution based at the DrivingConnections outpatient clinic located in The Rehabilitation Institute of St Louis at Washington University Medical Center. Clinical assessments were conducted on the same day and just prior to the on-road evaluation.
Clinical Assessments
The clinical assessments took approximately 90 minutes to complete and were administered by a registered occupational therapist who was not masked to the vision status of the participant. The following measures, except for visual field testing, were administered by the occuptional therapist in the DrivingConnections clinic:
Vision : All vision measures were assessed with the participant’s normal corrective lenses. Monocular and binocular distance and near visual acuity (VA) were measured with the Early Treatment Diabetic Retinopathy Study and Sloan near VA tests, respectively, and recorded with per-letter scoring. Contrast sensitivity (CS) and glare testing were measured binocularly with per-letter scoring using the Pelli-Robson CS chart and the Vector Vision chart, respectively. Visual field tests were conducted by trained ophthalmic technicians in the eye clinic using standard automated perimetry (Humphrey VF 24-2 with SITA standard program). Mean deviation (MD) was used as the main global index of visual field impairment. Two glaucoma participants (n = 3 eyes) completed Goldmann VF tests for their most recent visit; therefore, the mean deviation of their last Humphrey VF test (obtained within 1 year prior to the study visit) was recorded. Two participants (n = 2 eyes) were unable to perform a VF test in their worse eye owing to poor vision and were assigned a −30 decibel MD value.
Psychometrics : The Short Blessed Test was administered to screen for cognitive impairment and the Clock Drawing Test and the Snellgrove Maze Task measured executive function and visuospatial abilities. Additional assessments included Trail Making Test A (attention, psychomotor speed, and visual scanning) and B (alternating attention and executive function). Two subtests from the DrivingHealth Inventory were administered: Subtest 2 of the Useful Field of View (divided visual attention, visual memory, and processing speed) and the Motor-Free Visual Perceptual Test (visual closure). For all psychometric tests, except for the Clock Drawing Test, higher scores indicate greater impairment.
Mobility : Standard goniometric techniques were used to measure cervical range of motion. The Jamar grip dynamometer measured grip strength for each hand in pounds, averaging the sum of 3 trials. Motor speed and coordination were evaluated in seconds using the 9-Hole Peg Test and the Rapid Pace Walk. The Braking Response Time Monitor measured brake reaction time of the right lower extremity.
Medical and driving questionnaires : Additional assessments included the Geriatric Depression Scale, the Epworth Sleepiness Scale, a written driving test and road sign recognition test (ie, sign name and function), and the Driving Habits Questionnaire. In order to assess the potential effect of familiarity of the driving course on driving performance, participants were grouped as “familiar with driving area” if their zip code of residence was within or adjacent to the zip code of the on-road driving course.
On-road Driving Evaluation
Modified Washington University Road Test : The road test, a modified version of the valid and reliable Washington University Road Test, has been used in prior studies. It is a 13-mile on-road driving test conducted in a predetermined area in St Louis. The course takes approximately 50–60 minutes to complete and consists of 14 right-hand turns, 11 left-hand turns, 33 traffic lights, and 10 stop signs in low and high traffic areas. All tests were conducted in the same, standard sedan (Chevrolet Impala) equipped with dual brakes. Tests were scheduled during weekdays between 11 AM and 4 PM and were not performed in inclement weather such as severe rain, snow, or icy road conditions.
The driving instructor, a certified driver rehabilitation specialist with over 5 years of experience, sat in the passenger seat and provided directional assistance and safety monitoring. The driving evaluator, a driver rehabilitation specialist with over 15 years of experience of on-road driving evaluations, sat in the back seat and rated the participant’s driving performance. The driving evaluator was masked to the participant’s vision status and performance on the clinical assessments, while the driving instructor was not masked owing to safety precautions. The same driving instructor and evaluator performed all on-road evaluations and were different from the evaluators in the clinic.
Outcome measures : Overall driving performance was scored as pass, marginal, or fail. A pass score indicated no safety concern, a marginal score indicated low to moderate safety concern (eg, rolling a stop sign), and a fail indicated major safety concern (eg, failing to yield to a pedestrian). In order to capture at-risk driving we combined participants that received a marginal or fail score into 1 group (ie, marginal/fail group). The number of wheel and brake interventions required by the driving instructor to prevent a potentially unsafe situation was also recorded.
Questionnaire-only Study
To address potential selection bias in the glaucoma group undergoing the on-road assessment, glaucoma patients declining the on-road study were asked to partake in a questionnaire-only study. Patients agreeing were contacted by phone and completed the Short Blessed Test, Geriatric Depression Scale, and Driving Habits Questionnaire. Demographic data, ocular and systemic comorbidities, and medications were obtained by phone interview and confirmed by medical chart review.
Data Analysis
Descriptive statistics were reported for demographic data, clinical assessments, and driving performance. Comparisons between the control and glaucoma groups were made using Kruskal-Wallis tests for continuous outcomes and χ 2 tests for categorical outcomes. Univariate, unadjusted logistic regression models were used to estimate the association between predictors and driving performance. Driving performance was dichotomized as pass or marginal/fail. Odds ratios were used to express the magnitude of the association between predictors and driving performance. Univariate, unadjusted logistic regression models were used to identify potential candidate variables using P < .10 as the selection criteria for inclusion in multivariate prediction models. The final regression model for overall driving performance retained variables with an adjusted P value of <.05. All data analyses were performed using SAS version 9.3 (SAS Inc, Cary, North Carolina, USA).
Results
A total of 132 patients with glaucoma met criteria for study participation through medical chart review. After further interview, 40% (53 of 132) of patients were not currently driving and were thus excluded. Of the 79 eligible patients, 58 (73%) declined or later withdrew from the study owing to stated reasons of scheduling issues (n = 14), concern of driving environment (n = 12), fear of losing license (n = 7), lack of interest (n = 9), distance from home (n = 8), or no reason provided (n = 8). Twenty-one glaucoma patients (27% of those eligible) and 38 controls completed both the clinical and on-road driving assessments.
There were no statistically significant differences in baseline demographics between the control and glaucoma groups ( Table 1 ). Compared to controls, the glaucoma group performed significantly worse on contrast sensitivity ( P < .001), Snellgrove Maze Task ( P = .002), Trail Making Tests A ( P = .009) and B ( P = .02), and the Useful Field of View ( P = .004).
| Characteristic | Controls (n = 38) | Glaucoma (n = 21) | P Value |
|---|---|---|---|
| Demographics | |||
| Age, mean (SD), y | 70.2 (8.4) | 71.5 (8.5) | .56 |
| Women, % | 47.4 | 28.6 | .16 |
| White, % | 50.0 | 47.6 | .86 |
| Married, % | 47.4 | 71.4 | .07 |
| Years of education, mean (SD) | 15.0 (3.3) | 14.4 (2.4) | .55 |
| Medical | |||
| Number of comorbidities, mean (SD) | 1.9 (1.4) | 2.2 (1.6) | .48 |
| Geriatric Depression Scale, mean (SD) | 0.4 (0.8) | 0.5 (0.8) | .77 |
| Epworth Sleepiness Scale, mean (SD) | 5.0 (2.5) | 5.8 (3.6) | .42 |
| Vision | |||
| ETDRS distance visual acuity, mean (SD) | |||
| Better eye | 53.3 (4.7) | 51.4 (6.0) | .16 |
| Worse eye | 43.7 (10.9) | 35.7 (19.6) | .22 |
| Binocular | 55.1 (4.8) | 52.4 (6.5) | .06 |
| Sloan near visual acuity, mean (SD) | |||
| Better eye | 64.8 (6.9) | 61.6 (7.1) | .08 |
| Worse eye | 54.7 (12.5) | 46.4 (20.7) | .33 |
| Binocular | 64.4 (10.4) | 64.9 (6.6) | .95 |
| Binocular contrast sensitivity, logCS (SD) | 1.7 (0.2) | 1.4 (0.2) | <.0001 |
| Binocular glare, Cd/m 2 (SD) | 108.1 (54.1) | 98.1 (59.2) | .38 |
| Psychometrics | |||
| Short Blessed Test, mean (SD) | 1.8 (2.3) | 2.4 (2.9) | .47 |
| Clock Drawing Test, Freund score, mean (SD) | 6.5 (1.0) | 6.3 (0.9) | .25 |
| Snellgrove Maze Task completion, mean (SD), s | 35.2 (11.6) | 48.1 (18.9) | .002 |
| Trail Making Test A, mean (SD), s | 43.5 (14.6) | 61.9 (27.7) | .009 |
| Trail Making Test B, mean (SD), s | 115.4 (51.3) | 160.5 (77.5) | .02 |
| Useful Field of View, mean (SD), ms | 180.5 (106.7) | 298.9 (143.1) | .004 |
| Motor-Free Visual Perception Test, mean (SD), no. incorrect | 2.2 (1.6) | 2.1 (1.8) | .67 |
| Mobility | |||
| Cervical range of motion, mean (SD), degree | |||
| Right | 61.0 (10.5) | 61.2 (7.3) | .49 |
| Left | 61.8 (11.5) | 63.0 (7.3) | .75 |
| Jamar grip strength, mean (SD), lb | |||
| Right | 56.6 (23.3) | 62.2 (15.9) | .28 |
| Left | 54.3 (23.0) | 59.7 (14.6) | .26 |
| Nine-Hole Peg Test, mean (SD), s | |||
| Right | 22.7 (3.5) | 24.7 (5.8) | .31 |
| Left | 23.4 (2.8) | 24.6 (4.0) | .29 |
| Rapid Pace Walk, mean (SD), s | 6.0 (1.5) | 6.4 (1.9) | .46 |
| Braking Response Time, mean (SD), s | 0.6 (0.1) | 0.6 (0.1) | .69 |
| Driving experience and knowledge | |||
| Familiar with driving area, % | 18.4 | 23.8 | .62 |
| Miles driven per day, mean (SD), mi | 23.7 (19.4) | 22.3 (18.8) | .72 |
| Written driving test, mean (SD), no. correct | 11.2 (1.7) | 10.9 (1.8) | .52 |
| Sign names, mean (SD), no. correct | 9.2 (2.2) | 9.6 (2.3) | .38 |
| Sign function, mean (SD), no. correct | 9.6 (2.0) | 9.8 (2.2) | .61 |
Fifty-two percent (11 of 21) of glaucoma participants received a marginal/fail score on the on-road driving evaluation, compared to 21% (8 of 38) of controls ( P = .02, Figure ). Glaucoma participants were 4.13 times more likely to score a marginal/fail than controls (95% CI, 1.30–13.14; P = .02). A higher proportion of glaucoma participants required ≥1 wheel intervention compared to controls (29% vs 8%, P = .03) with a 4.7 times greater risk (95% CI, 1.03–21.17; P = .046). Although a higher proportion of glaucoma participants required ≥1 brake intervention compared to controls (14% vs 8%), no statistically significant difference was detected (odds ratio [OR] 1.94; 95% CI, 0.36–10.63; P = .44).
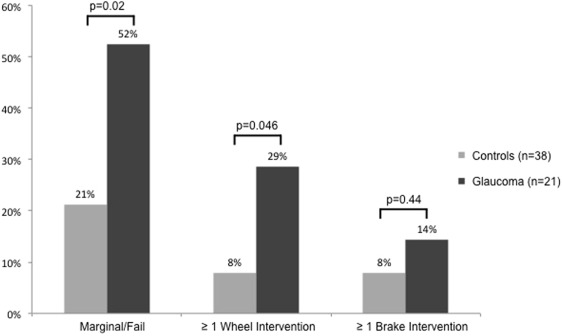
Table 2 compares baseline characteristics and clinical assessments of participants who passed to those with a marginal/fail score. In the total sample, participants with a marginal/fail score were older (OR, 3.41 per decade; 95% CI, 1.46–7.96; P = .005), more likely to be white (OR, 3.25; 95% CI, 1.02–10.32; P = .046), have a diagnosis of glaucoma (OR, 4.13; 95% CI, 1.30–13.14; P = .02), and performed worse on contrast sensitivity (OR, 0.73 per tenth logCS; 95% CI, 0.55–0.97; P = .03), Snellgrove Maze Task (OR, 1.45 per 10 seconds; 95% CI, 1.00–2.11; P = .048), Trail Making Tests A (OR, 1.82 per 10 seconds; 95% CI, 1.26–2.62; P = .001) and B (OR, 1.26 per 25 seconds; 95% CI, 1.01–1.56; P = .04), right-sided 9-Hole Peg Test (OR, 2.35 per 5 seconds; 95% CI, 1.12–4.95; P = .02), Rapid Pace Walk (OR, 1.46 per second; 95% CI, 1.00–2.12; P = .048), and recognizing sign functions (OR, 0.73; 95% CI, 0.55–0.96; P = .03). In the final model for the total sample, performance on Trail Making Test A was significantly associated with a marginal/fail score ( P = .001). There was a strong correlation between Trails A and contrast sensitivity (r = −0.54, P < .001), EDTRS (r = −0.47, P = .0002), and near visual acuity (r = 0.29, P = .02).
| Characteristic | All Participants | Glaucoma Participants | ||||
|---|---|---|---|---|---|---|
| Pass (n = 40) | Marginal/Fail (n = 19) | P Value | Pass (n = 10) | Marginal/Fail (n = 11) | P Value | |
| Demographic | ||||||
| Age, mean (SD), y | 68.3 (7.6) | 75.5 (8.0) | .005 | 67.2 (5.7) | 75.4 (8.9) | .045 |
| Women, % | 37.5 | 47.4 | .47 | 10.0 | 45.5 | .097 |
| White, % | 40.0 | 68.4 | .046 | 50.0 | 45.5 | .84 |
| Married, % | 62.5 | 42.1 | .14 | 100.0 | 45.5 | .01 |
| Years of education, mean (SD) | 14.8 (3.3) | 14.7 (2.4) | .90 | 15.0 (3.0) | 13.9 (1.8) | .31 |
| Medical | ||||||
| Glaucoma (%) | 25.0 | 57.9 | .02 | 100.0 | 100.0 | — |
| Pseudophakia in at least 1 eye (%) | — | — | — | 30.0 | 81.8 | .02 |
| Comorbidities, mean (SD), no. | 2.0 (1.3) | 1.9 (1.7) | .84 | 2.3 (1.3) | 2.1 (1.9) | .76 |
| Geriatric Depression Score, mean (SD) | 0.3 (0.6) | 0.6 (1.1) | .29 | 0.2 (0.4) | 0.7 (1.1) | .21 |
| Epworth Sleepiness Score, mean (SD) | 5.5 (2.9) | 4.9 (3.0) | .48 | 6.1 (3.8) | 5.5 (3.5) | .72 |
| Vision | ||||||
| ETDRS distance visual acuity, mean (SD) | ||||||
| Better eye | 53.3 (4.7) | 51.2 (6.2) | .15 | 53.6 (5.1) | 49.5 (6.3) | .13 |
| Worse eye | 42.3 (13.4) | 38.0 (17.8) | .31 | 39.0 (19.3) | 32.7 (20.3) | .46 |
| Binocular | 54.9 (5.4) | 52.4 (5.6) | .11 | 54.7 (6.6) | 50.4 (6.0) | .15 |
| Sloan near visual acuity, mean (SD) | ||||||
| Better eye | 63.8 (7.2) | 63.5 (7.0) | .89 | 60.7 (7.0) | 62.5 (7.5) | .57 |
| Worse eye | 53.4 (14.4) | 48.3 (19.6) | .27 | 49.4 (16.9) | 43.7 (24.1) | .52 |
| Binocular | 64.7 (10.1) | 64.2 (7.0) | .82 | 66.7 (4.8) | 63.2 (7.6) | .23 |
| Binocular contrast sensitivity, logCS (SD) | 1.7 (0.2) | 1.5 (0.3) | .03 | 1.5 (0.2) | 1.4 (0.2) | .28 |
| Binocular glare, Cd/m 2 (SD) | 111.8 (52.1) | 89.3 (61.2) | .15 | 100.2 (49.8) | 96.3 (69.1) | .88 |
| Humphrey Visual Field mean deviation, mean (SD) | ||||||
| Better eye | — | — | — | −12.1 (5.7) | −13.4 (6.7) | .62 |
| Worse eye | — | — | — | −21.2 (5.1) | −21.6 (5.5) | .88 |
| Psychometrics | ||||||
| Short Blessed Test, mean (SD) | 1.9 (2.7) | 2.4 (2.3) | .29 | 1.9 (3.3) | 2.9 (2.4) | .42 |
| Clock Drawing Test, Freund score, mean (SD) | 6.5 (0.8) | 6.3 (1.2) | .38 | 6.5 (0.5) | 6.2 (1.2) | .44 |
| Snellgrove Maze Task completion, mean (SD), s | 36.8 (12.3) | 46.0 (20.3) | .048 | 39.2 (12.2) | 56.2 (20.6) | .07 |
| Trail Making Test A, mean (SD), s | 42.5 (12.5) | 65.8 (28.6) | .001 | 41.8 (10.6) | 80.1 (25.8) | .03 |
| Trail Making Test B, mean (SD), s | 119.0 (48.6) | 157.7 (86.1) | .04 | 122.5 (42.4) | 195.1 (87.3) | .051 |
| Useful field of view, mean (SD), ms | 206.0 (124.2) | 273.9 (148.4) | .10 | 259.0 (148.4) | 338.8 (133.0) | .21 |
| Motor-Free Visual Perception Test, no. incorrect, mean (SD) | 2.3 (1.8) | 1.6 (1.1) | .16 | 2.3 (2.3) | 1.8 (1.1) | .52 |
| Mobility | ||||||
| Cervical range of motion, mean (SD), degree | ||||||
| Right | 61.4 (9.2) | 60.4 (10.0) | .69 | 60.3 (5.6) | 62.0 (8.8) | .59 |
| Left | 62.1 (10.8) | 62.6 (9.0) | .86 | 63.3 (8.2) | 62.7 (6.9) | .86 |
| Jamar grip strength, mean (SD), lb | ||||||
| Right | 62.2 (21.5) | 50.9 (18.0) | .06 | 73.0 (9.5) | 52.3 (14.2) | .02 |
| Left | 58.2 (21.2) | 52.0 (18.5) | .28 | 66.0 (11.7) | 53.9 (15.0) | .08 |
| Nine-Hole Peg Test, mean (SD), s | ||||||
| Right | 22.4 (3.6) | 25.6 (5.6) | .02 | 22.2 (4.4) | 27.0 (6.2) | .09 |
| Left | 23.5 (2.8) | 24.6 (4.1) | .24 | 23.4 (3.1) | 25.7 (4.5) | .21 |
| Rapid Pace Walk, mean (SD), s | 5.8 (1.5) | 6.8 (1.8) | .048 | 5.3 (1.3) | 7.4 (1.8) | .03 |
| Braking Response Time, mean (SD), s | 0.6 (0.1) | 0.6 (0.1) | .07 | 0.5 (0.1) | 0.7 (0.1) | .03 |
| Driving experience and knowledge | ||||||
| Familiar with driving area, % | 22.5 | 15.8 | .55 | 30.0 | 18.2 | .53 |
| Miles driven per day, mean (SD), min | 26.3 (21.9) | 16.9 (9.0) | .09 | 28.7 (25.1) | 17.0 (10.0) | .19 |
| Written driving test, mean (SD), no. correct | 11.3 (1.6) | 10.6 (1.8) | .17 | 11.5 (1.6) | 10.3 (1.8) | .13 |
| Sign names, mean (SD), no. correct | 9.7 (2.0) | 8.6 (2.4) | .07 | 10.8 (1.0) | 8.5 (2.6) | .048 |
| Sign function, mean (SD), no. correct | 10.1 (1.8) | 8.8 (2.3) | .03 | 10.9 (1.3) | 8.7 (2.5) | .06 |
Stay updated, free articles. Join our Telegram channel

Full access? Get Clinical Tree


