Purpose
To establish a normative database of peripapillary retinal nerve fiber layer (RNFL) thickness, macular thickness, and retinal layer thickness in healthy North American children, using spectral-domain optical coherence tomography (SD OCT).
Design
Prospective cross-sectional study.
Methods
This institutional study enrolled 83 healthy children (aged 5-15 years) as volunteer research subjects at the Retina Foundation of the Southwest (Dallas, Texas); all had normal visual acuity. Imaging was accomplished with the Spectralis SD OCT. Peripapillary RNFL thickness and macular thickness were assessed for 1 eye of each child using the Heidelberg Spectralis SD OCT software. Thicknesses of individual retinal layers and layer combinations were assessed using custom software to segment the line scans obtained with the Spectralis SD OCT.
Results
Average global peripapillary RNFL thickness was 107.6 ± 1.2 μm and average central subfield macular thickness was 271.2 ± 2.0 μm. Peripapillary RNFL thickness was thicker than has been reported in adults, particularly the superior and inferior sectors, and central subfield macular thickness was significantly correlated with age. While the thickness of most retinal layers was comparable with those of adults, the outer segment layer was 36% thinner in children than in adults.
Conclusions
SD OCT can be used to assess peripapillary RNFL thickness, macular thickness, and retinal layer thickness in children as young as 5 years. Pediatric means and normative reference ranges are provided for each measurement. The values presented herein can be used as a standard with which to compare those of children suspected of having retinal or optic nerve abnormalities.
Optical coherence tomography (OCT) is a noncontact medical imaging technology similar to x-ray imaging and magnetic resonance imaging (MRI). Simply stated, OCT uses reflected light to produce a detailed, cross-sectional image of the eye. Image capture is noninvasive, fast, and painless.
Time-domain (TD) OCT was first used in 1991 to visualize the eye. Although useful, images obtained using TD-OCT were 2-dimensional, image acquisition time was slow, and the axial resolution of the devices prohibited detailed analyses of retinal structure. In 2004, spectral-domain (SD) OCT (also commonly referred to as Fourier-domain [FD] OCT) entered clinical practice. The generation of 3-dimensional images, increased speed of image acquisition, and increased axial resolution are 3 of the major advancements seen in the SD OCT devices used today. Having axial resolution between 1 and 5 μm, the newest SD OCT devices provide detailed measurements of the retinal nerve fiber layer (RNFL) and the macula. The images obtained from the newest SD OCT devices are of sufficient resolution to permit segmentation and measurement of individual retinal layers using computer-assisted programs.
Quantitative SD OCT is increasingly being used to detect eye disease, monitor changes in the progression of eye disease, and assess the efficacy of current and novel treatments for eye diseases in pediatric patients. For adult patients, SD OCT devices routinely compare the results obtained to a normative reference range, allowing for automatic detection of abnormalities. Unfortunately, as is the case with the Spectralis SD OCT (Heidelberg Engineering, Vista, California, USA) used in this study, the norms provided by SD OCT devices are for individuals 18 years of age and older. There are no internal standards with which to compare the results obtained in children.
Recently, Turk and associates used the Spectralis SD OCT to assess macular thickness, macular volume, and RNFL thickness in a cohort of 107 6- to 16-year-old Turkish children. We want to expand upon this study in 2 ways: (1) we want to compile a normative database of North American children, including children of more diverse racial and ethnic backgrounds; and (2) we want to provide reference ranges for retinal layer thicknesses from the SD OCT images in order to broaden the scope of the normative database. Normative data for individual retinal layers segmented in SD OCT images may be useful in the differential diagnosis and management of vitreoretinal dystrophies and optic nerve disease, and can be useful in guiding molecular genetic testing.
Methods
This prospective cross-sectional study and data accumulation were approved by the Institutional Review Board of the University of Texas Southwestern Medical Center (Dallas, Texas, USA). All data were collected at the Retina Foundation of the Southwest (Dallas, Texas, USA). Informed consent to participate in the research study was obtained from a parent or legal guardian. Assent was obtained from subjects between the ages of 10 and 15 years. The Retina Foundation of the Southwest complies with HIPAA regulations.
Subjects
A total of 83 healthy North American children (aged 5-15 years) were enrolled in this study. All children were seen at the Retina Foundation of the Southwest in Dallas, Texas. Children were included in this study if they were born at term (≥ 37 weeks postconception) and had best-corrected visual acuity of −0.10 to 0.20 logMAR, normal stereoacuity, no ocular abnormalities, no developmental delay, and no family history of retinal or optic nerve diseases or glaucoma. Of the 83 children, 45 were male and 38 were female; 3 were 5 years old, 10 were 6 years old, 13 were 7 years old, 12 were 8 years old, 13 were 9 years old, 6 were 10 years old, 10 were 11 years old, 6 were 12 years old, 4 were 13 years old, 4 were 14 years old, and 2 were 15 years old; 57 were non-Hispanic white, 5 were African American, 7 were Hispanic, 6 were Asian, 6 were more than 1 race/ethnicity, and 2 were not reported.
Spectral-Domain OCT Imaging
SD OCT imaging was accomplished with the Spectralis SD OCT (Heidelberg Engineering), using the automatic real-time (ART) eye tracker to eliminate motion artifacts. All children had pupil sizes larger than 3 mm, precluding the need for dilation. For each child, 3-5 high-resolution horizontal line scans (9 mm) and 2-3 high-density volume scans (5.9 × 4.4 mm or 8.6 × 7.2 mm, composed of 19 or 31 B-scans, respectively) were obtained from the macular region of the right eye. Based on quality scores, 1 9-mm horizontal foveal scan image and 1 volume scan image were chosen for analysis. Quality scores for scans are assigned by the Spectralis and expressed as a signal-to-noise ratio (SNR) in decibels (dB). Scans above 20 dB are considered high-quality. The average SNR value for the line scans reported in this manuscript were 33.5 ± 5.9 dB (mean ± standard deviation). The average SNR value for the volume scans reported in this manuscript was 29.6 ± 7.3 dB.
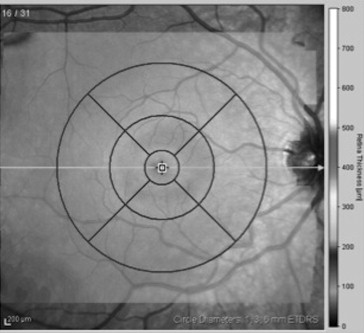
Results obtained from the high-speed volume scans of the macula were classified by region, as shown in Figure 1 . The retinal thickness map was used to determine the numeric averages of thickness for 5 subfields within the Early Treatment Diabetic Retinopathy Study grid. Because some of the children had volume scans that did not fill the entire template, we determined the average thickness within the 1-mm-diameter central foveal subfield (CFS) and the average thicknesses within the nasal, temporal, superior, and inferior segments of the 3-mm-diameter annulus.
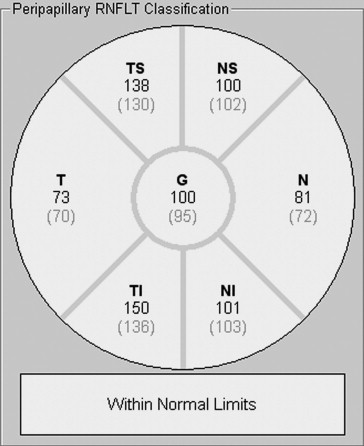
Two or 3 high-speed peripapillary RNFL circle scans (circle scan size: 3.5 mm) were also obtained. Based on quality (average SNR values were 29.8 ± 6.9 dB), 1 RNFL image was chosen for analysis. The peripapillary RNFL thickness measurements (μm) were automatically calculated by the Spectralis SD OCT, and provided a global average (G) and the average thickness for each of 6 sectors ( Figure 2 ): temporal (T), temporal-superior (TS), temporal-inferior (TI), nasal (N), nasal-superior (NS), nasal-inferior (NI).
Retinal Segmentation
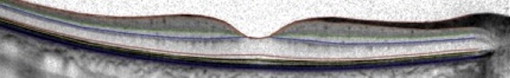
High-resolution horizontal line scans were segmented using a custom-designed program built in IGOR Pro (IGOR Pro 6.12; WaveMetrics Inc, Lake Oswego, Oregon, USA). This program was used to profile and measure the thickness of individual retinal layers and layer combinations ( Figure 3 ). The segmentation approach is comparable to the software developed by Hood and associates (MATLAB based; MathWorks, Natick, Massachusetts, USA). The following layer and layer combination thicknesses were measured: total retinal thickness (TR), retinal nerve fiber layer (RNFL), retinal ganglion cell layer (RGC)+ (GCL + inner plexiform layer), inner nuclear layer (INL), outer nuclear layer (ONL), photoreceptor inner segments (IS), photoreceptor outer segments (OS), retinal pigment epithelium + Bruch membrane (RPE), OS+ (OS + RPE), and receptors (REC)+ (outer plexiform layer + ONL + IS + OS + RPE). Layer thicknesses from the segmented images were sampled at the center of the fovea (foveola) and at ±2 mm from the center of the fovea (outside the rim of the foveal pit).
Two individuals (S.E.Y., C.S.P.) independently marked retinal layer boundaries after a training period during which they discussed the boundaries of a sample set of scans with an experienced segmenter (Y.W.). It has been shown that after a training period, between-segmenter reliability is quite good. The mean (range) of the concordance correlation coefficients for each retinal segmentation measurement was 0.9967 (0.9957-0.9975). The results of the 2 graders were averaged.
Statistical Analysis
Statistical analyses were performed using MedCalc Software version 12.2.1 (Medcalc, Mariakerke, Belgium). Two-way analysis of variance (ANOVA) was used to examine the effects of sex and race/ethnicity (non-Hispanic white vs other race/ethnicity) on measured thicknesses. The effect of age on measured thicknesses was assessed using linear regression.
Results
Macular Thickness
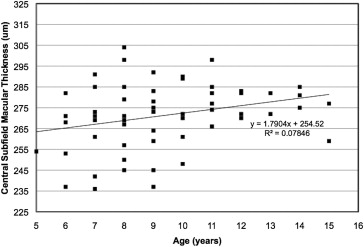
The average macular thickness values for the 1-mm-diameter central foveal subfield and for each segment of the 3-mm-diameter circle are shown in Table 1 . There were no significant effects of sex ( P = .134) or race/ethnicity ( P = .177) on central foveal subfield thickness. However, linear regression analysis demonstrated a significant increase in central foveal subfield thickness with age ( P = .032; Figure 4 ).
| Circle Diameter | Sector | All (n = 83) | Male (n = 45) | Female (n = 38) | NHW (n = 57) | Other b (n = 26) |
|---|---|---|---|---|---|---|
| 1 mm | CSF | 271.2 (2.0) | 274.1 (2.5) | 267 (3.3) | 274.1 (2.3) | 263.1 (3.8) |
| 3 mm | N | 334.9 (2.2) | 340.4 (2.1) | 326.8 (3.9) | 335.3 (2.6) | 332.0 (4.0) |
| T | 331.8 (1.7) | 335. 9 (1.8) | 326.0 (2.9) | 331.3 (1.7) | 331.9 (4.2) | |
| S | 346.6 (1.7) | 349.3 (1.8) | 342.8 (3.0) | 345.6 (1.8) | 348.7 (3.9) | |
| I | 333.4 (2.1) | 338.4 (2.1) | 326.2 (3.8) | 334.0 (2.2) | 330.3 (5.1) |
a Values (μm) are means (± SEM).
b Other = black, Hispanic, Asian, and individuals of more than 1 race.
Peripapillary RNFL Thickness
The average peripapillary RNFL thickness values for each sector of the circular scan are shown in Table 2 . Peripapillary RNFL thickness was greatest in the superior and inferior segments and thinner in the nasal and temporal segments. There were no significant effects of sex ( P = .951) or race/ethnicity ( P = .053) on global peripapillary RNFL thickness. Linear regression analysis failed to demonstrate any change in global peripapillary RNFL thickness by age ( P = .702).
| Sector | All (n = 83) | Male (n = 45) | Female (n = 38) | NHW (n = 57) | Other b (n = 26) |
|---|---|---|---|---|---|
| Global | 107.6 (1.2) | 107.7 (1.6) | 107.4 (1.7) | 105.3 (1.4) | 112.9 (2.0) |
| T | 76.5 (1.9) | 76.1 (2.8) | 77.0 (2.6) | 74.2 (1.9) | 84.7 (3.5) |
| TS | 145.1 (2.2) | 146.5 (2.9) | 143.5 (3.2) | 141.8 (2.5) | 152.5 (4.0) |
| TI | 147.0 (2.1) | 145.2 (2.9) | 149.0 (3.2) | 142.2 (2.1) | 157.6 (4.8) |
| N | 84.5 (1.9) | 84.9 (2.9) | 84.1 (2.3) | 84.8 (2.1) | 84.1 (4.2) |
| NS | 116.2 (2.8) | 117.7 (3.4) | 114.5 (4.5) | 114.5 (3.1) | 121.0 (6.1) |
| NI | 125.4 (3.0) | 124.7 (4.4) | 126.2 (4.0) | 122.2 (3.5) | 131.6 (5.7) |
a Values (μm) are means (± SEM).
b Other = black, Hispanic, Asian, and individuals of more than 1 race.
Retinal Layer Thickness
Table 3 summarizes the segmented retinal layer thicknesses at the foveola and ±2 mm from the foveal center. There were no significant effects of sex ( P = .808) or race/ethnicity ( P = .458) on total retinal thickness at the fovea. Linear regression analysis failed to demonstrate any change in total retinal thickness at the foveola by age ( P = .413). Both outer segment and inner segment layers were significantly thicker in the fovea than at ±2 mm from the foveal center ( P < .0001 and P < .001, respectively). As expected, inner retinal layers were not measurable at the fovea and the RNFL was thicker in the nasal than in the temporal retina.
| Layer b | Center of Fovea c | 2 mm Nasal | 2 mm Temporal |
|---|---|---|---|
| TR | 219.6 (1.7) | 329.2 (2.3) | 298.3 (1.9) |
| RNFL | – | 35.6 (0.7) | 14.5 (0.5) |
| RGC+ | – | 84.6 (0.9) | 79.7 (0.7) |
| INL | – | 45.0 (1.5) | 41.3 (1.5) |
| ONL | – | 91.2 (1.2) | 89.8 (1.1) |
| IS | 32.5 (0.5) | 24.9 (0.5) | 24.3 (0.5) |
| OS | 44.3 (0.9) | 28.1 (0.6) | 28.5 (0.6) |
| RPE | 22.5 (0.6) | 21.8 (0.5) | 21.7 (0.5) |
| OS+ | 66.9 (0.8) | 49.8 (0.5) | 50.1 (0.4) |
| REC+ | 210.2 (2.4) | 164.0 (1.9) | 162.9 (1.9) |
a Values (μm) are means (± SEM).
b The following layers, or layer combinations, were measured: total retinal thickness (TR); retinal nerve fiber layer (RNFL); retinal ganglion cell layer + inner plexiform layer (RGC+); inner nuclear layer (INL); outer nuclear layer (ONL); photoreceptor inner segments (IS); photoreceptor outer segments (OS); retinal pigment epithelium + Bruch membrane (RPE); OS + RPE (OS+); and receptors + outer plexiform layer + ONL + IS + OS + RPE (REC+).
c Values for the RNFL, RGC+, and INL are denoted by dashes because of their absence at the center of the fovea. ONL values are similarly denoted by dashes because of the confounding inclusion of Henle fibers in ONL thickness measurement at the center of the fovea.
Normative Reference Ranges
For each of the thickness parameters, data normality was assessed using the Kolmogorov-Smirnov test. All parameters were normally distributed. Normative ranges of each parameter were constructed for children aged 5-15 years by determining the values corresponding to the fifth/95th and first/99th percentiles ( Table 4 ). Values that lie within the range of the fifth through 95th percentiles may be considered normal. Those that lie outside of this range but within the first through 99th percentiles may be considered borderline. Values that lie beyond the first or 99th percentile may be considered abnormal.


