Purpose
To clarify the relationship between evaluation items of sleep-disordered breathing and diabetic retinopathy in detail.
Design
Cross-sectional comparative study.
Methods
Sixty-eight consecutive nonproliferative diabetic retinopathy and 151 proliferative diabetic retinopathy (PDR) cases who had undergone surgeries in our department were included in this study. Pulse oximetry was conducted overnight and mean oxygen saturation by pulse oximeter (SpO 2 ; %), the sleeping 4% oxygen desaturation index (4% ODI times/hour), lowest SpO 2 (%), and the cumulative percent time spent at SpO 2 < 90% (CT 90%) were calculated. The results were evaluated and compared between the 2 groups. In addition, these results and preoperative patient background factors were analyzed using logistic regression analysis to clarify risk factor of PDR.
Results
4% ODI and CT 90% in the PDR group were significantly higher than in the nonproliferative diabetic retinopathy group (4% ODI, 7.8 vs. 4.9; P = .007; CT 90%, 2.2 vs 0.8; P = .0006). Lowest SpO 2 was significantly lower in the PDR group than in the nonproliferative diabetic retinopathy groups (82.4 vs 87.0; P = .0006). Logistic regression analysis identified being younger, having a lower value for the lowest SpO 2 , and a high hemoglobin A1c value to be risk factors for PDR (age: odds ratio, 0.90; 95% confidence interval, −0.86 to −0.94; P < .0001; lowest SpO 2 : odds ratio, 0.93; 95% confidence interval, 0.88 to 0.99; P = .02; hemoglobin A1c: odds ratio, 1.00 to 1.69; P = .047).
Conclusions
This study indicated that PDR cases had episodes of nocturnal intermittent hypoxia and reoxygenation as a result of sleep-disordered breathing and that low-value lowest SpO 2 were the risk factors for PDR development.
Recently, sleep-disordered breathing (SDB) has been recognized as being associated with arteriosclerotic diseases and as a possible risk factor for macroangiopathies such as hypertension, coronary artery disease, and cerebrovascular disease or for microangiopathic disorders such as renal disease.
We focused on the relevance of diabetic retinopathy and SDB and reported that proliferative diabetic retinopathy (PDR) cases had a high incidence of SDB; male SDB prevalence was 50% and female SDB prevalence was 27.3%, for an overall prevalence of 42.4%. Temporary increases in the frequency of more than 4% oxygen desaturation index (4% ODI times/hour), as measured by a screening test for SDB, were shown to be an independent factor contributing to PDR diagnosis. To reanalyze the relationship between SDB and risk factors for PDR and to assess the nature of SDB in detail, we introduced new SDB evaluation items.
Methods
A total of 219 Japanese inpatients, who had type 2 diabetes, including 68 consecutive nonproliferative diabetic retinopathy (NPDR) cases and 151 consecutive PDR cases were included in this study. Patients with NPDR underwent vitreous surgery for macular edema or cataract surgery, and those with PDR underwent filtering surgery for neovascular glaucoma or vitreous surgery for macular edema, vitreous hemorrhage, and traction retinal detachment from April 1, 2006, through April 1, 2008, at the Department of Ophthalmology, Toho University Sakura Medical Center.
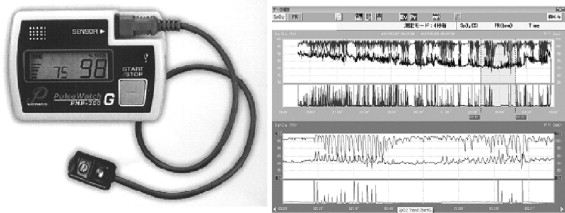
The severity of retinopathy was confirmed using with the medical records. An SDB screening test was conducted after obtaining informed consent from all patients in accordance with the Declaration of Helsinki. A pulse oximeter, the PMP-200G (Fuji Respironics Co, Ltd, Saitama, Japan; Figure , Right), was placed on the patient’s wrist before bedtime to measure oxygen saturation by pulse oximeter (SpO 2 ; %), pulse rate, and body motion. The device was removed when the subject woke up. The data were stored in the oximeter’s memory to calculate 4% ODI times/hour, average SpO 2 % during sleep (mean SpO 2 ), lowest SpO 2 % during sleep (lowest SpO 2 ), and cumulative percent time spent at SpO 2 < 90% during the analysis period (CT 90%), using analysis software SpO 2 Trend Chart G (Fuji Respironics Co, Ltd; Figure , Left). The 4% ODI value represents the number of events per hour during the recording period in which arterial oxygen saturation falls more than 4% below baseline saturation, but recovers thereafter to baseline saturation. Drops in oxygen saturation exceeding 4% during the interval of 90% to 100% saturation were regarded as 4% oxygen desaturation events. We reported that the 4% ODI value in this device has a strong correlation with the apnea hypopnea index times/hour, and when the ODI was supposed to be 5 times/hour, the expectation of AHI was 15 times/hour. The American Academy of Sleep Medicine advocates that an apnea hypopnea index of 15 times/hour be diagnosed as sleep apnea syndrome.
The pulse oximeter provided a 0% to 100% measurement range and 70% to 100% accuracy with ± 2% error for SpO 2 , a 30 to 250 beats/minute measurement range with ± 2% accuracy for pulse rate, whereas the accuracy of body motion measurement was 0 ± 3 G. The oximeter was placed on the left wrist, and the probe was attached to the left first finger. Getting up at night, for example, to urinate, was checked by questioning the patients. Neither pulse changes nor monitoring of body motion was included in the analysis. The test was administrated by the same investigator (T.S.) and was conducted before surgery, because patient positioning may be limited after surgery. The following items were analyzed as preoperative patient background factors: sex (male-to-female ratio); age: duration of diabetes (years); preoperative hemoglobin A1c (HbA1c) value (%); estimated glomerular filtration rate (mL/min/1.73 m 2 for men and mL/min/0.742 m 2 for women), which can be obtained by a simple formula from the Japanese Modification of Diet in Renal Disease; body mass index (kg/m 2 ); frequency of hypertension (%); and frequency of insulin therapy (%). These items were compared between the NPDR and PDR groups. The SDB evaluation items, that is, mean SpO 2 , 4% ODI times/hour, lowest SpO 2 , and CT 90%, also were compared between the 2 groups. In addition, logistic regression analysis was conducted to investigate whether the SDB evaluation items were possible risk factors for PDR. Statistical analyses were conducted using the 2 × 2 chi-square test, unpaired t test, and Mann–Whitney U test. A P value less than .05 was considered to be statistically significant. Stat View software version 5.0 (SAS Institute, Cary, North Carolina, USA) was used for statistical analysis.
Results
Preoperative patient background factors for the NPDR and PDR groups are shown in Table 1 . There were significant differences between the 2 groups in age. The NPDR group was older than the PDR group (mean age ± standard deviation [SD], 65.9 ± 6.6 years [NPDR] vs 59.9 ± 9.9 years [PDR]; P > .0001). Preoperative HbA1c value and frequency of hypertension tended to be higher in the PDR than in the NPDR group (mean HbA1c value ± SD, 7.4 ± 1.5% [PDR] vs 7.1 ± 1.2% [NPDR]; P = .07; mean hypertension rate ± SD, 68.2% [PDR] vs 55.9% [NPDR]; P = .08), but were not significant.
| NPDR Group | PDR Group | P Value | |
|---|---|---|---|
| Male-to-female ratio | 36:32 | 90:61 | .36 a |
| Age (yrs) | 65.9 ± 6.6 | 59.9 ± 9.9 | < .0001 b |
| Duration of diabetes (yrs) | 11.0 ± 7.6 | 11.9 ± 8.5 | .45 b |
| HbA1c % | 7.1 ± 1.2 | 7.4 ± 1.5 | .07 b |
| eGFR (mL/minute/1.73 m 2 ) | 71.9 ± 21.3 | 67.1 ± 27.3 | .20 b |
| BMI (kg/m 2 ) | 23.8 ± 3.4 | 24.5 ± 3.9 | .19 b |
| Hypertension (%) | 55.9 | 68.2 | .08 a |
| Insulin therapy (%) | 30.9 | 39.1 | .24 a |
The SDB results for the 2 groups are shown in Table 2 . Mean SpO 2 ± SD in the NPDR group was not statistically significantly different from that in the PDR group (97.6 ± 1.2% [NPDR] vs 97.3 ± 1.5% [PDR]; P = .14). Mean 4% ODI ± SD in the NPDR group was significant lower than that in the PDR group (4.9 ± 5.4 times/hour [NPDR] vs 7.8 ± 8.1 times/hour [PDR]; P = .007). Mean CT 90% ± SD in the NPDR group also was significantly lower than that in the PDR group (0.8 ± 1.8% [NPDR] vs 2.2 ± 5.0% [PDR]; P = .0006). Lowest mean SpO 2 ± SD in the NPDR group was significantly higher than that in the PDR group (87.0 ± 7.8% [NPDR] vs 82.3 ± 9.6% [PDR]; P = .0006). Analysis time did not differ significantly between the 2 groups ( P = .51).
| NPDR Group | PDR Group | P Value | |
|---|---|---|---|
| Mean SpO 2 (%) | 97.6 ± 1.2 | 97.3 ± 1.5 | .14 a |
| 4% ODI (times/hour) | 4.9 ± 5.4 | 7.8 ± 8.1 | .007 b |
| Median | 3.5 | 4.9 | |
| Standard error | 0.65 | 0.66 | |
| Range | 0.0 to 22.8 | 0.0 to 43.6 | |
| Lowest SpO 2 (%) | 87.0 ± 7.8 | 82.3 ± 9.6 | .0006 a |
| CT 90% | 0.8 ± 1.8 | 2.2 ± 5.0 | .0006 b |
| Median | 0.06 | 0.41 | |
| Standard error | 0.22 | 0.40 | |
| Range | 0.0 to 8.2 | 0.0 to 35.7 | |
| Analysis time (minutes) | 416.1 ± 59.2 | 422.0 ± 63.8 | .51 a |
Table 3 shows the logistic regression analysis for PDR risk factors in this study; the explanatory variables are preoperative patient background factors (age, HbA1c, hypertension) and SDB evaluation items (4% ODI, lowest SpO 2 , CT 90%) that had shown significant differences or tendencies between the 2 groups. Older age and high-value lowest SpO 2 were identified as protective factors and HbA1c was identified as a risk factor for PDR in the current study (age: odds ratio, 0.90; 95% confidence interval, 0.86 to 0.94; P < .0001; lowest SpO 2 : odds ratio, 0.93; 95% confidence interval, 0.88 to 0.99; P = .02; HbA1c: odds ratio, 1.30; 95% confidence interval, 1.00 to 1.69). That is, younger age, low-value lowest SpO 2 , and high-value HbA1c were identified as risk factors for PDR in the current study. Four SDB evaluation items correlated positively with each other ( Table 4 ).


