Purpose
To determine the rate of progression and optimal follow-up time in patients with advanced-stage retinitis pigmentosa (RP) comparing the use of fundus autofluorescence imaging and spectral-domain optical coherence tomography.
Design
Retrospective analysis of progression rate.
Methods
Longitudinal imaging follow-up in 71 patients with retinitis pigmentosa was studied using the main outcome measurements of hyperautofluoresent ring horizontal diameter and vertical diameter along with ellipsoid zone line width from spectral-domain optical coherence tomography. Test-retest reliability and the rate of progression were calculated. The interaction between the progression rates was tested for sex, age, mode of inheritance, and baseline measurement size. Symmetry of left and right eye progression rate was also tested.
Results
Significant progression was observed in >75% of patients during the 2-year mean follow-up. The mean annual progression rates of ellipsoid zone line and hyperautofluorescent ring horizontal diameter and vertical diameter were 0.45 degree (4.9%), 0.51 degree (4.1%), and 0.42 degree (4.0%), respectively. The ellipsoid zone line width and hyperautofluorescent ring horizontal diameter and vertical diameter had low test-retest variabilities of 8.9%, 9.5%, and 9.6%, respectively. This study is the first to demonstrate asymmetrical structural progression rate between right and left eye, which was found in 19% of patients. The rate of progression was significantly slower as the disease approached the fovea, supporting the theory that RP progresses in an exponential fashion. No significant interaction between progression rate and patient age, sex, or mode of inheritance was observed.
Conclusions
Fundus autofluorescence and optical coherence tomography detect progression in patients with RP reliably and with strong correlation. These parameters may be useful alongside functional assessments as the outcome measurements for future therapeutic trials. Follow-up at 1-year intervals should be adequate to efficiently detect progression.
Retinitis pigmentosa (RP) is characterized by a slow, progressive loss of photoreceptors primarily involving rods, followed by loss of cone photoreceptors. Early RP impairs night and peripheral vision, leaving central vision intact until later in the disease.
The natural history of the disease has long been studied using functional measures such as visual acuity, visual field, and electrophysiology, which have provided substantial insight into the various patterns of disease progression. Visual field analyses revealed that aside from the basic pattern of concentric visual field loss, some patients exhibit scotomas in midperipheral regions of the visual field and some exhibit asymmetrical visual field loss, though in the end stage of all patterns a central visual field remains with occasional small islands of peripheral vision. While visual field and conventional visual function testing most closely capture the patient’s perception of visual impairment, these tests are inherently subjective and have high test-retest variability. The advent of full-field electroretinography (ffERG) allowed for an objective, functional measurement of the retina, which assists in diagnosing RP and in monitoring the long-term disease course for prognosis and treatment response. The different types of ERG monitor local and broad measurements of retina function. Full-field ERG measures the entire retina, pattern ERG measures the central retina, and multifocal ERG measures the innermost 30 degrees of the retina; these modes of ERG greatly improved the reproducibility of functional measurements compared to visual field testing. One important limitation of these functional studies, however, is that they have not been able to reliably detect small progression, especially in end-stage disease, owing to the variability of the testing results.
Noninvasive imaging techniques such as spectral-domain optical coherence tomography (SD OCT) and fundus autofluorescence (AF) use objective, structural measurements, which have been shown to be well-correlated with functional measures of disease. A landmark study led by Graham Holder and associates first reported the presence of hyperautofluorescent rings in patients with RP in 2003. Subsequently, the utility of fundus AF to measure the progression of RP was demonstrated in several series of studies that showed the correlation between structural and functional measurements and the correlation between the diameter of the hyperautofluorescent ring on AF and the width of the ellipsoid zone line on SD OCT. OCT and AF measurements of advanced RP did not correlate with ffERG, which assesses nonselective global responses of the retina. Interestingly, some patients that were shown by OCT to have structurally intact maculae exhibited reduced focal ERG responses, which may have been due to a structural change not detected by the OCT device or functional deficit preceding the structural deficit. In these cases structural measurements did not correlate with functional measurements, suggesting the usefulness of a multimodal approach to monitoring progression in the central retina.
Compared to functional assessments, structural imaging modalities focus at the posterior pole of the retina and have lower test-retest variability, and hence improved sensitivity to detect the progression of advanced-stage disease in a shorter period of time. Furthermore, these 2 imaging modalities are widely available, and they can be more child friendly than ERG, which is important for monitoring family members of patients with RP. Given these qualities, these imaging modalities may be useful for visualizing the natural course of disease in a slow-progressing disease like RP, and they may need consideration as outcome measurements to supplement functional measurements in assessing the efficacy of upcoming gene therapy and other treatment trials in RP, in which patients are often enrolled at advanced stages of disease. Because SD OCT and AF are limited to structural assessment of the posterior pole, full-field ERG remains important in advanced-stage disease to measure any peripheral retinal function, and other functional assessments that focus at the posterior pole may be useful to more fully quantify impairment in advanced disease.
Investigators conducting gene therapy and cell-based treatment trials in RP have the unique capability of using the fellow eye as a treatment control, assuming that disease progression is highly symmetrical in the left and right eyes. In recent studies from our group and others, a small proportion of the patients were observed to have baseline asymmetry using structural imaging techniques. However, asymmetrical disease progression has yet to be described in typical retinitis pigmentosa patients.
The purpose of this study is to compare OCT and autofluorescence in monitoring RP progression at the posterior pole, to identify their test-retest reliabilities, and to determine the optimal follow-up time in advanced-stage RP. The study also addresses whether asymmetry between structural progression in the left and right eyes exists, and whether the rate of structural progression is affected by age, sex, mode of inheritance, and stage of the disease.
Methods
Subjects
This study adhered to the tenets of the Declaration of Helsinki and was approved by the Institutional Review Boards of the Edward Harkness Eye Institute and Columbia University. All subjects gave their consents. From a total of 864 patients with typical RP who have been followed up in the electrodiagnostics clinic at Columbia University’s Harkness Eye Institute, 71 patients were selected according to the following criteria. Patients were included if they were monitored for at least 2 visits. Because our clinic is an international referral center for RP, after initial diagnosis was made for a large number of our patients, care was transferred back to the primary provider, and these patients did not return for a second visit. No cases of unilateral RP, X-linked RP in female patients, or paravenous RP were included in the study. Fundus AF imaging and SD OCT were used to evaluate structural disease progression and disease status at every time point. Patients with advanced RP who exhibited no visible ellipsoid zone line and no visible hyperautofluorescent ring were excluded along with patients with poor image quality.
Diagnoses of RP were made based on clinical history, fundus examination, and full-field electroretinogram results. The majority of the 71 patients in the cohort carried a diagnosis of autosomal recessive RP (ARRP; 48 patients [67.6%]), followed by autosomal dominant (ADRP; 19 patients [26.8%]) and X-linked RP (XLRP; 4 patients [5.6%]). Syndromic RP accounted for 12.7% (9 patients) of the patients, and all were diagnosed with Usher syndrome. Patients were divided into 3 groups according to mode of inheritance (autosomal dominant, autosomal recessive, or X-linked), with the Usher syndrome patients included in the autosomal recessive subgroup.
Genetic Analyses
Blood was drawn from insured patients and DNA was extracted and tested on the published retinitis pigmentosa genes of the Chiang panel at Oregon Health Sciences University by parallel sequencing on Illumina HiSeq platform with 100 bp paired-end reads. Mutations were confirmed by dideoxy chain-terminating sequencing.
Image Acquisition
Fundus Autofluorescence
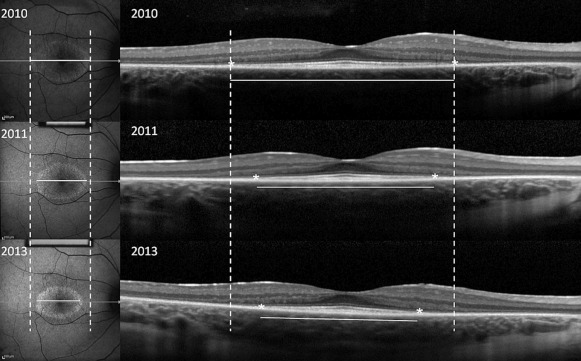
After pupil dilation, fundus AF imaging and SD OCT were performed using the Spectralis HRA+OCT device (Heidelberg Engineering, Dossenheim, Germany) in each visit. AF imaging was acquired at a resolution of 1536 × 1536 pixels with a 30-degree field of view or, if the ring was larger, a 55-degree field of view. The excitation wavelength was 488 nm. A 521 nm barrier filter was used to filter the emitted fluorescence light. The horizontal diameter and vertical diameter of the external boundary of the hyperautofluorescent ring were measured using the measuring tool provided in the Spectralis software ( Figure 1 ). The external boundary is preferred over the internal boundary owing to its more distinct appearance and its presence in a higher number of patients with RP, which allows greater precision to define the border. In cases involving a hyperautofluorescent arc rather than a complete ring, or a nasal edge of the ring that falls outside the optic nerve, only 1 axis was measured.
Spectral-Domain Optical Coherence Tomography
SD OCT images were acquired with an 870 nm light source, using an automatic real-time registration program from the Spectralis HRA+OCT device (Heidelberg Engineering).
Horizontal scan through the fovea was used to evaluate the width of the residual ellipsoid zone line using the measuring tool provided in the machine ( Figure 1 ).
Each studied parameter was measured twice by 1 observer.
Statistical Analysis
At each visit, fundus autofluorescence and SD OCT were imaged. To assess test-retest reliability, from each studied image, 2 measurements were taken several weeks apart by the first author (T.S.) for each parameter (ellipsoid zone line width, horizontal and vertical hyperautofluorescent ring diameter). The absolute difference between these 2 replicate measurements was calculated and summary statistics reported. In addition, the Bland-Altman method was used to calculate the coefficient of repeatability, defined as the 95th percentile of the difference between 2 methods of measurement. For each structural imaging modality parameter, the intraclass correlation coefficient (ICC) was calculated to assess the reliability of test-retest measurements. The Pearson correlation coefficient was used to examine the relationship between these 3 parameters, and the average of the 2 measurements for each parameter was used for this analysis. Progression rate was defined as a reduction in size of the parameter greater than the threshold for significant change, set at the 75th percentile of test-retest measurements. The proportion of patients that would have progressed at incremental follow-up times was estimated by projecting the best fit line–described below—for each patient to determine if the decline would be greater than the threshold for significant change.
To model the trajectories of each of the variables measured from structural imaging modalities, linear mixed models were fit. The outcomes for these different models were ellipsoid zone line width, horizontal ring diameter, and vertical ring diameter. All linear mixed models included random intercepts and random slopes for subjects over time. The random slopes estimated the change over time for each subject. Left and right eyes were modeled separately. Variability between left and right eye measurements was tested and no significant difference was observed (data not shown). For presentation purposes, only the right eye was selected to represent the natural rate of progression.
We examined the hypothesis of whether the right and left eyes of a patient progress similarly. For each subject, the difference in progression rate between the left and right eyes was calculated. This difference was compared to the variability of progression rate due to measurement error, which was calculated from test-retest observations of the right eye.
To examine whether the progression rate varied by another factor, linear mixed models were fit that included time and the factor in question, using an interaction between time and the potential factor as predictors. The other factors examined were age, sex, mode of inheritance, and stage of disease. All statistical analysis was performed using R version 3.1.0.
Results
Clinical Data
A total of 71 patients were analyzed in this study. Nineteen patients (26.8%) had ADRP, 48 (67.6%) had ARRP, and 4 (5.6%) had XLRP. Thirty-two (45.1%) were female and 39 (54.9%) were male. The average age of patients at the initial visit was 40.4 ± 19.4 (range 12–81) years. The average follow-up time was 2.1 (range 0.3–7.7) years, and the frequency of follow-up ranged from 2 to 6 visits during the follow-up time. Patients’ clinical and genetic details are summarized in Table 1 . Regarding the patients’ retinal imaging phenotypes, 69 of the patients (97.2%) had an ellipsoid zone within the SD OCT field of view, 48 (67.6%) had both an ellipsoid zone and a hyperautofluorescent ring, and of the 2 patients with ellipsoid zones that extended outside the SD OCT field of view, both had a measureable hyperautofluorescent ring. Different autofluorescence patterns were found as expected. A total of 49 patients (69.0%) had a hyperautofluorescent ring, 17 (23.9 %) had central patchy hyperautofluorescence, and 5 (7.0%) had no abnormal hyperautofluorescent pattern. Eleven of the patients (15%) included in this study were observed to have cystoid macular edema (CME).
| ID | Sex | Age | Mode of Inheritance | Known Genotypes | Years of Follow-up | Ellipsoid | Hyperautofluorescent Ring | Comment |
|---|---|---|---|---|---|---|---|---|
| 1 | F | 38 | ARRP | PDE6A (p. Arg102Cys; p. Ser303Cys) | 7.6 | + | + | |
| 2 | F | 80 | ARRP | – | 2.6 | + | No residual ring | CME |
| 3 | F | 13 | ARRP | – | 3.4 | + | + | |
| 4 | F | 80 | ARRP | – | 1.3 | + | No residual ring | |
| 5 | F | 26 | ARRP | – | 1.1 | + | + | |
| 6 | F | 24 | ADRP | PRPF31(p.107_108del) | 0.3 | + | + | |
| 7 | F | 22 | ADRP | PRPF31(p.107_108del) | 0.3 | + | + | |
| 8 | M | 18 | ARRP | USH2A (p.Thr1238Arg:c.3713C>G, p.Cys3153STOP:c.9459C>A) | 2.9 | + | + | |
| 9 | M | 73 | ARRP | – | 0.5 | + | No residual ring | |
| 10 | F | 56 | ARRP | – | 1.2 | + | No residual ring | |
| 11 | M | 51 | ADRP | RHO (p.Asp190Asn) | 3.3 | + | + | |
| 12 | F | 23 | ARRP | USH2A (p.Glu478Asp); CNGB1 (c.3150delG p.Phe1051Leufs) | 2.0 | + | + | |
| 13 | M | 17 | ARRP | USH2A (p.Glu478Asp); CNGB1 (c.3150delG p. Phe1051Leufs) | 2.0 | + Beyond measurement | + | |
| 14 | M | 75 | ARRP | – | 1.3 | + | + | |
| 15 | F | 23 | ARRP | – | 1.6 | + | No residual ring | |
| 16 | M | 54 | ARRP | USH2A (p.Ser841Tyr,p.Tyr1992Cys) | 1.8 | Generalize granulated | + | |
| 17 | M | 29 | ARRP | – | 3.5 | + | + | CME |
| 18 | F | 51 | ARRP | – | 2.9 | + | + | CME |
| 19 | F | 43 | ADRP | – | 2.3 | + | + | |
| 20 | F | 26 | ARRP | – | 0.5 | Generalize granulated | + | |
| 21 | M | 35 | ADRP | – | 2.9 | + | No residual ring | |
| 22 | M | 59 | XLRP | – | 0.7 | + | + | |
| 23 | M | 57 | ADRP | CRX (p.Gly122Asp); PRPF31 (p.107_108del); MYO7A (p.Val411Ala) | 2.9 | + | + | CME |
| 24 | M | 58 | ARRP | – | 2.5 | + | No residual ring | |
| 25 | F | 58 | ARRP | – | 0.3 | + | + | |
| 26 | M | 49 | ARRP | – | 1.3 | + | No residual ring | |
| 27 | M | 26 | ADRP | – | 3.3 | + | + | |
| 28 | M | 54 | ADRP | RPE65 (p.Ala132Thr) | 3.8 | + | No residual ring | |
| 29 | F | 25 | ADRP | – | 3.3 | + | + | |
| 30 | M | 27 | ADRP | – | 0.9 | + | No residual ring | CME |
| 31 | M | 32 | ARRP | – | 2.0 | + | + | |
| 32 | M | 62 | ADRP | – | 1.1 | + | + | |
| 33 | M | 80 | ADRP | RPE65 (p.Ala132Thr) | 3.8 | + | No visible ring | |
| 34 | F | 27 | ARRP | – | 1.5 | + | No residual ring | |
| 35 | M | 58 | ARRP | – | 3.3 | + | No visible ring | |
| 36 | M | 44 | ARRP | – | 2.2 | + | + | CME |
| 37 | M | 75 | ARRP | – | 3.0 | + | No residual ring | |
| 38 | F | 16 | ADRP | RHO (c.937-27_-19delCCCTGACTC) | 1.5 | + | + | |
| 39 | F | 35 | ARRP | – | 0.3 | + | + | |
| 40 | F | 58 | ARRP | – | 0.9 | + | No visible ring | |
| 41 | M | 46 | ARRP | – | 3.4 | + | No visible ring | |
| 42 | M | 21 | ARRP | CRB1(p.Asp1005Val:c.3014A>T and p.Cys163Gly:c.487T>G) | 0.6 | + | Ring absent | |
| 43 | M | 30 | ARRP | – | 3.8 | + | + Arc-like OD | |
| 44 | F | 30 | ARRP | – | 3.1 | + | + | |
| 45 | F | 25 | ARRP | RGR (p.Ser66Arg); USH2A (p.Val2562Ala) | 4.0 | + | No residual ring | |
| 46 | F | 41 | ARRP | – | 1.8 | + | + | |
| 47 | M | 31 | ARRP | -c.8442_8443insT (novel frameshift mutation and p.Arg334Trp:c.1000C>TC) | 4.2 | + | + | |
| 48 | M | 45 | ARRP | USH2A (c.8442_8443insT; p.Arg334Trp: c.1000C>TC) | 0.8 | + | + | |
| 49 | M | 19 | ARRP | VLGR1 (Gln2301stop: c.6901C>T and c.17455-2A) | 4.3 | + | + | |
| 50 | F | 35 | ADRP | PRPF31 (c.420+6C>T); SAG (p.Cys147Phe: c.440G>T); PROM1 (p.Ser290Arg: c.868A>C) | 1.3 | + | No residual ring | |
| 51 | F | 55 | ARRP | – | 1.8 | + | No residual ring | |
| 52 | F | 12 | ARRP | – | 2.1 | + | + | |
| 53 | M | 12 | XLRP | RPGR (c.202G>A) | 1.8 | + | + | |
| 54 | M | 66 | ARRP | – | 2.6 | + | + | |
| 55 | M | 38 | ARRP | – | 1.0 | + | + | |
| 56 | F | 16 | ADRP | PRPF31 (c.383T>A p.Leu128stop) | 1.6 | + | + | CME |
| 57 | F | 37 | ARRP | – | 1.0 | + | + | |
| 58 | F | 72 | ARRP | – | 2.0 | + | No residual ring | |
| 59 | M | 41 | ADRP | – | 1.1 | + | + | |
| 60 | M | 58 | ARRP | – | 2.0 | + | + | |
| 61 | M | 30 | XLRP | RPGR (c.2194del p.Glu732ArgfsX83) | 1.5 | + | + | |
| 62 | M | 26 | ADRP | RP1 (c.2029C>T p.Arg677*) | 3.1 | + | + | |
| 63 | F | 45 | ADRP | – | 1.9 | + | Arc-like OD | CME |
| 64 | M | 11 | XLRP | RPGR (c.1307G>A p.Gly436Asp) | 1.4 | + | + | |
| 65 | F | 50 | ARRP | – | 1.3 | + | + | |
| 66 | F | 12 | ADRP | MYH11 (p.Leu668Val; p.Val1317Met); MYOM1 (p.Glu247Lys; p.Arg1477Trp) | 3.1 | + | + | CME |
| 67 | F | 62 | ADRP | – | 2.7 | + | + | |
| 68 | M | 69 | ARRP | – | 2.5 | + | No visible ring | |
| 69 | M | 13 | ARRP | PDE6B (c.1923_1969ins6del47) | 2.4 | + | + | CME |
| 70 | M | 20 | ARRP | PDE6B (c.1923_1969ins6del47) | 2.6 | + | + | CME |
| 71 | M | 25 | ARRP | – | 0.8 | + | + |
Reliability of the 3 Measurements
Test-retest measurements were analyzed by descriptive statistics, the Bland-Altman method, and intraclass correlation. The upper quartile of the difference between test and retest measurements was 112.5 μm for ellipsoid zone width, 116.0 μm for horizontal diameter, and 110.8 μm for vertical diameter. Other descriptive statistics are reported in Table 2 . The Bland-Altman method was used to determine the coefficient of repeatability—with percentage of the mean initial measurement in parentheses— calculated to be 233.2 μm (8.9%) for ellipsoid zone width, 312.1 μm (8.5%) for horizontal diameter, and 291.2 μm (9.6%) for vertical diameter. The ICC of each of the 3 measurement parameters also showed high test-retest reliability (ICC = 0.999 for ellipsoid zone width, ICC = 0.997 for horizontal diameter, and ICC = 0.997 for vertical diameter).
| Mean ± SD | Median | Lower Quartile | Upper Quartile | 95th Percentile | |
|---|---|---|---|---|---|
| Ellipsoid zone width | 80.7 ± 84.3 | 53.5 | 22.0 | 112.5 | 243.8 |
| Horizontal diameter | 99.5 ± 120.4 | 63.5 | 30.0 | 116.0 | 296.3 |
| Vertical diameter | 87.2 ± 116.8 | 60.0 | 25.2 | 110.8 | 245.2 |
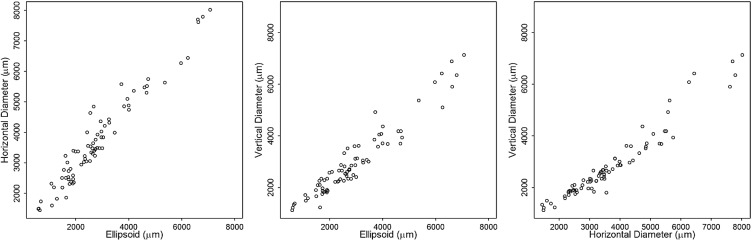
Next, we assessed the relationship between the 3 imaging parameters ellipsoid zone line, horizontal ring diameter, and vertical ring diameter. The Pearson correlation revealed a strong relationship between the 3 parameters ( Figure 2 ): r = 0.97 for ellipsoid zone line and horizontal diameter measurements, r = 0.96 for ellipsoid zone line and vertical diameter measurements, and r = 0.97 for horizontal diameter and vertical diameter measurements.
Proportion of Eyes Showing Progression
For each of the 3 parameters, the 75th percentile of the test-retest measurement variability was used as the threshold for significant change ( Table 2 ). Over the follow-up period, ellipsoid zone line measurements showed 54 of 67 patients (81%) having significant change while horizontal diameter measurements showed 33 of 42 patients (79%) and vertical diameter measurements showed 35 of 45 patients (78%) with significant change. The change over time for each subject was estimated from linear mixed models. To project the number of patients who would have shown structural disease progression during incremental lengths of follow-up, the 75th percentile of the test-retest measurement variability was again used as the threshold for significant change, and by 1.5 years of follow-up over 50% of the patients were projected to have significantly progressed using each of the 3 measurement parameters ( Table 3 ).
| Years of Follow-up | ||||||
|---|---|---|---|---|---|---|
| 1 | 1.5 | 2 | 2.5 | 3 | 3.5 | |
| Ellipsoid zone line | 0.37 | 0.60 | 0.73 | 0.81 | 0.91 | 0.96 |
| Horizontal diameter | 0.48 | 0.69 | 0.81 | 0.83 | 0.83 | 0.83 |
| Vertical diameter | 0.38 | 0.58 | 0.69 | 0.73 | 0.82 | 0.84 |
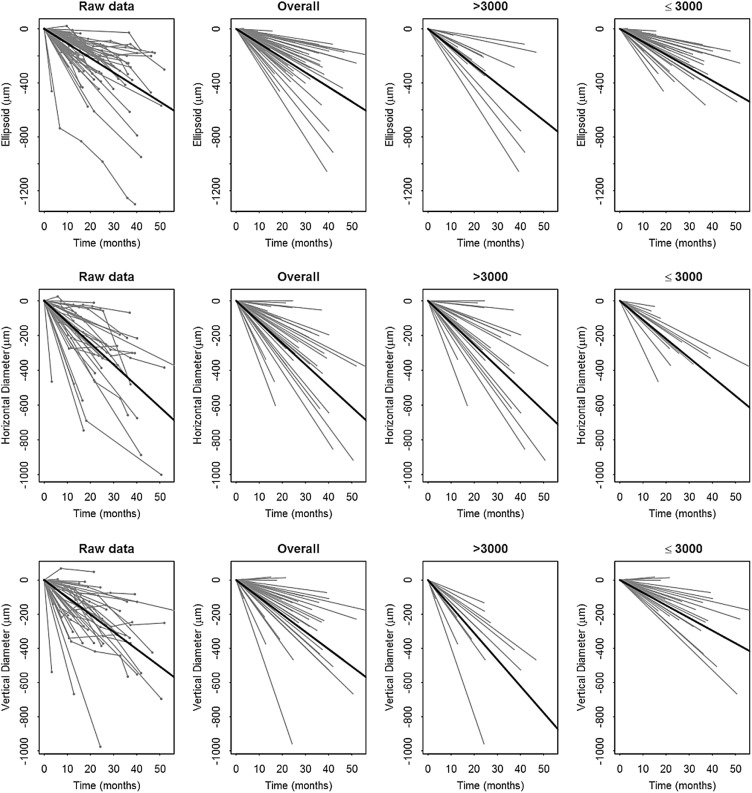
Rate of Progression
The structural measurements at each follow up time were shown for the patients graphically ( Figure 3 , leftmost panel). The data points were best fit with linear modeling, which provided an estimate of the progression rate for each patient, shown in the panels to the right ( Figure 3 ). Calculations of the progression rate for different subgroups of the patients are shown in Table 4 . The estimated mean shortening of the ellipsoid zone line was 130 μm (0.45 degree)/year (SE = 11, P < .001). Using the hyperautofluorescent ring, the estimated mean constriction of horizontal diameter was 147 μm (0.51 degree)/year (SE = 15, P < .001), and the estimated mean constriction of vertical diameter was 121 μm (0.42 degree)/year (SE = 15, P < .001). Represented as a decrease from the mean value of the initial visit, the cohort had a yearly progression rate of 4.9% by ellipsoid zone line, 4.1% by horizontal diameter, and 4.0% by vertical diameter.
| Outcome | Progression (Degree/Year) | Progression (μm/Year) | Standard Error | P Value |
|---|---|---|---|---|
| Ellipsoid zone overall | 0.45 | 130 | 11 | <.001 |
| Baseline <3000 μm | 0.40 | 115 | 12 | <.001 |
| Baseline ≥3000 μm | 0.57 | 163 | 19 | .04 a |
| Horizontal diameter overall | 0.52 | 147 | 15 | <.001 |
| Baseline <3000 μm | 0.46 | 131 | 28 | <.001 |
| Baseline ≥3000 μm | 0.53 | 152 | 20 | .6 a |
| Vertical diameter overall | 0.42 | 121 | 15 | <.001 |
| Baseline <3000 μm | 0.31 | 89 | 16 | <.001 |
| Baseline ≥3000 μm | 0.66 | 187 | 25 | <.001 a |
a P values for the lines with baseline ≥3000 μm are for tests of the interaction terms.
Stay updated, free articles. Join our Telegram channel

Full access? Get Clinical Tree


