Purpose
To evaluate the predictive ability of macular parameters defined in the significance map created using spectral-domain optical coherence tomography (SD-OCT) for paracentral visual field defects in early glaucoma.
Design
Prospective comparative study.
Methods
We studied 78 early-glaucomatous eyes of 78 patients, who underwent SD-OCT and standard automated perimetry 10-2. Macular layer parameters included the retinal nerve fiber layer (RNFL), ganglion cell layer (GCL) + inner plexiform layer (IPL), and RNFL + GCL + IPL. The minimal distance between the area with abnormal ( P < 1%) thickness and foveal center was defined as the shortest distance. A wider area of an abnormally thinned (<1%) region, within either an inferior or a superior hemicircle with a diameter of 6 mm centered at the fovea, was defined as the macular abnormal area. A circumpapillary RNFL parameter was defined in its 36 sectors. Areas under the receiver operating characteristic curves (ROCs) were calculated to discriminate between eyes with (n = 39) and without (n = 39) paracentral visual field defects in the central 5 degrees.
Results
Measurement reproducibility was almost perfect in the macular parameters at P < 1% (intraclass correlation, 0.907–0.942). Areas under the ROC were significantly higher ( P ≤ 0.01) in the macular parameters (0.870–0.930), including the shortest distance of GCL + IPL/RNFL + GCL + IPL, and the macular abnormal area of RNFL/GCL + IPL/RNFL + GCL + IPL than in the circumpapillary RNFL parameter (0.676). When specificity was fixed at ≥90%, the shortest distance of GCL + IPL (area under the ROC = 0.874) and the macular abnormal area of RNFL (area under the ROC = 0.894) showed sensitivities greater than 50%.
Conclusions
Macular structural parameters defined on an SD-OCT significance map may be potentially useful predictors of the presence of paracentral scotoma.
The development of paracentral scotoma in glaucoma severely threatens patients’ quality of vision. Glaucoma can affect the central or paracentral visual field (VF), even in the early stages of the disease. It is suggested that patients with VF defects that threaten fixation should be treated more aggressively because they have an increased risk for further loss of the VF close to fixation which, in turn, is associated with the loss of visual acuity. Thus, it is critical to detect VF sensitivity loss in the paracentral VF as early as possible. Early detection of paracentral VF defects helps physicians to treat their patients more effectively, such as targeting lower intraocular pressure and scheduling follow-up by standard automated perimetry (SAP) 30-2 and 24-2 programs and the SAP10-2 program.
SAP24-2 is not designed to detect paracentral scotoma effectively because it includes only 5 testing points for the central region within 5 degrees of the fixation. Although SAP10-2 allows effective detection of paracentral VF defects because it includes 25 testing points within 5 degrees, it would be difficult to perform SAP10-2 routinely for all patients with glaucoma. Thus, time-saving examinations that can predict the risk for paracentral VF defects are desirable.
Glaucomatous optic neuropathy results from retinal ganglion cell loss following damage to retinal ganglion cell axons within the optic nerve head. A 3-dB reduction of VF sensitivity within the central 10 degrees is associated with a retinal ganglion cell loss of more than 60% on SAP30-2 and 24-2. Half of the retinal ganglion cells exist in the central 4.5-mm–diameter region of the macula and are arranged at a thickness of 7 to 8 cell layers at the peak; this corresponds to the thickest ganglion cell layer (GCL), which is approximately 57 to 64 μm thick at a distance of around 1 mm from the foveal center. The GCL and retinal nerve fiber layer (RNFL) thinning in the macula is evident even in eyes with preperimetric glaucoma. Although the location of retinal ganglion cells is a little displaced peripherally from the corresponding photoreceptors in the central 7.2 degrees, the retinal ganglion cell loss matches well in location with the VF sensitivity loss. Thus, macular thinning due to glaucomatous optic neuropathy may be a sensitive target for predicting paracentral scotoma in early glaucoma.
Spectral-domain optical coherence tomography (SD-OCT) enables 3-dimensional (3D) and high-axial resolution imaging of the macular inner retinal layers, such as the RNFL and GCL, and allows an accurate and reproducible automated thickness measurement of a single RNFL or combined inner retinal layers, including the GCL. The SD-OCT instruments statistically classify the thickness of these layers at each A-scan as abnormal, borderline or normal as compared to the confidence intervals of the built-in normative database and display a color-coded significance map in which the regions with abnormal or borderline thickness are shown in red or yellow. The significance map is useful for early diagnosis of glaucoma. The purpose of this study was to test the predictive ability of the macular structural parameters created in an automated manner based on the significance map of the inner retinal layers on SD-OCT to detect paracentral VF defects in early glaucoma.
Methods
This prospective, cross-sectional, comparative study was carried out with approval by the institutional review board and ethics committee of Kyoto University Graduate School of Medicine and Kanazawa University Graduate School of Medical Science and adheres to the tenets of the Declaration of Helsinki. Informed consent to participate in this study was obtained from the patients or subjects after they received an explanation of the nature and possible consequences of the study.
Patients with glaucoma examined in the glaucoma clinic at the Kyoto University Hospital (Kyoto, Japan) and Kanazawa University Hospital (Kanazawa, Japan) between May 2010 and August 2012 were enrolled. All participants underwent comprehensive ophthalmic examinations, including a best-corrected visual acuity measurement using a 5-m Landolt chart; refraction; slit-lamp biomicroscopy; intraocular pressure measurements using a Goldman applanation tonometer; gonioscopy; axial length measurements by partial laser interferometry (IOLMaster, Carl Zeiss Meditec, Dublin, California, USA); dilated biomicroscopic examination; stereo disk photography with a 3D × simultaneous stereo disk camera (Nidek, Gamagori, Japan); red-free fundus imaging using a Heidelberg Retina Angiogram II (HRA2, Heidelberg Engineering, Heidelberg, Germany); and SD-OCT examination with 3D OCT-2000 (Topcon, Tokyo, Japan). SAP was performed using the 24-2 and 10-2 Swedish Interactive Threshold Algorithm (Humphrey Field Analyzer, Carl Zeiss Meditec) within 3 months of SD-OCT examination.
Inclusion criteria were glaucomatous optic neuropathy, normal open angles confirmed by gonioscopy, mean deviation (MD) on SAP24-2 <−6 dB, best corrected visual acuity of 20/25 or better in Snellen equivalent, and a spherical equivalent refractive error ≤−6.00 diopter. Eyes with any type of vitreoretinal diseases, media opacity, or history of ocular surgery were excluded. Patients with histories of corticosteroid use and evidence of neurologic diseases or systemic disorders such as diabetes that might affect the retinal structure and VF were excluded. When both eyes were eligible, 1 eye was randomly selected for inclusion in the study.
A patient was diagnosed as having glaucomatous optic neuropathy when the optic disk had a glaucomatous appearance (diffuse or localized neuroretinal rim thinning) on stereo disk photographs or RNFL defects corresponding with the glaucomatous VF defects on red-free fundus imaging or both. Both SAP24-2 and SAP10-2 were considered reliable when fixation losses and the false-positive and false-negative rates were less than 15%. A glaucomatous VF defect was defined on SAP24-2 as (1) a glaucoma hemifield test value that was outside the normal limits; (2) at least 3 vertical, horizontal or diagonal contiguous test points within the same hemifield on the pattern deviation probability plot at P < 5%, with at least 1 point at P < 1%, excluding points directly above or below the blind spot; or (3) a pattern standard deviation <5% of the normal reference values, confirmed by at least 2 VF tests.
SD-OCT Examination
A well-trained examiner performed SD-OCT examinations in each eye after pupil dilation with tropicamide (0.5%) and phenylephrine (2.5%). The OCT equipment has a 6-μm depth resolution in tissue, a 20-μm transverse resolution, and an A-scan acquisition rate of 50,000/second. For the macular measurement, a 3D raster scan protocol of 128 vertical B-scans was used, comprising 512 A-scans per B-scan over 65,536 samplings within a cube of 7 mm × 7 mm × 2.3 mm centered at the foveal center. For the circumpapillary RNFL measurement, a 3D raster scan protocol of 128 horizontal B-scans was used, comprising 512 A-scans per B-scan over 65,536 samplings within a cube of 6 mm × 6 mm × 2.3 mm centered at the optic disk center. Both scans took 1.3 seconds. The examiner discarded poor-quality images that had visible eye motion, blinking artifacts (discontinuous jump) or poor centration. To calculate the test-retest measurement variability, 3 scans per eye with acceptable images were obtained during the same visit.
Measurement on SD-OCT
To obtain a more accurate macular scan area, the magnification effect on lateral length was corrected in each scan by using the manufacturer’s formula (a modified Littman method) based on the eye’s refractive error, corneal radius and axial length. Only high-quality images, as indicated by a signal strength score (Q-factor) >65, were used for measurement.
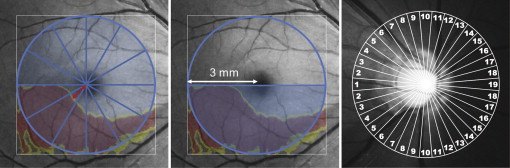
For macular measurement, the 3D OCT built-in software was used; it automatically detects the foveal center and places a 6 mm × 6 mm square centered on the fovea. This software automatically measures the thickness of a single layer or combined layers, such as the RNFL, GCL + IPL, and RNFL + GCL + IPL (GCC). RNFL was measured as the distance between the vitreoretinal interface and the outer boundary of the RNFL, GCL + IPL between the outer boundary of the RNFL and the outer boundary of the IPL, and the GCC between the vitreoretinal interface and the outer boundary of the IPL. The software compares measurements to the corresponding confidence interval of the device’s normative database and displays three color-coded significance maps. Regions within the normal range ( P > 5% and P < 95%), those with borderline thinning (1% < P < 5%), and those with abnormal thinning ( P < 1%) are shown in green, yellow, and red, respectively ( Figure 1 and Figure 2 ).
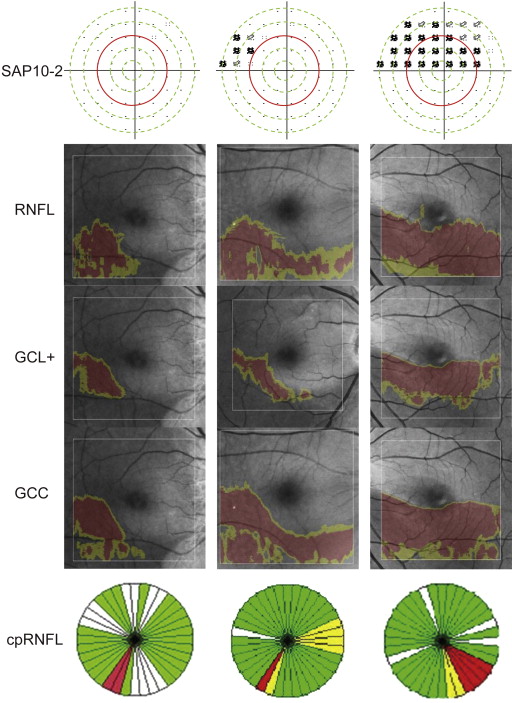
For circumpapillary RNFL thickness measurements, the 3D OCT built-in software automatically detects the center of the optic disk and places around it a 3.4-mm–diameter calculation circle consisting of 1,024 A-scans. The circumpapillary RNFL thickness was measured as the distance between the anterior and posterior boundaries of the RNFL delineated by the computer algorithm. To assess regional circumpapillary RNFL thickness abnormalities, the 3D OCT built-in software provides a color-coded significance map with 4, 12 or 36 equal-part sectors. Abnormal circumpapillary RNFL thickness in each circumpapillary RNFL sector is displayed as red (<1%), yellow (≥1% and <5%), green ( P > 5% and ≤95%), or white (>95%) compared to the confidence intervals of the normative database ( Figure 2 ).
Parameters Indicative of the Centrality of Structural Damages to the Fovea
We built a prototype software based on the 3D OCT built-in software to create two macular structural parameters that indicated the extent of macular thinning to the fovea on the significance map for the RNFL, GCL + IPL, and RNFL + GCL + IPL. One was the nearest distance of the abnormally thinned (<1%) or borderline-thinned (<5%) region to the foveal center on significance map ( Figure 2 ). To evaluate this, the software automatically drew 360 spokes that extended from the foveal center at every 1 degree in a counterclockwise direction and measured the distance between the foveal center and the meeting point of each spoke with the central edge of the abnormally or borderline-thinned area as the nearest distance of macular thinning to the fovea. The nearest distances of the 360 spokes were averaged every 30 degrees to obtain the average nearest distance in each of the 12 sectors. A minimal nearest distance among the 12 sectors was defined as the shortest distance of the macular thinning to the fovea in each eye. A second parameter was the wider area of abnormally thinned (<1%) or borderline-thinned (<5%) regions within an inferior or a superior hemicircle with a diameter of 6 mm, defined as the macular abnormal area ( Figure 1 ). Our prototype software automatically calculated the parameters of the shortest distance and the macular abnormal area.
We used 36 sectors to create a circumpapillary RNFL parameter that indicated the centrality of the retinal ganglion cell damages to the fovea ( Figures 1 and 2 ). We designated the temporal position as number 1 and the nasal position as number 19. Thus, the assigned numbers increased as a function of the angle from the temporal position toward the nasal position, in a clockwise or counterclockwise direction ( Figure 1 ). The smallest number of sectors with abnormal thickness in each eye should have indicated structural damages nearest to the fovea ( Figure 2 ). We used the lowest number of sectors with abnormal thickness as a structural parameter to detect paracentral scotoma in circumpapillary RNFL analysis.
Reproducibility
The reproducibility of macular measurements with 3D OCT was assessed in 28 eyes of 28 patients with glaucoma. To assess intervisit reproducibility, 3D OCT examinations were performed at 3 visits within 3 months after the initial visit. The intraclass correlation coefficient (ICC) and the Kendall coefficient of concordance were calculated to assess the intervisit reproducibility of continuous and categoric parameters, respectively. The coefficients of variation were calculated to assess intervisit variability.
Classification of Visual Field Defects According to Proximity to the Fixation Point in 10-2 Testing
Glaucomatous VF defects on SAP10-2 were defined as follows: the presence of more than 1 cluster of at least 3 vertical, horizontal or diagonal contiguous test points at P < 5% within the same hemifield on the pattern deviation probability plot, with at least 1 point at P < 1%, and the VF defects were located in the same hemifield as the VF defects in the SAP24-2. The SAP10-2 results were confirmed by at least 2 VF tests performed within 6 months, and the results of the 10-2 test performed closer to the visit for the SD-OCT examination were used for analysis.
The distance of the test points from the fixation points on SAP10-2 on the pattern deviation probability plot were grouped by five concentric circles centered at fixation, each of which passed the four test points nearest to the horizontal axis ( Figure 2 ). The test points located between neighboring two circles or on the outer circle were regarded as a group with a similar distance to a fixation point. The five groups were numbered from 1 to 5 as a function of the distance from the fixation point. The number of the nearest concentric circle, including abnormal test points at P < 1%, was regarded as the nearest concentric circle in each eye. When glaucomatous VF defects were absent on SAP10-2, the number of the nearest concentric circle was considered to be 5 so as to calculate its correlations with SD-OCT parameters.
The study eyes were classified into three groups when they had the same VF defect pattern on two consecutive SAP10-2 tests. VF defects on SAP10-2 were classified into three patterns according to the proximity of the significant VF defects to the fixation point on the pattern-deviation probability plot. The paracentral VF defect pattern (right panel, Figure 2 ) was defined as glaucomatous VF defects with more than one point at P < 1% on or inside the number 3 concentric circle (red circle, Figure 2 , approximately 5 degrees from the fixation point). The macular VF defect pattern was defined as glaucomatous VF defects on SAP10-2. The group with this pattern included eyes with (right panel, Figure 2 ) and without (center panel, Figure 2 ) a paracentral VF defect. The third pattern was defined as no glaucomatous VF defects on SAP10-2 (left panel, Figure 2 ).
Statistical Analysis
Differences in parameters between the two groups were compared by using unpaired t tests or the Mann-Whitney U test, and differences among the 3 groups were compared by analysis of variance (ANOVA) followed by the Tukey post hoc test. Spearman rank correlation coefficients were calculated for the analysis of correlation between the structural and VF parameters. The diagnostic accuracy was determined by computing the area under the ROC, and the sensitivity at fixed specificities was computed to discriminate between eyes with and without macular or paracentral VF defects. We calculated criteria to determine the optimal cutoff point for the parameters that could be used to distinguish between the presence and absence of macular or paracentral VF defects. The method of Delong and associates was used to compare the areas under the ROC between parameters. The unpaired t test scores, Mann-Whitney U test, ANOVA, Spearman rank correlation coefficients, ICC, and Kendall coefficient of concordance were calculated using the SPSS17 statistics software program (SPSS, Chicago, Illinois, USA), and the areas under the ROC were compared using MedCalc12 (MedCalc, Mariakerke, Belgium). P values <0.05 were considered statistically significant.
Results
In 99 Japanese patients, 114 eyes met the inclusion criteria. Of these, 11 eyes were excluded because they had undergone cataract surgery (8 eyes) or had had vitreoretinal diseases, such as epiretinal membrane (1 eye), diabetic retinopathy (1 eye), or superior segmental optic hypoplasia (1 eye). The random selection of 1 eye in patients with 2 eligible eyes resulted in the exclusion of 20 eyes. Furthermore, 5 eyes were excluded because the Q factor of the SD-OCT image was <60. Thus, 78 eyes of 78 patients were used for the current study. The demographics of all the study eyes and of each group are shown in Table 1 . Signal-strength values of the SD-OCT scans are also shown in Table 1 . No significant differences were found among the three groups except for the SAP24-2 and 10-2 indices. The group without any macular VF defect had better SAP indices than the other two groups, but there were no significant differences between the two groups with macular VF defect and paracentral VF defect.
| All Eyes (n = 78) | Classification of VF defect defined on SAP10-2 | ||||
|---|---|---|---|---|---|
| Eyes with Macular VF Defect (n = 52) | Eyes with Paracentral VF Defect (n = 39) | Eyes without Macular VF Defect (n = 26) | P Value | ||
| Age | 56.1 (11.8) | 55.0 (12.4) | 54.5 (12.4) | 57.9 (10.8) | 0.54 a |
| Gender (men/women) | 36/42 | 20/32 | 15/24 | 10/16 | 1.0 b |
| Refractive error (D) | −2.2 (2.2) | −2.2 (2.1) | −2.5 (2.1) | −2.2 (2.4) | 0.86 a |
| Axial length (mm) | 24.6 (1.2) | 24.5 (1.2) | 24.4 (1.0) | 24.8 (1.2) | 0.33 a |
| IOP (mm Hg) | 15.6 (2.4) | 15.7 (2.2) | 15.9 (2.1) | 15.6 (2.8) | 0.81 a |
| SAP 24-2 | |||||
| MD (dB) | −2.0 (2.3) | −2.4 (2.4) c | −2.7 (2.6) d | −1.1 (1.9) c,d | 0.02 a |
| PSD (dB) | 3.9 (2.6) | 4.4 (4.8) e | 4.7 (2.8) f | 2.2 (1.6) e,f | 0.003 a |
| SAP 10-2 | |||||
| MD (dB) | −2.6 (3.4) | −3.8 (3.7) g | −4.8 (3.7) h | −0.5 (0.8) g,h | <0.001 a |
| PSD (dB) | 4.3 (4.2) | 3.2 (6.0) i | 6.8 (4.5) j | 1.2 (0.2) i.j | 0.002 a |
| Signal strength of SD-OCT scans | |||||
| Macular scan | 74.3 (6.4) | 75.3 (6.8) | 75.8 (6.2) | 73.0 (5.6) | 0.23 a |
| Circumpapillary RNFL scan | 74.4 (6.6) | 74.8 (6.7) | 74.3 (6.1) | 73.6 (6.7) | 0.79 a |
a Analysis of variance followed by Tukey post hoc test.
i P = 0.007 for eyes with a macular VF defect vs those without any macular VF defect.
j P < 0.001 for eyes with a paracentral VF defect vs those without any macular VF defect.
| Parameters | Coefficient of Reproducibility | CV (%) |
|---|---|---|
| Shortest distance at P < 1% (mm) | ||
| RNFL | 0.921 a | 4.3 |
| GCL + IPL | 0.915 a | 5.8 |
| RNFL + GCL + IPL | 0.907 a | 4.4 |
| Shortest distance at P < 5% (mm) | ||
| RNFL | 0.758 a | 5.4 |
| GCL + IPL | 0.656 a | 7.1 |
| RNFL + GCL + IPL | 0.989 a | 3.6 |
| Macular abnormal area at P < 1% (mm 2 ) | ||
| RNFL | 0.920 a | 5.8 |
| GCL + IPL | 0.921 a | 3.3 |
| RNFL + GCL + IPL | 0.942 a | 2.7 |
| Macular abnormal area at P < 5% (mm 2 ) | ||
| RNFL | 0.880 a | 5.4 |
| GCL + IPL | 0.896 a | 5.0 |
| RNFL + GCL + IPL | 0.967 a | 1.1 |
| Circumpapillary RNFL at P < 1% | 0.913 b | 2.3 |
| Circumpapillary RNFL at P < 5% | 0.947 b | 1.0 |
a ICC = intraclass correlation.
Glaucomatous VF defects on SAP10-2 were found in both hemifields in 7 (9%) eyes and were limited to the superior and inferior hemifields in 38 (48.7%) and 7 (9.0%) eyes, respectively. Of 78 eyes, 39 (50%) had paracentral VF defects and 52 (66.7%) had macular VF defects on SAP10-2. Of 39 eyes with paracentral VF defects on SAP10-2, glaucomatous VF defects involved the innermost test points of SAP24-2 at P < 1% in 31 (79.5%) eyes and did not involve the same in 9 (23.1%) eyes.
Measurement reproducibility was almost perfect in macular parameters, including the shortest distance, at P < 1% (ICC, 0.907–0.921); the macular abnormal area, at P < 1% (ICC, 0.920–0.942); and the circumpapillary RNFL at P < 1% and P < 5% (Kendall coefficient of concordance, 0.913 and 0.947, respectively) ( Table 2 ). However, the shortest distance (ICC: RNFL, 0.758, and GCL + IPL, 0.656) and abnormal area (RNFL, 0.880, and GCL + IPL, 0.896) at P < 5% exhibited relatively low measurement reproducibility ( Table 2 ); therefore, subsequent analyses and comparisons of macular and circumpapillary RNFL parameters were made at P < 1%.
A macular abnormal area at P < 1% was detected within the 6-mm circle in all study eyes, and sectorial circumpapillary RNFL thickness at P < 1% was detected in 62 (79.5%) eyes. The hemiretinal location of the macular abnormal area at P < 1% was matched to that of the shortest distance at P < 1% in all eyes. The macular abnormal area at P < 1% and the shortest distance at P < 1% were superiorly located in 55 of 78 eyes (70.5%) and inferiorly in 23 eyes (29.5%).
All the mean values of the macular parameters differed significantly between eyes with and without paracentral VF defects ( P ≤ 0.009) ( Table 3 ). The differences between eyes with and without macular VF defects were statistically significant ( P ≤ 0.01) for all macular parameters except the shortest distance in RNFL and GCL + IPL thickness of the thinner hemisphere ( Table 3 ). The mean number of nearest abnormal sectors of circumpapillary RNFL was significantly different between eyes with and without paracentral VF defects and between eyes with and without macular VF defects ( P = 0.04 and 0.02, respectively; Table 3 ).


